Alan Bickerstaff

868 posts

Alan Bickerstaff banner
Alan Bickerstaff

Alan Bickerstaff

@abickerstaff

Corporate & Securities #lawyer representing #entrepreneurs & public & private #emerginggrowth companies.

Austin, Texas Katılım Nisan 2009
825 Takip Edilen360 Takipçiler
G.Martín
G.Martín@GMartin_0·
#Bitcoin This is the “best case scenario” I can imagine going forward until Bitcoin finally finds its cycle bottom. I know there is a lot of information in this chart, but let me explain the main idea. The 3-day chart is one of my favorite timeframes. It sits right in the middle between LTF and HTF, so when I want to get early on a swing-to-long-term move, I constantly check this timeframe. I have been posting bearish takes for a long time. Now I am slowly starting to look for possible bottom setups, because I am beginning to notice some early bottoming behavior... Still early. For new followers: I was neutral in September 2025, expecting shallow higher highs while holding only 50% of my initial BTC position. After the October 10 crash, I gradually became bearish. By the end of October, I was convinced a bear market was coming. Now I am starting to prepare for the opposite side. Bitcoin is probably the only asset with such a clear and recognizable cycle pattern that can let you sell close to the top and buy close to the bottom. As ridiculous as it sounds, people tend to overcomplicate it while Bitcoin remains relatively simple. Will the 4-year cycle pattern last forever? I don’t know. But I am not going to fight it either. Now, about the chart: I have said many times that the 2024 bull market structure would probably create a lot of consolidation during the bear market. It is the strongest and most recognizable zone from the previous bull structure. So it makes sense that many people see it as a possible bottom. But after almost 20 years of trading experience, one thing I have learned is that price often deviates below the obvious support. It liquidates traders, it forces capitulation, it makes everyone go sidelined. And only later, it makes everyone chase the rally. Call it market makers if you want. So the question is: Do we get that classic panic-capitulation bottom again? Or do we get a slow, boring chop until Bitcoin starts breaking every resistance? Since I am not fully sure yet, my strategy is simple. As you know, I still have a short position open from a $79.5k avg entry, and I am looking to close half of it in the mid $50k area. The rest of the position I will hold in case Bitcoin reaches the “panic capitulation zone.” But once BTC enters the “possible bottom zone,” I will slowly start accumulating spot Bitcoin. The reason I will keep half of the short open is to hedge the spot BTC I’ll be buying. If Bitcoin enters panic-selling mode, like it has done in previous cycle bottoms, I will profit from the short while my spot BTC is in a small drawdown. Then I’ll take profit from the short and buy more BTC. If Bitcoin keeps chopping inside the “possible bottom zone” and more bottom signals start appearing, I will keep buying more aggressively and possibly close the short. This is a 3–4 month setup. So we will need a lot of patience.
G.Martín tweet media
G.Martín@GMartin_0

#Bitcoin 2-Week divergences I am not a “fractal” person, but rather a trend/momentum trader. This is the setup I think is very likely to happen. Bookmark it. I’ll be updating it every two weeks. The closer we get to what is supposed to be the cycle bottom date, around September/October, the higher the probability of starting to spot these divergences. Ideally, I want to see lower prices while bearish momentum slowly starts to fade.
English
5
11
49
8.9K
Alan Bickerstaff
Alan Bickerstaff@abickerstaff·
@GMartin_0 To clarify, do you mean add to your short position at $64K if you see some reaction?
English
1
0
0
28
G.Martín
G.Martín@GMartin_0·
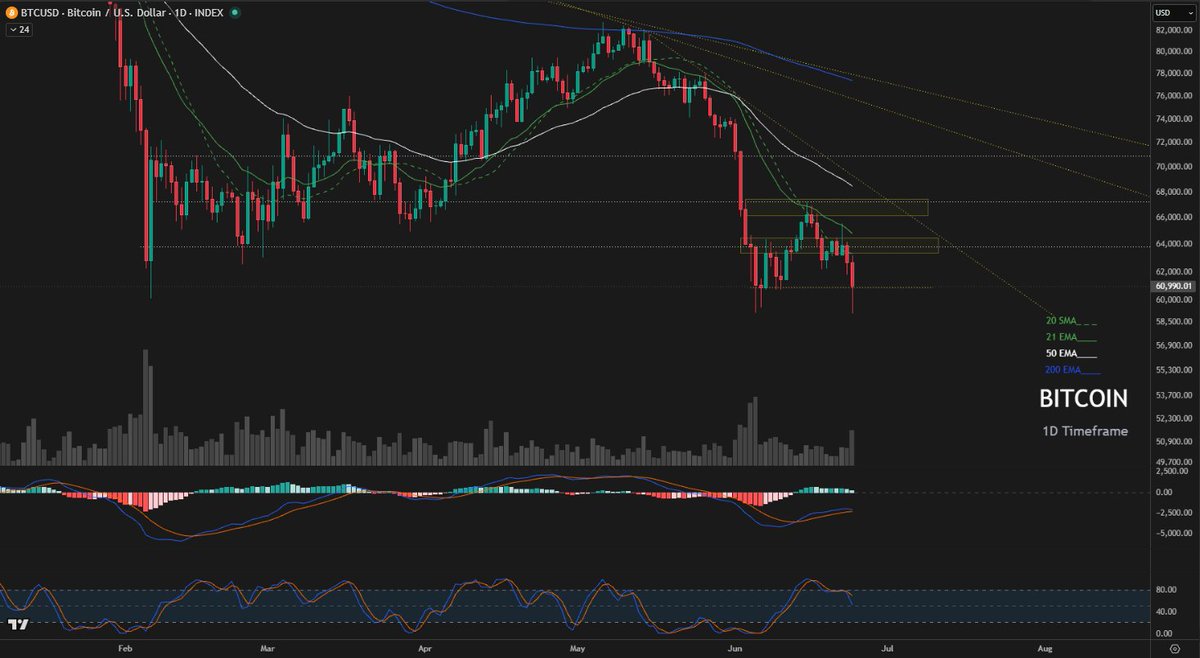
#Bitcoin short position. Short-term, things remain the same. My average short is at $79.5k, haven't added after $66.5k Bearish momentum has kind of dissipated a bit with this strong bounce off the lows, and it seems like the Daily candle will close above $60k. MACD was unable to cross below 0, and with some volume coming in, maybe we get a bounce here. But the two yellow resistance zones should hold. If price bounces into the first $64k zone, I want to see some reaction and might add to my $BTC position.
G.Martín tweet media
G.Martín@GMartin_0

#Bitcoin short position Nothing changes for me. At $79.5k avg entry, my short is risk-free. If $BTC goes lower from here, I’ll TP 50%. If it goes higher, I’ll add shorts up to $69k… maybe $70k? Nothing indicates, for now, that the main downtrend is over. I would argue that many key resistance levels, trend structures, and momentum signals are still intact.

English
3
2
17
3.5K
Giovanni's BTC_POWER_LAW
Giovanni's BTC_POWER_LAW@Giovann35084111·
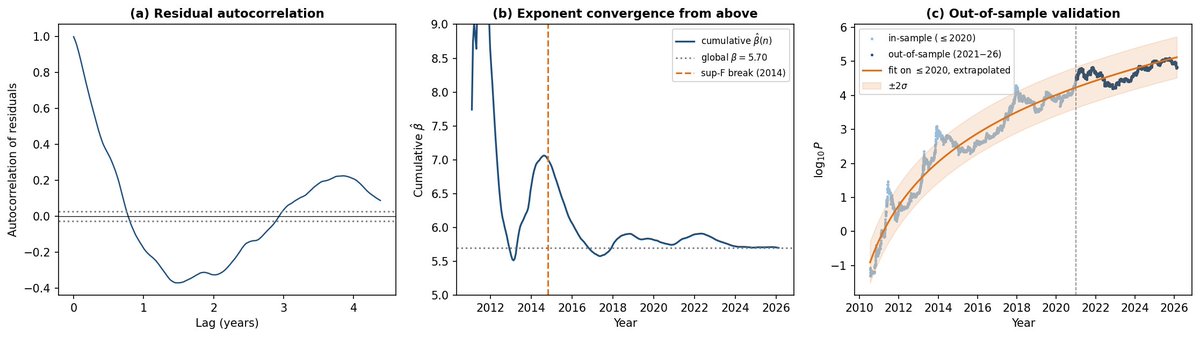
Update on our academic Bitcoin Power Law paper: we show BTC's long-run price follows a power law in time (P ∝ t^~5.7), which decomposes into network adoption growth × Metcalfe scaling. New econometric tests confirm it's not a statistical artifact. The paper has passed editorial revision and reviewers revision with suggested changes that make the paper even better. In the final stages of revision — hoping for publication soon. Will update when it's out. Short thread (if you want the details): 1) Quick update on our peer-reviewed paper on the Bitcoin Power Law We demonstrate that BTC's long-run price follows a power law in time — P ∝ t^~5.7, R² ≈ 0.96 over 2010–2026 — and that the exponent is not just curve-fitting. 2) The exponent isn't arbitrary. It decomposes into two independent scaling laws: network adoption growth (addresses ∝ t³) and generalized Metcalfe value scaling (price ∝ N^1.8). Their product reproduces the measured price exponent. 3) New in this revision — a full battery of econometric tests requested in review: • Residuals are stationary (ADF + KPSS) → not a spurious regression • Price & adoption are cointegrated (genuine long-run link) • The exponent is stable across all four halving epochs — no drift. 4) And the toughest test: fit the power law only on data through 2020, then predict 2021–2026 → 100% of days fall within the ±2σ band.W We're now in the final stages of revision and hope to see it published soon. We'll update the moment it's out.
Giovanni's BTC_POWER_LAW tweet media
English
27
31
284
38.8K
₿lackwidow 🕷
₿lackwidow 🕷@blackwidowbtc·
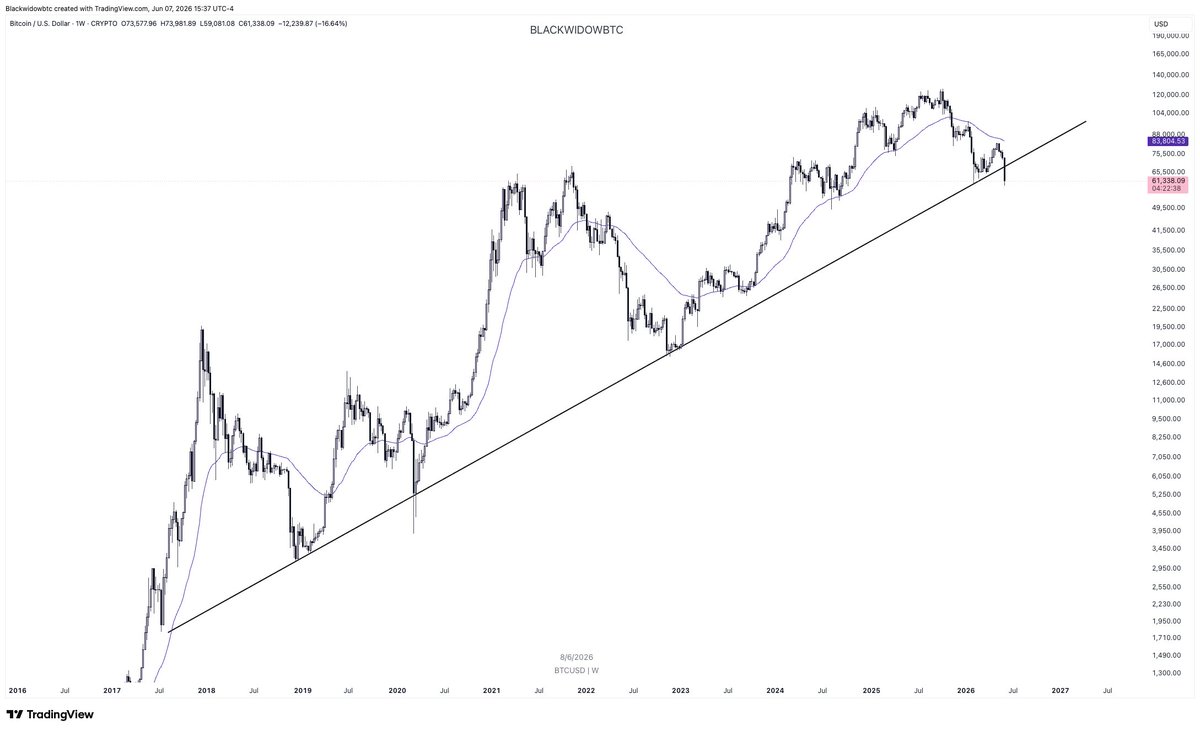
If #Bitcoin breaks this trendline, what bearish narratives can we expect to hear? One of the big ones will be ''Quantum has broken Bitcoin'' And chartists will say ''structure is broken - I don't trust it anymore'' Do you have any more to add?
₿lackwidow 🕷 tweet media
English
23
7
85
18.7K
G.Martín
G.Martín@GMartin_0·
Should I write more long and detailed posts like this, explaining how I interpret #Bitcoin trends?
G.Martín@GMartin_0

$BTC - Downtrend Interpretation & Analysis Since October, I’ve written multiple posts about the 3-year bull market, explaining why the uptrend appeared to be losing momentum. The theory is simple: the key structural support during the bull market was the 50-Week EMA. From there, each rally became weaker, and corrections grew proportionally stronger, until the 3-year bullish momentum finally broke. You can read the quoted post for a more detailed breakdown. Now I’m applying a similar framework to the current downtrend, though more speculatively. The ideal scenario to identify a potential cycle bottom would be to measure each decline, with corrections gradually becoming less aggressive while volume increases. This isn’t the only possible outcome. We could also see one final sharp capitulation followed by a strong reversal that breaks the bearish momentum. As shown in the chart, the first major drop from the top was –36%, the largest in three years. Then came February’s decline, which confirmed the bear market with a –39% move and classic breakout volume. From here, I expect several months of consolidation, potentially with lower lows. If the next decline is less violent than February’s, that would suggest the downtrend is nearing exhaustion. The best opportunity, in my view, would come from a final breakdown of the “bear market structure” that appears weak in price but accompanied by huge volume, signaling capitulation. In the meantime, my strategy is to scale in gradually over the coming months to build a solid average entry preparing for the next bull market. #Bitcoin

English
10
0
17
545
Alan Bickerstaff
Alan Bickerstaff@abickerstaff·
@GMartin_0 Your calls and analysis are awesome! I am glad you showed up in my feed. Ignore the trolls!
English
1
0
1
36
G.Martín
G.Martín@GMartin_0·
My #Bitcoin calls so far: In October ’25, I said the top was in and price would fall to $80k. At $80k, I said price would bounce into the $97k–$105k range, and it did. During that bounce, I said people would FOMO, call bears stupid, and then BTC would go to the $60k–$70k zone. Once it reached $60k, I said price would chop and consolidate for many months, and would probably bounce into the $78k–$85k range, making everyone believe the bear market was over... People would FOMO and call bears stupid… AGAIN. Since then, I’ve been warning that the rally into that zone could be a trap, and that most likely we would see lower lows. Meanwhile, scammers like PlanC, TechDev, and many other larpers increased their follower counts by 20k or more… Can someone explain to me how the stupid X algo works? Maybe I should just move my deep analysis and calls somewhere else apart from Substack.
G.Martín@GMartin_0

I just wrote a new Substack article explaining WHY I keep claiming that #Bitcoin has not bottomed yet. Yes, I sound like a broken record, but I have been right all along calling for a bear market since October while everyone was still bullish... And I am still right about more downside to come.

English
10
2
31
1.1K
G.Martín
G.Martín@GMartin_0·
If you are a new follower, or at least started following me since October, you might think I am a Bitcoin permabear… I am not. This was my third cycle trading $BTC, and during the last bull market I was ultra bullish from early 2023 until mid-2025. Then I became cautious in September, although I was still holding 50% of my BTC position, and then turned fully bearish after the October 10 crash, selling 95% of my Bitcoin at a $116k average. I have no rush to buy yet. Was $60k the bottom? I don’t think so… but it is still too early to know. Most of the people celebrating this relief rally as the cycle bottom are the same ones who have been calling “BOTTOM” for the last 6 months. To me, it sounds more like a desperate bottom call because they are still in a massive drawdown. They can sound smart, but when you are down -50% on your holdings, you start doubting your own convictions about an asset that still needs to go through the test of TIME. I am comfortably doing short-term trades while waiting for clear technical signals to buy with size again. From a macro perspective, everything looks fragile. People are confusing the AI rally and strength with a healthy and booming world economy. After the Fed started hiking rates aggressively in 2022, we went through the longest yield curve inversion, and now we are currently in the longest disinversion. These macro signals take so much time to develop and show cracks that people tend to forget about them. We are currently in a massive yield bear steepening, and it’s worrying to see so much euphoria everywhere while the real economy around the world is struggling with higher inflation, very slow job creation, and credit getting more and more expensive. As I said, I remain short-term bullish on trending assets and I’m taking every opportunity I can, but I remain very cautious.
G.Martín@GMartin_0

bitcoin:native - Maybe some chop around $80,000 before breaking the Monthly open? If I see something like this, a strong rejection at 80k range, I might be adding more shorts.

English
7
2
37
3K
₿lackwidow 🕷
₿lackwidow 🕷@blackwidowbtc·
One more big post here in a few minutes and then im taking a vacation into discord lolol
English
5
0
43
2K
₿lackwidow 🕷
₿lackwidow 🕷@blackwidowbtc·
Out of everyone on all my platforms, only like 5 people congratulated me on catching the move down to 60K And even fewer on catching the biggest pump at the pico lows to the 80Ks since then I know who my real friends are Love uw guys, truly 🥰
English
21
2
141
3.1K
Giovanni's BTC_POWER_LAW
Giovanni's BTC_POWER_LAW@Giovann35084111·
Come and get a signed copy. I'm at the Minotaur booth at the Las Vegas conference. You can DM me too.
Giovanni's BTC_POWER_LAW tweet media
English
26
27
424
11.4K
Giovanni's BTC_POWER_LAW
Giovanni's BTC_POWER_LAW@Giovann35084111·
@david_eng_mba Power laws accounts like yours mine should have millions of followers. It is due to a mix of science illiteracy, personality traits, and politics that we are not the top accounts. I say this in a very serious manner.
English
11
3
62
4.8K
David
David@david_eng_mba·
The biggest Bitcoin accounts reach millions. Many are just noise. But how many actually help people make better decisions? To me, the best accounts build your framework so you understand Bitcoin deeply enough not to sell. That’s signal. The rest is noise. Which accounts have actually helped you understand Bitcoin better?
David tweet media
English
16
6
65
4.9K
₿lackwidow 🕷
₿lackwidow 🕷@blackwidowbtc·
@BeetCornFlower Same as before - must hold 78K to invalidate it Basically like 95K was the level to flip in the previous one It can overshoot like it did before - it just has to hold it
English
1
0
7
275
Giovanni's BTC_POWER_LAW
Giovanni's BTC_POWER_LAW@Giovann35084111·
The Physics of Bitcoin website is ready. It is going to be a companion to the book with additional learning material (code, visualizations, live charts, videos and so on). It is a work in progress but bookmark it because it is going to be an important resource for understanding Bitcoin as a system. Link to the website in the comments.
Giovanni's BTC_POWER_LAW tweet media
English
4
11
80
7.2K