

Art Steinmetz
10.8K posts
Art Steinmetz
@adababbage
Where I hang to be part of the data science community, especially R. Retired CEO, OppenheimerFunds. Former Chair, Nat. Museum of Mathematics. Also @apsteinmetz
New York Katılım Haziran 2009
42 Takip Edilen203 Takipçiler

#HowIUsedGISToday
Check out this excellent GIS app that allows you to explore in 3D the Wadati-Benioff zone & other seismic patterns in the mantle. Could be used either as teach from the front by pupils. Hour of endless fun with this GIS app!
seismic-explorer.concord.org
English
@kyle_e_walker @duckdb Interesting. When using duckplyr using group_by(col) |> summarize(...) forces a fallback to dplyr. I have to use the equivalent, summarize(.by = col,...)
English


Kyle Walker@kyle_e_walker
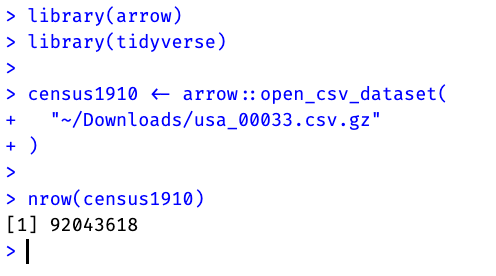
The pace of innovation in data science is astounding (and I'm not talking about AI!) 2 years ago, I wrote in my book about analyzing a 92 million row @ipums CSV file using a database in #rstats Now: just point `arrow::open_dataset()` at it and ` collect()` what you need!
English
@kyle_e_walker @ipums Arrow for R is cool because it uses tidy vernacular out-of-the-box. I find that duckDB is even faster, uses the Arrow file format and, with the duckplyr package, is nearly seamless with tidy verbs.
English

@denis_mongin @kyle_e_walker @duckdb @rdatatable Whatever works for you but it's so easy to use duckDB with duckplyr there's no reason not to try it.
English

📚Open access! Statistics books👇❤
1-modernstatisticswithr.com/index.html
2-openintro-ims.netlify.app
3 -directory.doabooks.org/handle/20.500.…
4-usq.pressbooks.pub/statisticsforr…
#AcademicTwitter #MachineLearning #networkscience #rstat #R #datascience #statistics #neuroscience #bioinformatics #PhD #postdoc #Python

English
@kyle_e_walker @OvertureMaps Wow. Thanks for sharing this. I've been struggling, on and off, for years to get a good data set of NYC building polygons. The NYT has no trouble but I have. I didn't know about Overture. Separately, the duckplyr package makes duckDB as "tidy" as Arrow...and faster.
English
Tutorial: query the 2.35 BILLION row global buildings dataset from @OvertureMaps in #rstats and visualize in 3D w/deck.gl
Learn about the `open_dataset()` function in R's arrow 📦, which might change your life (or at least your work with big datasets)
walker-data.com/posts/overture…
English
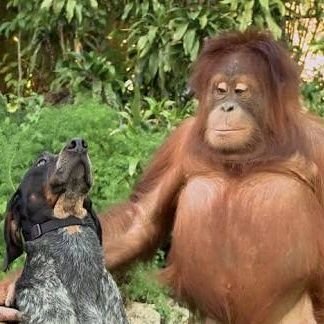
Huge oceanic Manta Ray spotted near Trinidad. There is a shark of scale.
English
@JosiahParry No.
Start every R big DB session with
library(tidyverse)
library(duckplyr)
methods_overwrite()
Watch everything run superfast without using any SQL. That's nearly all you need to know about duckDB.
English
@rbhar90 You get the answer to the question you ask. "Random" isn't in the prompt. This is the answer to the question "What number between 1 and 100" appears most in your training set?
English
Art Steinmetz retweetledi

Some context: We don't invite speakers, they respond to the call for presenters. We usually get 50+ submissions. We have 25 right now. There are usually some women in that group. Right now there are 0. That's why I specifically mentioned the need for women speakers.
English
@vsbuffalo I've been toying with migrating from #rstats to Python and quickly went down the rabbit hole of so. many. environments. WTH? It's a S*show. In R there is one ring to rule them all.
English

I'm so sick of conda, and considering moving to pyenv + uv (+ poetry for packages). It seems to work much more slickly. Is there a more preferred way to deal with Python packages?
English
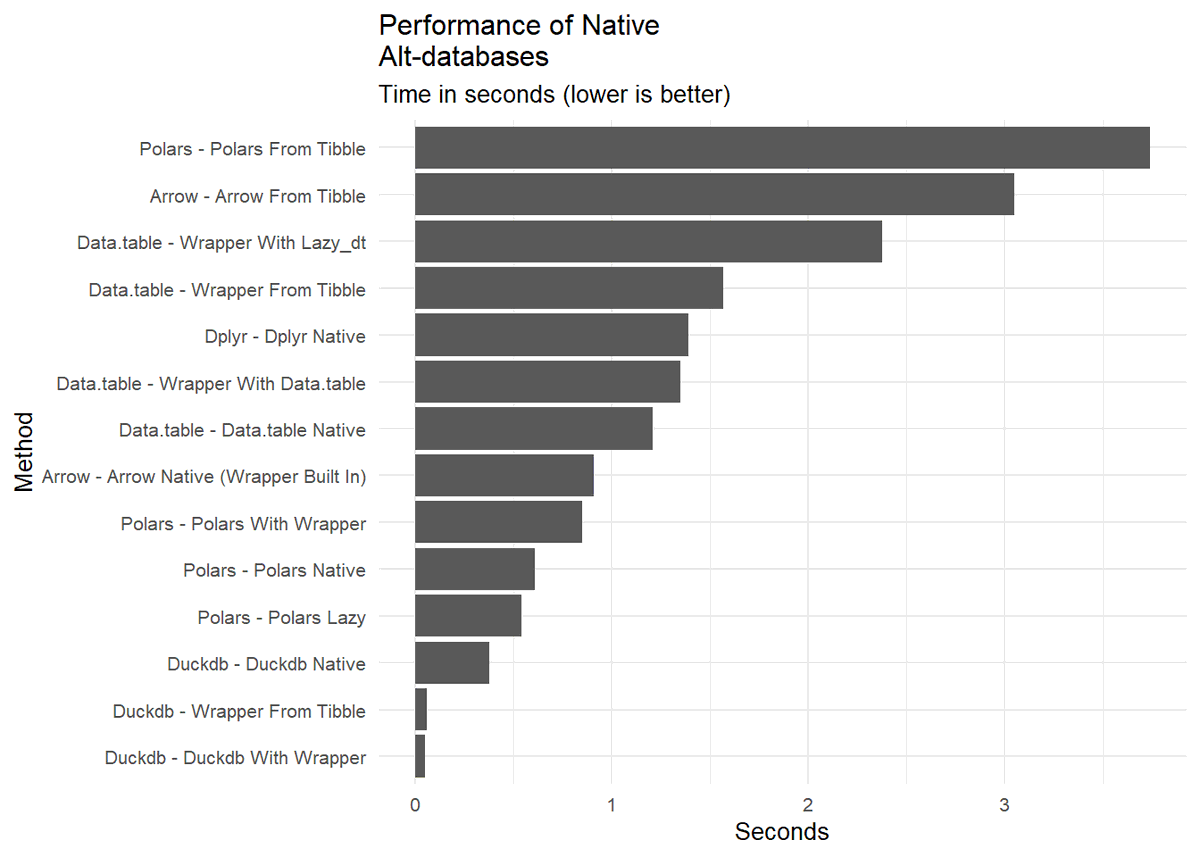
So many great #rstats database engines. Data.table, Arrow, duckDB and polars. There are #tidyverse wrappers for all of them, but should you use them? outsiderdata.netlify.app/posts/2024-03-…
English
@MrLarrieu @duckdb Thanks for sharing. I am going to try this in R with my Sunpower system. I also have Tesla batteries so I'm not sure how to interpret the data.
English
@RitchieVink Hopefully this is not a loaded question, but how do you generally feel about the tidy wrappers (R/Python) around Polars? Too much overhead, lacking functionality? Or, full-featured and efficient?
English

We have completely rewritten our String/Binary types in Polars. This was the largest refactor of my life! (not kidding).
Please give our new RC a try and see if all goes well for you: pypi.org/project/polars…
Expect performance improvements for many core operations.
English


Tulsa, OK 🇺🇸 English
@EmilyRiederer @quarto_pub I'm adrift with hand-rolled CSS. This is totally stock.
English

@adababbage @quarto_pub Wow yours looks great! May be digging into your CSS (and custom listings?)
English
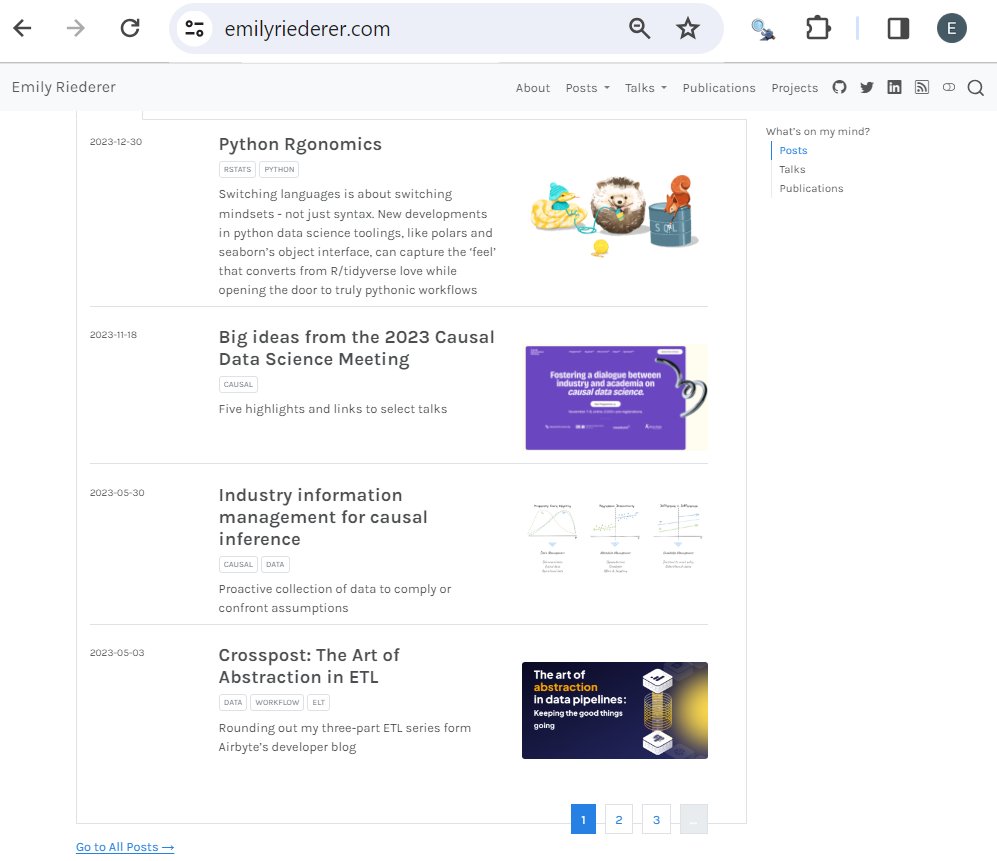
New Year, New Site -- after many hacks to preserve all my post / talk / RSS links, I'm finally ending 2023 by switching my blog down to @quarto_pub !
Didn't write much in 2023, but I'm hoping Quarto's nice, lightweight framework will lead to a productive 2024
English
@EmilyRiederer Old dog. No new tricks. I have wrestled a few Python scripts but managing the environment is alien. VS code is for coders, not data scientists. Let's see what Posit comes up with as they become more language agnostic.
English
Any #rstats-ers have learning python in their 2024 resolutions?
Learning a new language, it's hard to abandon the workflow you know and love. In my last post of 2023, I recommend some of the latest python pkgs/versions with similar ergonomics
🧵1/n
emilyriederer.com/post/py-rgo/
English
@macro_synergy "Kelly Betting" in investment management is a feeling, not a measurement. Can I quantify my "edge?" Can I quantify my payoff in "winning?"
English

"Maximizing Portfolio Predictability with Machine Learning": "Portfolios that take advantage of... predictability of returns and employ a Kelly criterion style strategy consistently outperform the benchmark." econpapers.repec.org/paper/arxpaper…

English
@gt_package Cool stuff but I'd like to understand how y-scale ranges are set. My nanoplot bars use only a small fraction of the available cell area.
English
[NEW FEATURES]
PR#1515 (github.com/rstudio/gt/pul…) allows for positive and negative horizontal bars (with separate colorization options) for 'bar'-type nanoplots. The improves upon the previous PR that introduced the feature. (Nanoplots = tiny plots you can use in your gt table.)
English