
Working on H3 integration into freestiler, my R/Python vector tiling tool.
The new feature uses @duckdb internally to dynamically aggregate points into a multi-layer hexagonal tileset based on some function (summary stats, or your own custom SQL).
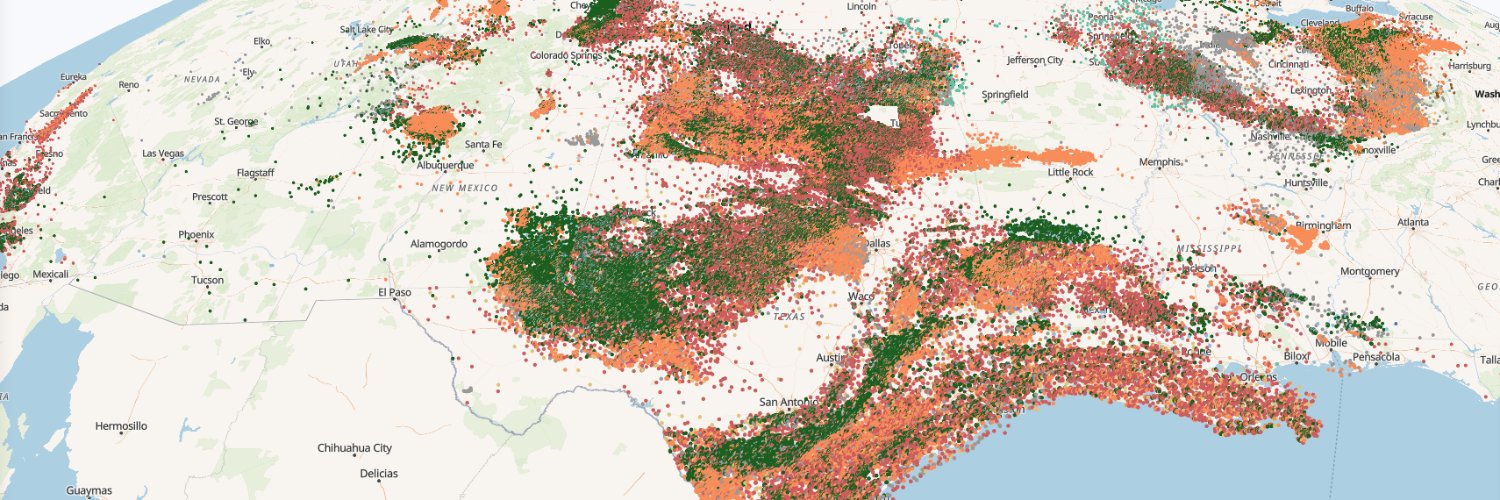
Shown here: the 12M US groundwater wells dataset. Hexagons are styled by modal category and H3 resolution changes by zoom level in @Mapbox, giving way to individual locations at zoom 10.
English