
English
Adam Pettitt🏳️🌈 (he/him)
2.2K posts
@adampettitt89
PhD Student in Clinical Psych at U Oregon, working at a mental health startup. I'm mostly here to amplify marginalized voices.🏳️🌈 @[email protected]


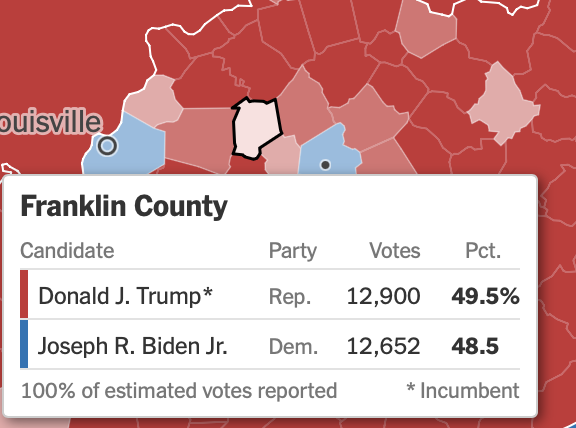
Polls close in most of Indiana in 17 min Keep an eye on Hamilton County — lots of college grads (61%), suburban, affluent, left tending area (R+34 in 2012, R+19 in 2016, R+7 in 2020) If Harris looks like she’s doing better than R+7, might be a good sign for her in similar areas


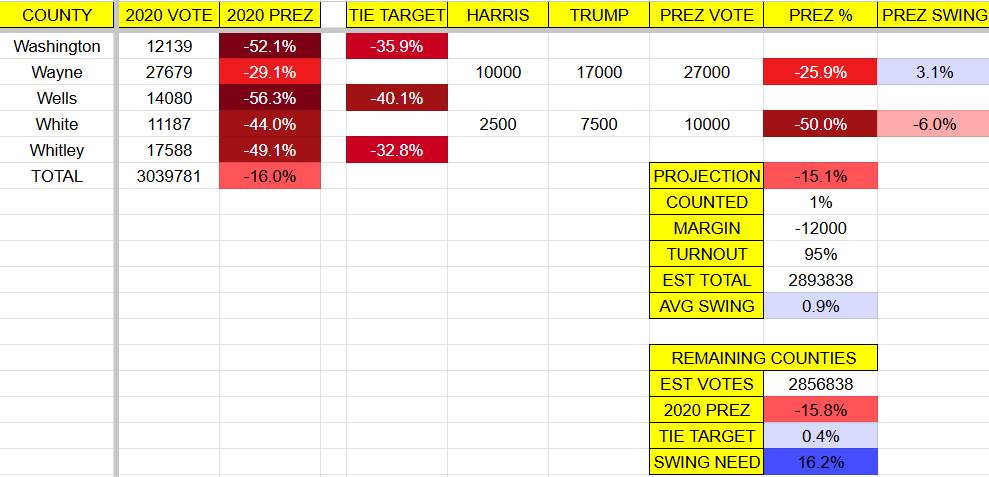
Finished working on a niche personal Election Night tool for the express purpose of projecting and calling races an hour ahead of everyone else 🙃. If anyone wants a copy, DM me, but warning that this is only meant for people with no life on Election Night.


The max of n independent Gaussians concentrates around sqrt(2log(n)). The max central limit theorem allows one to quantify this. en.wikipedia.org/wiki/Fisher%E2…


I recently made a very popular LinkedIn post about Simpson's Paradox, which resulted in an engaging conversation. Paul Julian made a great comment on the relationship between Mixed Effects Models and Simpson's Paradox that I wanted to share with you. He pointed out that when specified correctly, Mixed Effects Models can avoid being fooled by Simpson's Paradox. Unlike a naive linear model that analyzes all data at once, which might lead to misleading conclusions, mixed effects models separate fixed effects (consistent effects across all groups) and random effects (group-specific deviations from the overall trend). This allows the model to account for variations both within and between groups, leading to more accurate interpretations. In the plot below (generated from reproducible code – thanks, Paul!), you can see how different models compare: 🔹 Fixed Effect (black line): Captures the overall relationship, assuming it is the same across all groups. 🔹 Group Linear Model (dashed red line): Shows the trend within each subgroup, revealing how group-specific relationships can differ. 🔹 Naive Linear Model (gray line): Fails to account for subgroup differences, which can lead to misleading conclusions due to Simpson's Paradox. 🔹 Random Effect (blue line): Captures the variation between groups, allowing for group-specific deviations from the fixed effect. Here's the original post: linkedin.com/posts/joachim-… Important Notes: Mixed effects models offer a flexible framework to address Simpson's Paradox, effectively capturing both group-level and overall trends. However, they have limitations and alternative approaches should be considered. Mixed models, like any statistical tool, can be mis-specified if key variables are omitted. In certain cases, simpler models like OLS can handle group effects just as effectively, provided the predictors are correctly specified. For longitudinal or clustered data, marginal models like GEE or MMRM may be better suited when the goal is to estimate population-average effects, especially since mixed models focus on conditional, subject-specific effects. Additionally, Simpson’s Paradox requires careful causal understanding. Grouping variables can either be confounders or colliders, which influences the choice of model. An inappropriate adjustment can lead to incorrect conclusions, making it crucial to understand the causal structure before deciding whether to use a mixed model or a simpler approach. For regular tips on data science, statistics, Python, and R programming, check out my free email newsletter. More information: eepurl.com/gH6myT #R4DS #RStats #DataAnalytics #Statistical #database #DataVisualization