@Matt_E_Baumann@ChadMoran Yes, plenty of data out there showing the new packs have faster capacity loss (perhaps 30% faster, a little hard to say exactly) than the old packs. Also they charge much more slowly.
Now you can see Tesla battery degradation per mile broken down by model year.
#retention-curves" target="_blank" rel="nofollow noopener">teslaroamer.com/stats#retentio…
@rebel1996@ChadMoran It is if you're in the US. These packs are real bad. It's too late for yours, but if you want to slow it down store at 50%, daily charge limit of 50%. You can charge higher to 100% or whatever whenever you want (minimal impact if you use it right away).
@warrenheld@ChadMoran The NMC packs do well. at 1.85% degraded from 122.5kWh, 120.2kWh, you're at 3% degraded from EPA capacity and your start capacity of 124kWh. (You don't show loss of range, but you have range loss, until you drop below 122.5kWh.). 124kWh is required to make EPA rating.
@V1ado@ChadMoran Lithium packs like being at quite low %. 0% SOC on Tesla is about 10% SOC coulombic which is good. Shallow depth of discharge does help, but it's minor. Not the same chemistry as many hybrids. Plus hybrids need to optimize their system efficiency.
@V1ado@ChadMoran Only thing that really helps (and it's not huge) is to keep storage charge around 50%. Capacity loss is dominated by calendar aging. Though of course mileage also does reduce capacity. Low depth of discharge is good but not a significant factor.
@ChadMoran But you can skew this by controlling your depth of discharge… not letting your battery fall below a certain percentage doesn’t even register as a “cycle”
@ChadMoran Again, EPA range requires a certain energy. It’s not the number on the display. Tesla makes displays match, over wide range of energies below EPA-required energy (the range between starting capacity and the degradation threshold, some call it a top buffer but it’s no buffer).
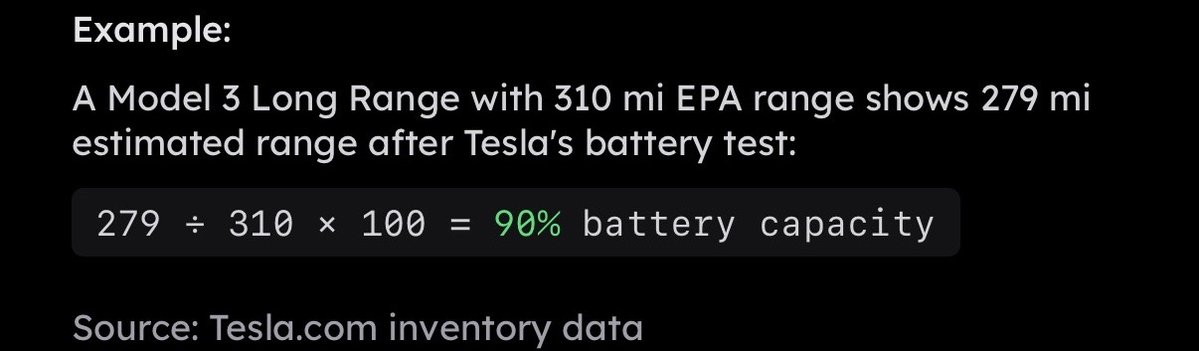
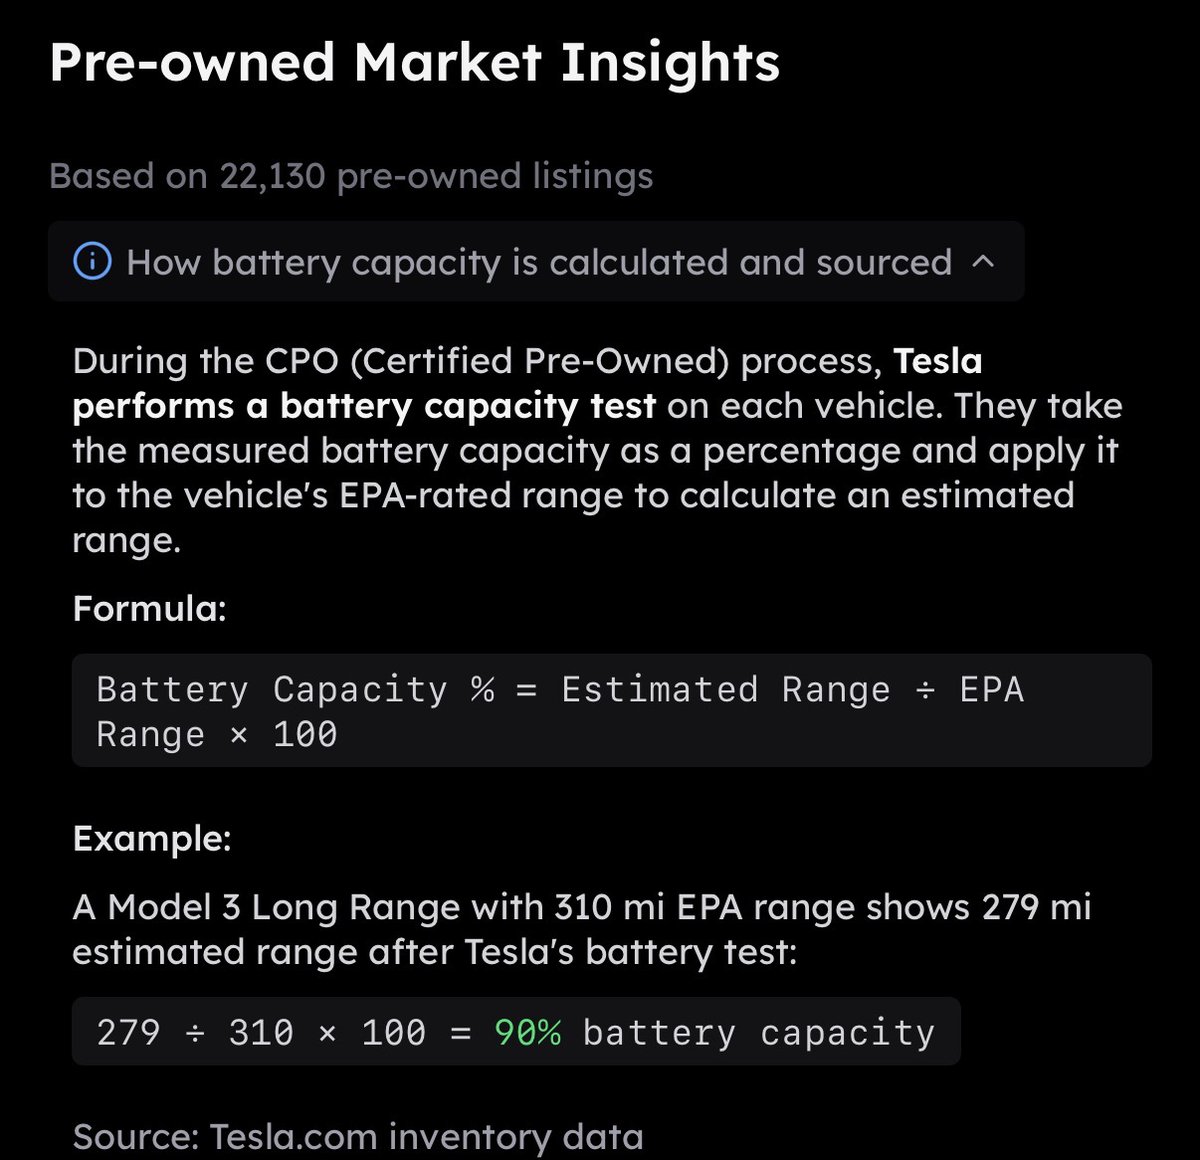
@ChadMoran I have this vehicle: constant is 245Wh/mi. If it shows 279mi, the car and CAN bus tools show pack capacity to be 68.4kWh. The car started at 78-79kWh per CAN tools and EPA test document. So that is 12.5%-13.5% range loss. Battery test will show about 10%.
@ChadMoran I know that is what they say, but look at their example. And if you run a battery test you’ll see exactly the same thing - it gives a % not kWh. How do you know the denominator? I know they make it deliberately confusing. I can explain further with their specific example.
@ChadMoran That’s fine, nothing wrong with the site - it is excellent data. I am just pointing out that because of the threshold to full pack difference from year to year, it artificially makes some years look different than others. If you know the correction no big deal.
@ChadMoran What is your current capacity? You started at 82kWh. If you are down 1kWh you are showing 76.5kWh and about 323 rated miles (1% displayed loss). You have lost 6-7% of your range and your capacity. That is why you show 1% displayed range loss.
@ChadMoran Not sure whether you do based on the other comments. All I care about is actual range loss for a set of conditions (e.g.EPA, or a certain road trip in an exact set of conditions exactly equal to another time the trip was done), which is capacity loss.
@ChadMoran The EPA is done with 81kWh approx. You can look it up. An MYJ will show 327mi with 77.5kWh at 237Wh/mi. Zero displayed range loss. 77.5kWh will yield 4% less than EPA (at least).
@ChadMoran That is not true. The EPA test uses 81kWh (approx). You will show NO displayed range loss for MYJ until you get to 77.5kWh, and you will be 4-5% short of EPA if you did the EPA cycle with 77.5kWh showing no displayed range loss.
@ChadMoran I’m talking about range loss, not displayed range loss. Remember, when the car is new, each rated mile contains MORE energy than the “constant.” This is well known. What matters is range for an exact same set of conditions, then it is exactly the same as capacity loss!
@ChadMoran The EPA range is done with 80-81kWh. Actual start capacity is 81-82kWh. That’s why cars don’t show range loss for months, when they are losing range most rapidly!
@ChadMoran That is the impact to *displayed* range. But notice for example with Model Y Juniper, 327mi at 237Wh/mi, 77.5kWh, you can lose 5% of start capacity of 82kWh (and 5% of range), while *showing* no range loss.
@ChadMoran I was basing it on this, which is correct % loss with respect to degradation threshold, but misses 1-5% of capacity loss: larger amounts missed for recent model years, while e.g. 2020 it was just 1% lower than full pack. I can give other examples if you want.
@ChadMoran Degradation threshold is as much at 5kWh below original capacity on new cars (still show full rated range after losing 5%!), while on older cars it was less - just 1% in 2020 (77.8kWh, start capacity 79kWh).
@ChadMoran You need to convert the miles to kWh using the corresponding vehicle constant, and reference to original capacity (78-79kWh through 2020, 81-82kWh from early to mid 2021 until now, excluding MYPJ). Otherwise top degradation threshold makes some years look better.