The only truly advanced Financial Terminal. Macro data, on-chain analytics, and algorithmic Strategies. Join the free Discord 👇
https://t.co/x3xX9a3YGJ
Trying to time macro turns on pure gut feeling is a quick way to blow up an account. You need a systematic way to gauge momentum expansion and regime shifts.
That’s where the AlphaS Normalized index and the AMT Strategy come in. This system quantifies structural shifts on a 0-100 scale, filtering out local noise to define clear macro execution zones:
Long Threshold (81): Confirms structural bull expansion (Gold).
Short Threshold (43): Confirms structural bear expansion (Cyan).
Extreme Bands: OB (>87) and OS (<13) mark severe statistical overextension.
Look at how cleanly this mapped the entire narrative over the last few months on second picture and first picture.
During the April and May 2026 push, the index forcefully broke above the 81 threshold and pinned at 100. That confirmed a high-conviction structural long trend, riding the move up toward $80k+.
But the regime changed fast. By late May, the index completely collapsed, slicing clean through the 50 midline and breaching the 43 short threshold. The system flipped hard into a short trend (Cyan), catching the breakdown below $60k before the floor dropped out. The flush was so violent it sent the index deep into the oversold zone near 0.
Right now, as we sit in late June, we are seeing a minor relief bounce, with the index ticking up to 19. But don't mistake a local bounce for a structural reversal. At 19, AlphaS remains pinned deeply inside the short regime territory. Until this index builds a base and climbs back above the key thresholds, the macro bias stays firmly defensive.
#BTC#macro#crypto#quantitative#trading
Market Outlook
After the sharp selloff from the Asian markets, $NDAQ and ES lost momentum and trader participation. During the last two days, both markets have remained in a weak consolidation phase with poor price action and no clear direction.
Volume has decreased, buyers are showing less aggression, and the market appears vulnerable to further downside movement. If this weakness continues, billions of dollars could leave the market in the coming sessions.
The next target remains the sell-side liquidity below recent lows. A liquidity sweep could occur before the market finds a new direction.
Trading Notes:
Follow liquidity, not emotions.
Stay patient during consolidation.
Wait for confirmation before entering.
Set clear take-profit targets.
Protect capital with strict risk management.
The trend is uncertain, but liquidity remains the key focus.
The full cycle valuation of our Tevex valuation engine is showing a reading of almost -2, meaning BTC is currently very undervalued. It might be a good time to start dollar cost averaging into bitcoin:native.
Crypto doesn't move in a vacuum. If you want to understand the true macro driver behind Bitcoin's trend shifts, you have to follow the money—specifically, global dollar liquidity.
The Dollar Liquidity Drain Index maps this dynamic out perfectly. When the index runs red, dollar liquidity is actively being sucked out of the system (highly toxic for risk assets). When it flips green, liquidity is being injected back into the market.
The direct impact on price becomes obvious when you compare the underlying mechanics on the first picture with BTC's actual reaction on the second picture
Look at late January and early February. The index suffered a severe liquidity drain, with the Z-score screaming past +2. Right on cue, BTC got completely hammered, collapsing from $94k down to under $70k. The yellow dashed line in mid-February marks the exact moment that aggressive drain finally topped out—the immediate pressure released, allowing BTC to form a local floor.
Through March and April, the index flipped back into a heavy green injection phase. That steady macro tailwind gave the market the exact fuel it needed to lift BTC back up above $80k. But the relief didn't last. In May, a fresh liquidity drain spiked the index back into the red, and right on schedule, BTC rolled over again, bleeding back down toward the low $60k range.
Right now, as we move through late June, the drain has finally exhausted its momentum and is crossing back below the zero line into green territory. The acute selling pressure is taking a breather, but the market needs to see a deeper, more sustained injection trend build out here before BTC can comfortably mount its next major macro expansion.
#BTC#macro#liquidity#crypto#quantitative
🚨 Stop measuring the long-term value of Bitcoin solely in debasing US dollars. Fiat inflation and endless currency printing warp the clean price signal. If you aren't pricing BTC against the fundamental anchor of global liquidity (Gold) you are essentially trading blind.
BTC-Gold Relative Value Model strips away the fiat illusion and maps exactly where Bitcoin sits within its historical statistical baseline relative to gold. No arbitrary price forecasts, no subjective targets, and zero curve-fitting.
Here is the exact mathematical logic behind it and why it changes risk management:
- Statistical deviation envelopes: Instead of arbitrary support and resistance lines, the model constructs descriptive +- 1sigma and +- 2sigma bands. These are built using a rolling Median Absolute Deviation (MAD) in log-space to accurately capture true market volatility.
- Objective state classification: The algorithm categorizes the market into 5 non-discretionary regimes: from critically undervalued, through balanced (FAIR), to significantly overextended.
- The panic filter: During aggressive crypto corrections, when social media descends into macro hysteria, this model identifies whether the market structure is actually broken or simply mean-reverting toward its historical anchor.
When price expands outside the 1sigma band, it isn’t an automatic reversal trigger - it’s a quantitative warning to refine position sizing and risk exposure.
While retail traders chase emotional headlines, AlphaScope subscribers track the raw purchasing power between the world’s two dominant hard assets. Statistics don't care about the narrative. They measure reality.
#Bitcoin#MacroEconomics#QuantitativeAnalysis
Today was a relatively quiet day in the U.S. markets, but in Asia and London we witnessed a significant price decline. This happened for both known and unknown reasons.
First, markets are expecting higher inflation, which increases the likelihood of future interest rate hikes. At the same time, investors have become more cautious after the major corrections we have recently seen in the $NDAQ .
Despite the volatility, I took a long trade today that was also enjoyed by our copy-trading investors. This demonstrates the potential of generating passive income—not with returns of 8%, but with significantly greater opportunities when market conditions align.
For more information, join the Alpha Scope Discord community and visit our website, where we regularly share market insights, trade setups, and educational content.
Today's long position was an A+ setup according to our trading model, meeting all the key criteria and providing a high-probability trading opportunity.
Price action without volatility context is just noise. If you're chasing trends without adjusting for shifting vol, you're bound to get caught in the chop!
That’s why we use the Volatility-Adjusted Mean Structure (VAMS). Instead of just trailing price, it normalizes price deviations against asset volatility to isolate the true structural trend. It strips away the noise and gives us a dynamic Z-Score. A positive bias (>0) means a structural bull regime (green), a negative bias (<0) means a structural bear regime (red), and the ±1 band edges show areas of severe trend expansion or major macro exhaustion.
Look at how this played out recently. On the first picture, BTC spent April and early May coasting in a solid structural bull trend, riding comfortably above the purple center line.
But the real underlying mechanics played out on the Z-score view in the second picture. Late May was the warning shot,the Z-score slipped below 0, signaling that bulls lost macro control and shifting the system into a bear regime.
What followed in early June was a massive flush. The Z-score didn't just tag the -1 band edge; it violently overextended all the way down to nearly -2.6. That is a severe statistical anomaly showing pure, exhausted seller capitulation.
Since printing that floor, we've caught a sharp mean-reversion bounce. Over the last two weeks leading up to June 22, the Z-score aggressively recovered from the depths back up to around -0.3, stabilizing price in the mid-$64k range.
The worst of the flush is behind us for this leg—the extreme downside energy has been entirely absorbed. However, we aren't completely out of the woods yet. The Z-score is still trapped below the 0 baseline, meaning the macro structural bias remains defensive. We need to see a clean flip back into positive territory to confirm the next real bull expansion.
Stop trading the noise. Start monitoring the pipes that transport the capital.
#BTC#Macro#Crypto#QuantitativeAnalysis
WHILE THE MAINSTREAM MEDIA IS JUST STARTING TO WHISPER ABOUT MACRO SLOWDOWNS, THE UNDERLYING DOLLAR PLUMBING HAS ALREADY BREACHED THE CRITICAL TRANSITION THRESHOLD.
Waiting for lagging GDP revisions to confirm a cycle shift is how macro portfolios get caught on the wrong side of liquidity liquidations.
In our last macro update, our Global Recession Probability Index sat comfortably at 31.5/100 within the 'Early Warning' zone, indicating that a systemic cliff was not the baseline probability.
The mathematical reality has just shifted dramatically. GRPI has broken clean through the critical 50% midpoint and is currently flashing 56.8/100, mechanically locking into the Strained Risk Regime.
Here is the quantitative diagnostic of what has changed across the 4 structural layers over the last few weeks:
- L4 liquidity contraction transmission: The initial warning we flagged in our Global Liquidity Momentum engine (the synchronized 4w/13w/52w Z-score rollover) has officially filtered into the macro matrix. The drainage of global reserve liquidity is no longer a friction - it is actively forcing contraction.
- L2 + L3 convergence stress: Leading Economic Indicators (L2) have experienced a sharp directional deterioration, while Credit Markets (L3) (monitored via raw ICE BofA High Yield Options-Adjusted Spreads) are beginning to price in dealer balance-sheet constraints, ending the regime of cheap credit.
- Confidence interval expansion: Our 90% block-bootstrap confidence interval has shifted its baseline upward. The statistical buffer that kept risk assets insulated during the 'Early Warning' phase has evaporated, signaling that market fragility is now at its highest macro level of the cycle.
- AlphaScope subscribers did not have to guess this pivot. They didn't watch the news. They watched the 18 international recession baselines re-calibrate in real-time as the index crossed the 50 line, systematically protecting their capital before correlations asset-wide began to tighten.
The plumbing is tightening. The margin for macro error is now zero.
#MacroEconomics#RiskManagement#QuantitativeAnalysis
The classic stop-hunt trade played out perfectly on the $NDAQ today. As expected for a Monday, we had a very clean setup, which I personally took and which was also executed in the Alpha Scope copy trading account.
From a technical perspective, this was an A+ setup. However, we did not see significant continuation to the downside. The main reason for that was the typical low-volume conditions that often occur on Mondays. Market participation was relatively light, limiting the momentum after the initial move.
There are currently no major news events or economic releases driving the market, which could set the stage for a cleaner trading week ahead. Without major catalysts creating unnecessary volatility, we may see price action develop more naturally, with volume and opportunities emerging during regular market hours rather than through large pre-market moves.
Stay ahead of the market and don't miss important trading insights. Join the Alpha Scope Discord community to receive real-time updates, trade setups, market analysis, and exclusive information throughout the week.
discord.gg/3yDCar9z
🚨RETAIL IS CURRENTLY DISTRACTED BY DAILY PRICE NOISE, WHILE THE UNDERLYING ENGINE DRIVING ALL RISK ASSETS IS RAPIDLY RUNNING OUT OF FUEL.
If you are managing capital without tracking multi-horizon liquidity velocity, you are essentially flying a plane blind into a structural storm.
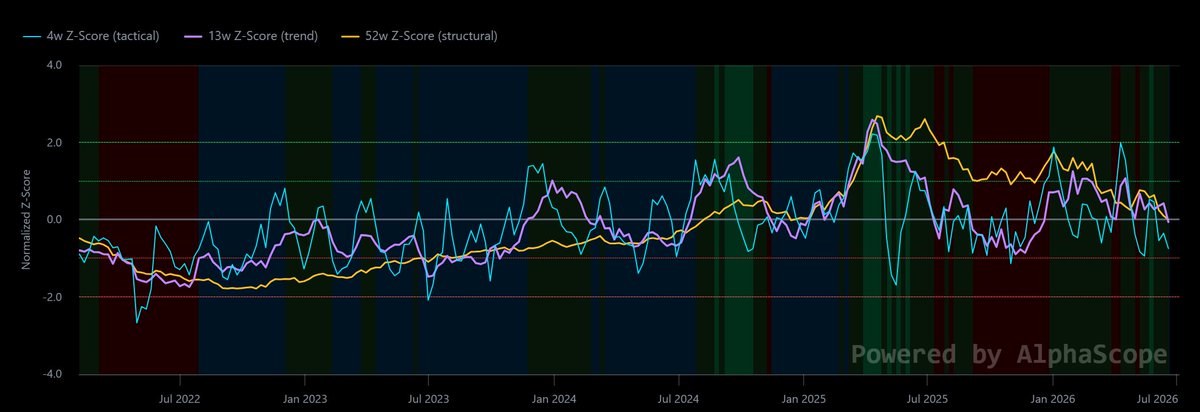
Our GLI - Momentum indicator aggregating the $40T+ liquidity matrix of the Fed Net, ECB, BOJ, and US M2 is flashing a severe macro warning sign. Over the past two weeks, all three core momentum tracks (the 4-week, 13-week, and 52-week Z-scores) have rolled over simultaneously.
Here is what a synchronized multi-horizon liquidity contraction means for the financial markets and why it changes the entire risk paradigm:
- The triple-axis breakdown: When the 4w, 13w, and 52w Z-scores compress together, it confirms that liquidity deceleration isn't just a temporary short-term hiccup. It represents a systemic cooling down across both tactical and secular monetary expansion cycles.
- Fragility of asset support levels: Global liquidity is the mechanical bid that absorbs downside volatility. When these three Z-scores collapse, that protective buffer is removed. As a result, high-beta risk assets (Crypto and Equities) become highly vulnerable to sudden, violent liquidation cascades because there is no institutional volume to catch the falling knives.
- The AlphaScope member edge: While the public is caught completely off guard trying to buy "cheap" overextended dips, AlphaScope members possess the ultimate unfair advantage. They tracked this multi-horizon rollover in real-time on our dashboard, allowing them to hedge risk, scale down leverage, protect capital, and accumulate heavy cash positions before the broader market even realized the pipes were drying up.
You cannot fight the gravity of central bank balance sheet contractions. When momentum drops across all horizons, correlations go to 1, and the crowd gets wiped out.
#GlobalLiquidity#QuantitativeAnalysis#CryptoMacro
GM!☕️
We are still sitting right inside the Fair Value zone. On paper, it looks like a stable, "safe" area for a long-term DCA.
But if we look back at historical cycle data and current on-chain dynamics, there is a major catch. Here is why this likely isn't the "bottom of the bottom" just yet:
1. Rewind to previous true capitulations (like the March 2020 COVID crash, or the LUNA and FTX collapses). The model clearly shows that generational bottoms are forged deep below the lower blue bands (+2SD undervalued). Right now, we aren't anywhere near those extreme oversold expansion levels. There is still room to bleed.
2. We are currently seeing strong selling pressure from the big players. Whales and institutional size are selling into the market, meaning we haven't seen the smart money start to heavily accumulate yet. Realistically, they aren't going to step in with size at these current levels - they'll wait for a steeper discount.
3. We haven't experienced a prolonged, grinding bottom accompanied by full market exhaustion. Historically, a new, sustainable bull market requires a period of painful sideways action where retail completely loses interest and capitulates out of sheer boredom. We haven't totally checked that box yet.
If you have zero exposure, this isn't a bad spot to slowly scale into long-term positions. But don't blow your full load here.
Play it smart, stick to a strict plan, and keep plenty of cash on the sidelines for when global liquidity and crypto-native flows finally re-align at much cleaner entries. 🫡
Cobra strategy update:
Our Cobra strategy is currently 100% cash, since it doesn't see that it's a good idea to allocate to crypto right now.
Currently the strategy is waiting for better market conditions to return.
⚠️ TRADING THE MACRO CYCLE USING DELAYED MONTHLY ECONOMIC DATA IS A GUARANTEED WAY TO INGEST SEVERE LAGGING BIAS.
By the time official government reports confirm an economic regime shift, smart money has already repositioned and front-run the entire liquidity expansion.
Our Macro Regime Positioning Matrix completely redesigns how systematic allocators track economic cycles, deploying a real-time, release-aware quantitative architecture.
Instead of waiting weeks for stale retrospective prints, our version carries the macro signal forward dynamically to capture structural growth and inflation regimes before the broader market catches on:
- Level + momentum matrix (60/40 weight): Prior models suffered from false positives because "growth bouncing off a severely depressed baseline" looked identical to genuine economic acceleration. Our updated matrix integrates absolute levels and momentum vectors simultaneously, preventing momentum traps.
- Real-time weekly proxies: To eliminate data gaps, the system synthesizes daily and weekly high-frequency proxies, including the Lewis-Mertens-Stock Weekly Economic Index (WEI) and inverted Initial Jobless Claims (ICSA), keeping the engine updated continuously.
- Shift(2) release-aware realism: Backtests that look at month-end data assume perfect information. Our engine utilizes a strict shift(2) baseline logic, precisely accounting for the fact that CPI and CFNAI data for month M-1 are completely unavailable until mid-month M.
- Transitional noise filtering: To eradicate capital erosion during choppy baseline conditions, we engineered a hard noise gate. If the score falls within a |signal| < 0.15 threshold on either axis, the system flags a Transitional Regime, freezing directional execution until clear conviction returns.
When you accurately solve for data latency and concept drift, you stop reacting to the cycle and start pricing it.
#MacroEconomics#QuantitativeAnalysis#AssetAllocation
⚠️ MOST TRADERS EXCLUSIVELY TRACK SURFACE-LEVEL ASSET PRICES WHILE THE ACTUAL SYSTEMIC DOLLAR PLUMBING SUFFERS SILENT FRICTION.
If your macro framework ignores the interbank repo market, you are completely blind to structural liquidation risks before they hit the order books.
Over the last 2-3 weeks, asset volatility has kept retail guessing, but our Private Sector Funding Stress Monitor has been executing a cold, institutional diagnostic on the core engine of the financial system: the SOFR-IORB spread.
This isn't a retail trading tool. It is a fundamental health check of institutional liquidity architecture. Here is the quantitative breakdown of what we are tracking:
- The SOFR-IORB plumbing metric: By measuring the precise cost premium private repo borrowers pay versus the Fed's administered floor (IORB), the monitor measures real-time dealer balance-sheet constraints, collateral scarcity, and structural reserve drainage.
- Lagged Z-score baseline optimization: To prevent dangerous look-ahead bias, our system maps stress through a strict 252-day rolling Z-score using a lagged baseline. This filters out expected seasonal turn-of-period noise, ensuring we only flag genuine systemic illiquidity.
- Macro regime classification: The model operates a rigid 4-state state machine (Calm/Elevated/Strained/Acute). By keeping our subscribers informed on whether the interbank plumbing is unbothered or tightening, AlphaScope members know exactly when institutional funds are being squeezed before correlations across high-beta assets go to 1.
Stop trading the noise. Start monitoring the pipes that transport the capital.
#Macro#RepoMarket#SystemicRisk