D_Quant
1.2K posts

@D_The_Quant
Economics BSc | Financial Economics MSc | Co-founder of https://t.co/iZpmhNxuBO | Algorithmic Trader | Macro/On-Chain Analyst | No hype, just data.


🚨 MACRO WARNING: The S&P 500 momentum engine is actively stalling, and the structural flush we’ve been warning about is mathematically loading. Here is exactly what the quantitative suite is screaming behind the scenes: 1️⃣ Statistical Momentum Breakdown If you look at the statistical momentum (blue and white indicator) is nowhere close to supporting a continuation of the current uptrend. The underlying buy-side velocity has completely evaporated at these levels. 2️⃣ Mean Reversion Triggered The elastic band is stretched too far. As seen in our enhanced Hurst Exponent—which tracks Trending vs. Mean Reversion regimes, it flashed a mean reversion signal just yesterday. The algorithmic snap-back is imminent. 3️⃣ Trend Confirmation Failure Looking at our proprietary classification model (the green and red indicator) represents today's live reading. Notice the lack of green confirmation. The structural uptrend is fundamentally unvalidated by the underlying order flow. 📉 The Macro Confluence & The Final Flush All of these metrics align with one undeniable historical fact: We have never seen a definitive bitcoin:native bottom without a corresponding capitulation flush in the broader stock market. The Playbook (Still playing out TO THE LETTER): Expect another month or so of choppy, wide-range consolidation, followed by one final, severe flush. This will likely send $BTC down to the low 50s alongside a noticeable, painful haircut in the stock market. Only then is the structural floor set for the next major macro uptrend. Outside of ongoing geopolitical friction, we haven't seen major macroeconomic stress flood the system yet….which is exactly why our quantitative models have made it so easy to sidestep the markdowns and perfectly avoid the chop. Do not get caught offside in this transition. Structure your portfolio for the flush.


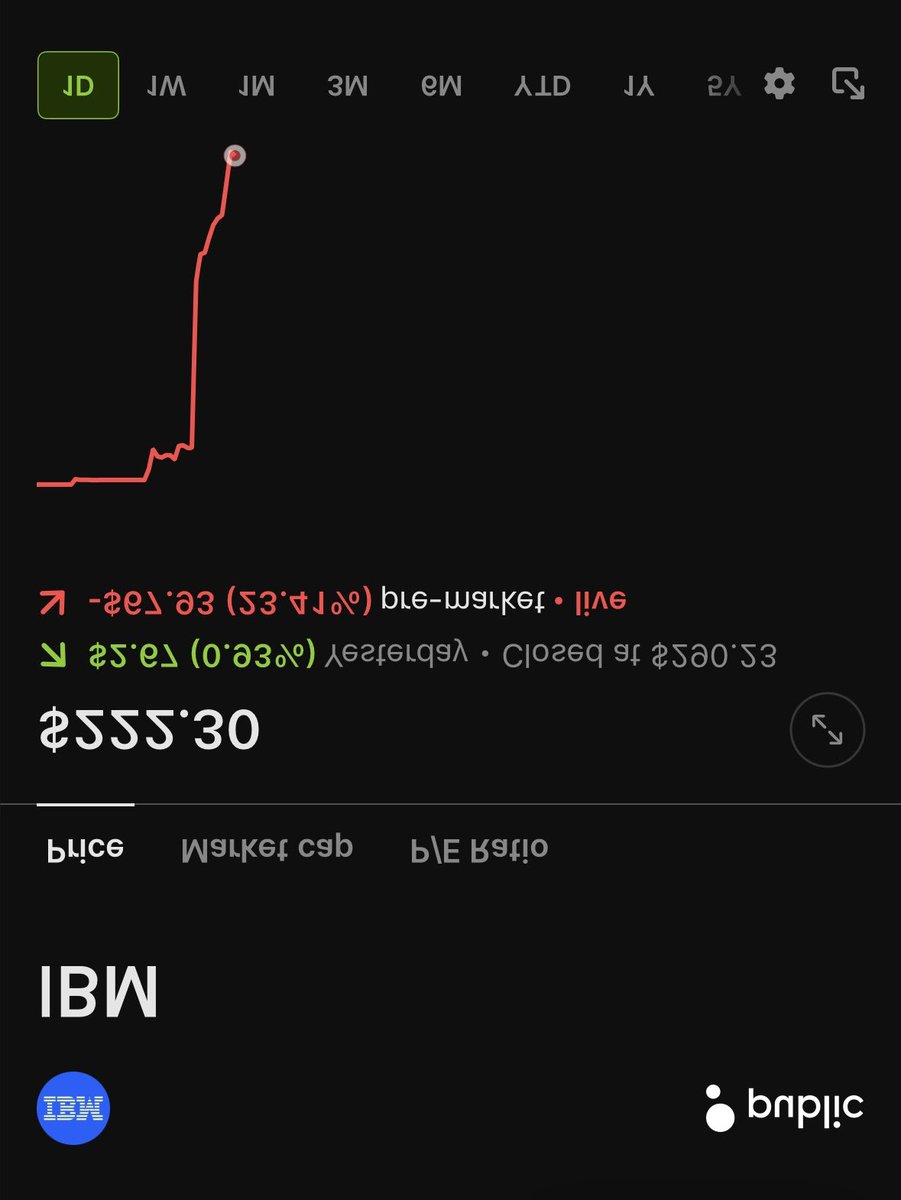
$IBM JUST REPORTED PRELIMINARY Q2 EARNINGS AND ITS DOWN 15% 🔴 IBM just said for Q2 it brought in - Revenue of $17.2 billion up 1% YoY - Software revenue up 5% - Consulting revenue flat, up 1% at constant currency - Infrastructure revenue down 7% - Gross Profit Margin: GAAP: 57.7%, down 1%; Operating (Non-GAAP): 59.4%, down 0.70% - Pre-Tax Income Margin: GAAP: 14.4%, down 0.9%; Operating (Non-GAAP): 19.2%, up 0.30% - Year to date, net cash from operating activities of $7.8 billion; free cash flow of $4.8 billion - Diluted Earnings Per Share: GAAP: $2.27, down 2%; Operating (Non-GAAP): $2.93, up 5%

🚨 MACRO WARNING: The S&P 500 momentum engine is actively stalling, and the structural flush we’ve been warning about is mathematically loading. Here is exactly what the quantitative suite is screaming behind the scenes: 1️⃣ Statistical Momentum Breakdown If you look at the statistical momentum (blue and white indicator) is nowhere close to supporting a continuation of the current uptrend. The underlying buy-side velocity has completely evaporated at these levels. 2️⃣ Mean Reversion Triggered The elastic band is stretched too far. As seen in our enhanced Hurst Exponent—which tracks Trending vs. Mean Reversion regimes, it flashed a mean reversion signal just yesterday. The algorithmic snap-back is imminent. 3️⃣ Trend Confirmation Failure Looking at our proprietary classification model (the green and red indicator) represents today's live reading. Notice the lack of green confirmation. The structural uptrend is fundamentally unvalidated by the underlying order flow. 📉 The Macro Confluence & The Final Flush All of these metrics align with one undeniable historical fact: We have never seen a definitive bitcoin:native bottom without a corresponding capitulation flush in the broader stock market. The Playbook (Still playing out TO THE LETTER): Expect another month or so of choppy, wide-range consolidation, followed by one final, severe flush. This will likely send $BTC down to the low 50s alongside a noticeable, painful haircut in the stock market. Only then is the structural floor set for the next major macro uptrend. Outside of ongoing geopolitical friction, we haven't seen major macroeconomic stress flood the system yet….which is exactly why our quantitative models have made it so easy to sidestep the markdowns and perfectly avoid the chop. Do not get caught offside in this transition. Structure your portfolio for the flush.

🚨 MACRO WARNING: The S&P 500 momentum engine is actively stalling, and the structural flush we’ve been warning about is mathematically loading. Here is exactly what the quantitative suite is screaming behind the scenes: 1️⃣ Statistical Momentum Breakdown If you look at the statistical momentum (blue and white indicator) is nowhere close to supporting a continuation of the current uptrend. The underlying buy-side velocity has completely evaporated at these levels. 2️⃣ Mean Reversion Triggered The elastic band is stretched too far. As seen in our enhanced Hurst Exponent—which tracks Trending vs. Mean Reversion regimes, it flashed a mean reversion signal just yesterday. The algorithmic snap-back is imminent. 3️⃣ Trend Confirmation Failure Looking at our proprietary classification model (the green and red indicator) represents today's live reading. Notice the lack of green confirmation. The structural uptrend is fundamentally unvalidated by the underlying order flow. 📉 The Macro Confluence & The Final Flush All of these metrics align with one undeniable historical fact: We have never seen a definitive bitcoin:native bottom without a corresponding capitulation flush in the broader stock market. The Playbook (Still playing out TO THE LETTER): Expect another month or so of choppy, wide-range consolidation, followed by one final, severe flush. This will likely send $BTC down to the low 50s alongside a noticeable, painful haircut in the stock market. Only then is the structural floor set for the next major macro uptrend. Outside of ongoing geopolitical friction, we haven't seen major macroeconomic stress flood the system yet….which is exactly why our quantitative models have made it so easy to sidestep the markdowns and perfectly avoid the chop. Do not get caught offside in this transition. Structure your portfolio for the flush.

🚨 MACRO WARNING: The S&P 500 momentum engine is actively stalling, and the structural flush we’ve been warning about is mathematically loading. Here is exactly what the quantitative suite is screaming behind the scenes: 1️⃣ Statistical Momentum Breakdown If you look at the statistical momentum (blue and white indicator) is nowhere close to supporting a continuation of the current uptrend. The underlying buy-side velocity has completely evaporated at these levels. 2️⃣ Mean Reversion Triggered The elastic band is stretched too far. As seen in our enhanced Hurst Exponent—which tracks Trending vs. Mean Reversion regimes, it flashed a mean reversion signal just yesterday. The algorithmic snap-back is imminent. 3️⃣ Trend Confirmation Failure Looking at our proprietary classification model (the green and red indicator) represents today's live reading. Notice the lack of green confirmation. The structural uptrend is fundamentally unvalidated by the underlying order flow. 📉 The Macro Confluence & The Final Flush All of these metrics align with one undeniable historical fact: We have never seen a definitive bitcoin:native bottom without a corresponding capitulation flush in the broader stock market. The Playbook (Still playing out TO THE LETTER): Expect another month or so of choppy, wide-range consolidation, followed by one final, severe flush. This will likely send $BTC down to the low 50s alongside a noticeable, painful haircut in the stock market. Only then is the structural floor set for the next major macro uptrend. Outside of ongoing geopolitical friction, we haven't seen major macroeconomic stress flood the system yet….which is exactly why our quantitative models have made it so easy to sidestep the markdowns and perfectly avoid the chop. Do not get caught offside in this transition. Structure your portfolio for the flush.

🚨 MACRO WARNING: The S&P 500 momentum engine is actively stalling, and the structural flush we’ve been warning about is mathematically loading. Here is exactly what the quantitative suite is screaming behind the scenes: 1️⃣ Statistical Momentum Breakdown If you look at the statistical momentum (blue and white indicator) is nowhere close to supporting a continuation of the current uptrend. The underlying buy-side velocity has completely evaporated at these levels. 2️⃣ Mean Reversion Triggered The elastic band is stretched too far. As seen in our enhanced Hurst Exponent—which tracks Trending vs. Mean Reversion regimes, it flashed a mean reversion signal just yesterday. The algorithmic snap-back is imminent. 3️⃣ Trend Confirmation Failure Looking at our proprietary classification model (the green and red indicator) represents today's live reading. Notice the lack of green confirmation. The structural uptrend is fundamentally unvalidated by the underlying order flow. 📉 The Macro Confluence & The Final Flush All of these metrics align with one undeniable historical fact: We have never seen a definitive bitcoin:native bottom without a corresponding capitulation flush in the broader stock market. The Playbook (Still playing out TO THE LETTER): Expect another month or so of choppy, wide-range consolidation, followed by one final, severe flush. This will likely send $BTC down to the low 50s alongside a noticeable, painful haircut in the stock market. Only then is the structural floor set for the next major macro uptrend. Outside of ongoing geopolitical friction, we haven't seen major macroeconomic stress flood the system yet….which is exactly why our quantitative models have made it so easy to sidestep the markdowns and perfectly avoid the chop. Do not get caught offside in this transition. Structure your portfolio for the flush.

🚨 MACRO WARNING: The S&P 500 momentum engine is actively stalling, and the structural flush we’ve been warning about is mathematically loading. Here is exactly what the quantitative suite is screaming behind the scenes: 1️⃣ Statistical Momentum Breakdown If you look at the statistical momentum (blue and white indicator) is nowhere close to supporting a continuation of the current uptrend. The underlying buy-side velocity has completely evaporated at these levels. 2️⃣ Mean Reversion Triggered The elastic band is stretched too far. As seen in our enhanced Hurst Exponent—which tracks Trending vs. Mean Reversion regimes, it flashed a mean reversion signal just yesterday. The algorithmic snap-back is imminent. 3️⃣ Trend Confirmation Failure Looking at our proprietary classification model (the green and red indicator) represents today's live reading. Notice the lack of green confirmation. The structural uptrend is fundamentally unvalidated by the underlying order flow. 📉 The Macro Confluence & The Final Flush All of these metrics align with one undeniable historical fact: We have never seen a definitive bitcoin:native bottom without a corresponding capitulation flush in the broader stock market. The Playbook (Still playing out TO THE LETTER): Expect another month or so of choppy, wide-range consolidation, followed by one final, severe flush. This will likely send $BTC down to the low 50s alongside a noticeable, painful haircut in the stock market. Only then is the structural floor set for the next major macro uptrend. Outside of ongoing geopolitical friction, we haven't seen major macroeconomic stress flood the system yet….which is exactly why our quantitative models have made it so easy to sidestep the markdowns and perfectly avoid the chop. Do not get caught offside in this transition. Structure your portfolio for the flush.

🚨 MACRO WARNING: The S&P 500 momentum engine is actively stalling, and the structural flush we’ve been warning about is mathematically loading. Here is exactly what the quantitative suite is screaming behind the scenes: 1️⃣ Statistical Momentum Breakdown If you look at the statistical momentum (blue and white indicator) is nowhere close to supporting a continuation of the current uptrend. The underlying buy-side velocity has completely evaporated at these levels. 2️⃣ Mean Reversion Triggered The elastic band is stretched too far. As seen in our enhanced Hurst Exponent—which tracks Trending vs. Mean Reversion regimes, it flashed a mean reversion signal just yesterday. The algorithmic snap-back is imminent. 3️⃣ Trend Confirmation Failure Looking at our proprietary classification model (the green and red indicator) represents today's live reading. Notice the lack of green confirmation. The structural uptrend is fundamentally unvalidated by the underlying order flow. 📉 The Macro Confluence & The Final Flush All of these metrics align with one undeniable historical fact: We have never seen a definitive bitcoin:native bottom without a corresponding capitulation flush in the broader stock market. The Playbook (Still playing out TO THE LETTER): Expect another month or so of choppy, wide-range consolidation, followed by one final, severe flush. This will likely send $BTC down to the low 50s alongside a noticeable, painful haircut in the stock market. Only then is the structural floor set for the next major macro uptrend. Outside of ongoing geopolitical friction, we haven't seen major macroeconomic stress flood the system yet….which is exactly why our quantitative models have made it so easy to sidestep the markdowns and perfectly avoid the chop. Do not get caught offside in this transition. Structure your portfolio for the flush.

🚨 MACRO WARNING: The S&P 500 momentum engine is actively stalling, and the structural flush we’ve been warning about is mathematically loading. Here is exactly what the quantitative suite is screaming behind the scenes: 1️⃣ Statistical Momentum Breakdown If you look at the statistical momentum (blue and white indicator) is nowhere close to supporting a continuation of the current uptrend. The underlying buy-side velocity has completely evaporated at these levels. 2️⃣ Mean Reversion Triggered The elastic band is stretched too far. As seen in our enhanced Hurst Exponent—which tracks Trending vs. Mean Reversion regimes, it flashed a mean reversion signal just yesterday. The algorithmic snap-back is imminent. 3️⃣ Trend Confirmation Failure Looking at our proprietary classification model (the green and red indicator) represents today's live reading. Notice the lack of green confirmation. The structural uptrend is fundamentally unvalidated by the underlying order flow. 📉 The Macro Confluence & The Final Flush All of these metrics align with one undeniable historical fact: We have never seen a definitive bitcoin:native bottom without a corresponding capitulation flush in the broader stock market. The Playbook (Still playing out TO THE LETTER): Expect another month or so of choppy, wide-range consolidation, followed by one final, severe flush. This will likely send $BTC down to the low 50s alongside a noticeable, painful haircut in the stock market. Only then is the structural floor set for the next major macro uptrend. Outside of ongoing geopolitical friction, we haven't seen major macroeconomic stress flood the system yet….which is exactly why our quantitative models have made it so easy to sidestep the markdowns and perfectly avoid the chop. Do not get caught offside in this transition. Structure your portfolio for the flush.


🚨 MACRO WARNING: The S&P 500 momentum engine is actively stalling, and the structural flush we’ve been warning about is mathematically loading. Here is exactly what the quantitative suite is screaming behind the scenes: 1️⃣ Statistical Momentum Breakdown If you look at the statistical momentum (blue and white indicator) is nowhere close to supporting a continuation of the current uptrend. The underlying buy-side velocity has completely evaporated at these levels. 2️⃣ Mean Reversion Triggered The elastic band is stretched too far. As seen in our enhanced Hurst Exponent—which tracks Trending vs. Mean Reversion regimes, it flashed a mean reversion signal just yesterday. The algorithmic snap-back is imminent. 3️⃣ Trend Confirmation Failure Looking at our proprietary classification model (the green and red indicator) represents today's live reading. Notice the lack of green confirmation. The structural uptrend is fundamentally unvalidated by the underlying order flow. 📉 The Macro Confluence & The Final Flush All of these metrics align with one undeniable historical fact: We have never seen a definitive bitcoin:native bottom without a corresponding capitulation flush in the broader stock market. The Playbook (Still playing out TO THE LETTER): Expect another month or so of choppy, wide-range consolidation, followed by one final, severe flush. This will likely send $BTC down to the low 50s alongside a noticeable, painful haircut in the stock market. Only then is the structural floor set for the next major macro uptrend. Outside of ongoing geopolitical friction, we haven't seen major macroeconomic stress flood the system yet….which is exactly why our quantitative models have made it so easy to sidestep the markdowns and perfectly avoid the chop. Do not get caught offside in this transition. Structure your portfolio for the flush.

🚨 MACRO WARNING: The S&P 500 momentum engine is actively stalling, and the structural flush we’ve been warning about is mathematically loading. Here is exactly what the quantitative suite is screaming behind the scenes: 1️⃣ Statistical Momentum Breakdown If you look at the statistical momentum (blue and white indicator) is nowhere close to supporting a continuation of the current uptrend. The underlying buy-side velocity has completely evaporated at these levels. 2️⃣ Mean Reversion Triggered The elastic band is stretched too far. As seen in our enhanced Hurst Exponent—which tracks Trending vs. Mean Reversion regimes, it flashed a mean reversion signal just yesterday. The algorithmic snap-back is imminent. 3️⃣ Trend Confirmation Failure Looking at our proprietary classification model (the green and red indicator) represents today's live reading. Notice the lack of green confirmation. The structural uptrend is fundamentally unvalidated by the underlying order flow. 📉 The Macro Confluence & The Final Flush All of these metrics align with one undeniable historical fact: We have never seen a definitive bitcoin:native bottom without a corresponding capitulation flush in the broader stock market. The Playbook (Still playing out TO THE LETTER): Expect another month or so of choppy, wide-range consolidation, followed by one final, severe flush. This will likely send $BTC down to the low 50s alongside a noticeable, painful haircut in the stock market. Only then is the structural floor set for the next major macro uptrend. Outside of ongoing geopolitical friction, we haven't seen major macroeconomic stress flood the system yet….which is exactly why our quantitative models have made it so easy to sidestep the markdowns and perfectly avoid the chop. Do not get caught offside in this transition. Structure your portfolio for the flush.


📊 MARKET INTEL: Bitcoin’s momentum is coiled like a spring, but the institutional validation signal has not officially flashed. We are tracking a “textbook” divergence between early-stage velocity and trend confirmation. Here is exactly what the data is telling us behind the scenes: 1️⃣ Statistical Momentum — Rate of Change (RoC) Expansion Looking at the first metric (blue/white indicator), we are printing a massive expansion in statistical momentum. The sheer velocity of this structural bounce confirms that heavy buying interest is triggering at these valuation floors. The engine is building significant underlying pressure. 2️⃣ Trend Classification — Proprietary Momentum Engine Despite the aggressive RoC bounce of the statistical momentum indicator, one of my most sophisticated, proprietary trend classification models (the green/red engine) remains pinned just below the critical threshold. It has not flipped positive yet. What this means for execution: While on-chain indicators show deep value and signs of macro reversal, the trend cannot mathematically be classified as a sustainable, high-conviction markup phase just yet. Thats why strategically DCAing in high value zones is still in play and the crypto part of the portfolio still remains in CASH The Macro Playbook: Expect this structural consolidation to grind out for at least another month, likely carving out a wider range formation. This horizontal price action aligns perfectly with macro capital shifts, as gold signals readiness for its own breakout. Our blueprint has been spot-on up to this point. No guessing, no emotional bias—just execution based on pure quantitative thresholds. Standing by.

📊 MARKET INTEL: Bitcoin’s momentum is coiled like a spring, but the institutional validation signal has not officially flashed. We are tracking a “textbook” divergence between early-stage velocity and trend confirmation. Here is exactly what the data is telling us behind the scenes: 1️⃣ Statistical Momentum — Rate of Change (RoC) Expansion Looking at the first metric (blue/white indicator), we are printing a massive expansion in statistical momentum. The sheer velocity of this structural bounce confirms that heavy buying interest is triggering at these valuation floors. The engine is building significant underlying pressure. 2️⃣ Trend Classification — Proprietary Momentum Engine Despite the aggressive RoC bounce of the statistical momentum indicator, one of my most sophisticated, proprietary trend classification models (the green/red engine) remains pinned just below the critical threshold. It has not flipped positive yet. What this means for execution: While on-chain indicators show deep value and signs of macro reversal, the trend cannot mathematically be classified as a sustainable, high-conviction markup phase just yet. Thats why strategically DCAing in high value zones is still in play and the crypto part of the portfolio still remains in CASH The Macro Playbook: Expect this structural consolidation to grind out for at least another month, likely carving out a wider range formation. This horizontal price action aligns perfectly with macro capital shifts, as gold signals readiness for its own breakout. Our blueprint has been spot-on up to this point. No guessing, no emotional bias—just execution based on pure quantitative thresholds. Standing by.

📊 MARKET INTEL: Bitcoin’s momentum is coiled like a spring, but the institutional validation signal has not officially flashed. We are tracking a “textbook” divergence between early-stage velocity and trend confirmation. Here is exactly what the data is telling us behind the scenes: 1️⃣ Statistical Momentum — Rate of Change (RoC) Expansion Looking at the first metric (blue/white indicator), we are printing a massive expansion in statistical momentum. The sheer velocity of this structural bounce confirms that heavy buying interest is triggering at these valuation floors. The engine is building significant underlying pressure. 2️⃣ Trend Classification — Proprietary Momentum Engine Despite the aggressive RoC bounce of the statistical momentum indicator, one of my most sophisticated, proprietary trend classification models (the green/red engine) remains pinned just below the critical threshold. It has not flipped positive yet. What this means for execution: While on-chain indicators show deep value and signs of macro reversal, the trend cannot mathematically be classified as a sustainable, high-conviction markup phase just yet. Thats why strategically DCAing in high value zones is still in play and the crypto part of the portfolio still remains in CASH The Macro Playbook: Expect this structural consolidation to grind out for at least another month, likely carving out a wider range formation. This horizontal price action aligns perfectly with macro capital shifts, as gold signals readiness for its own breakout. Our blueprint has been spot-on up to this point. No guessing, no emotional bias—just execution based on pure quantitative thresholds. Standing by.


📊 MARKET INTEL: Bitcoin’s momentum is coiled like a spring, but the institutional validation signal has not officially flashed. We are tracking a “textbook” divergence between early-stage velocity and trend confirmation. Here is exactly what the data is telling us behind the scenes: 1️⃣ Statistical Momentum — Rate of Change (RoC) Expansion Looking at the first metric (blue/white indicator), we are printing a massive expansion in statistical momentum. The sheer velocity of this structural bounce confirms that heavy buying interest is triggering at these valuation floors. The engine is building significant underlying pressure. 2️⃣ Trend Classification — Proprietary Momentum Engine Despite the aggressive RoC bounce of the statistical momentum indicator, one of my most sophisticated, proprietary trend classification models (the green/red engine) remains pinned just below the critical threshold. It has not flipped positive yet. What this means for execution: While on-chain indicators show deep value and signs of macro reversal, the trend cannot mathematically be classified as a sustainable, high-conviction markup phase just yet. Thats why strategically DCAing in high value zones is still in play and the crypto part of the portfolio still remains in CASH The Macro Playbook: Expect this structural consolidation to grind out for at least another month, likely carving out a wider range formation. This horizontal price action aligns perfectly with macro capital shifts, as gold signals readiness for its own breakout. Our blueprint has been spot-on up to this point. No guessing, no emotional bias—just execution based on pure quantitative thresholds. Standing by.

🚨 ON-CHAIN UPDATE: The apex predators are officially backing up the truck. The structural accumulation phase is undeniably here🐋 Here is exactly what the smart money is doing behind the scenes: 1️⃣ Long-Term Holder Net Position Change (30D) — Heavy Accumulation For over a month now, the Long-Term Holders, the entities responsible for the actual baseline growth and stability of the network have been heavily and consistently accumulating. What this means: The most knowledgeable participants in the space are not waiting for lower prices. They are actively stepping in and absorbing the available spot supply at these levels, creating a massive supply shock. 2️⃣ The Confluence Setup — Order Flow Alignment This is not an isolated metric acting on its own. This aggressive accumulation signal is explicitly backed up by multiple other quantitative metrics across our suite, particularly the underlying order flow. When on-chain value flow and LTH accumulation align this perfectly, it mathematically signals that the structural floor is being heavily defended by deep pockets. Do not try to navigate a macro regime shift without tracking the smart money.

As for Bitcoin, it too may be in an accumulation zone (in my view). At $60k it’s getting ever closer to its power law support line.