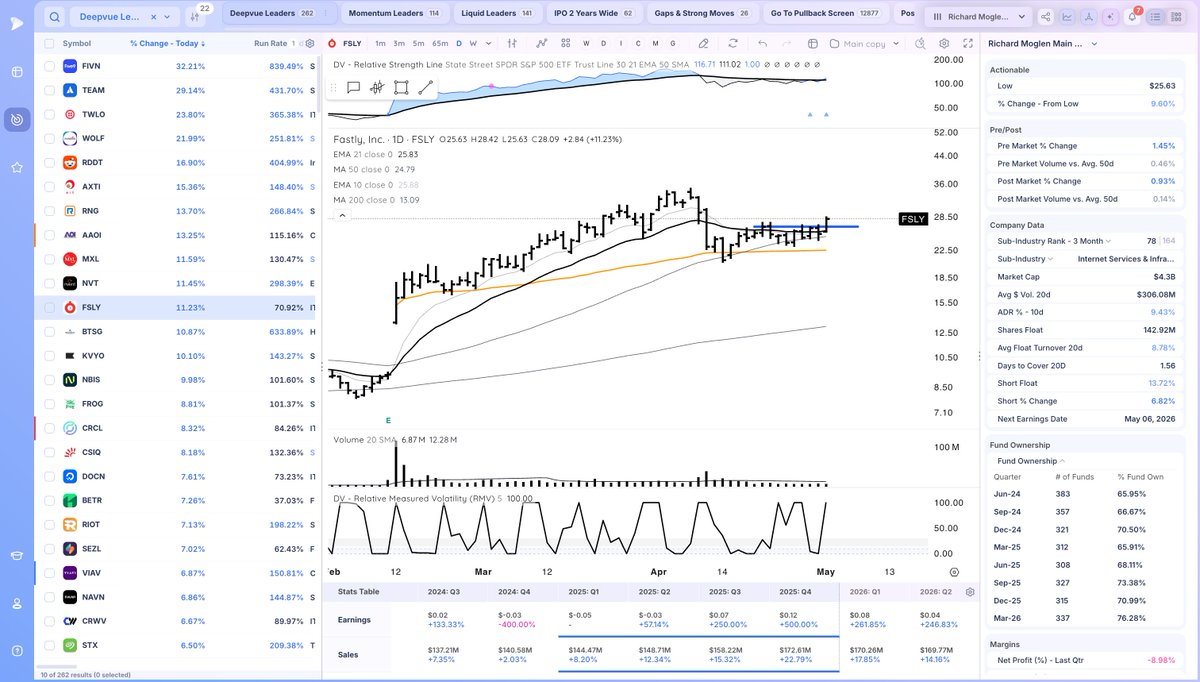
@RichardMoglen Is there any button to switch to chart view or detail view, it is ugly to drag the chart to left every time.
English
Security and Performance
692 posts
@amitxsaroha
Database Developer


DESK NOTE - Gulf Energy Pain Map: Above-Ground Chokepoints in the Iran Conflict atlaspeakresearch.com/report/c2d6d6 Bottom Line: The highest systemic exposures cluster around Ras Laffan and the North Field; Abqaiq; Ras Tanura and Juaymah; the East-West/Yanbu bypass; the Habshan-Fujairah chain; Iraq’s Basra export complex; and Kuwait’s southern refining and LNG belt. Secondary but still meaningful exposures include Das Island, Ruwais, Shah, Oman LNG, Duqm, Mina al-Fahal, Bahrain’s Sitra/Hidd system, Leviathan, Tamar, Idku, Damietta, and SUMED. The common feature is not simply size. It is above-ground concentration of processing, storage, loading, and transport optionality. Disabling those nodes inflicts faster and deeper economic pain than damaging a similarly valuable hydrocarbon resource that still remains underground. The central conclusion is that Iran does not need to destroy the region’s largest reservoirs to impose severe economic pain. It needs repeated disruption of a relatively short list of above-ground system nodes that compress very large shares of production, processing, export, and bypass capacity into a small number of industrial sites. The attacks on Ras Laffan and Kuwait’s southern refineries show that this logic has already moved from theory to practice. If additional sustained damage extends into Saudi processing, Saudi and UAE bypass infrastructure, or Iraq’s Basra export system, the shock would move from severe commodity volatility into a genuine global stagflationary energy crisis.

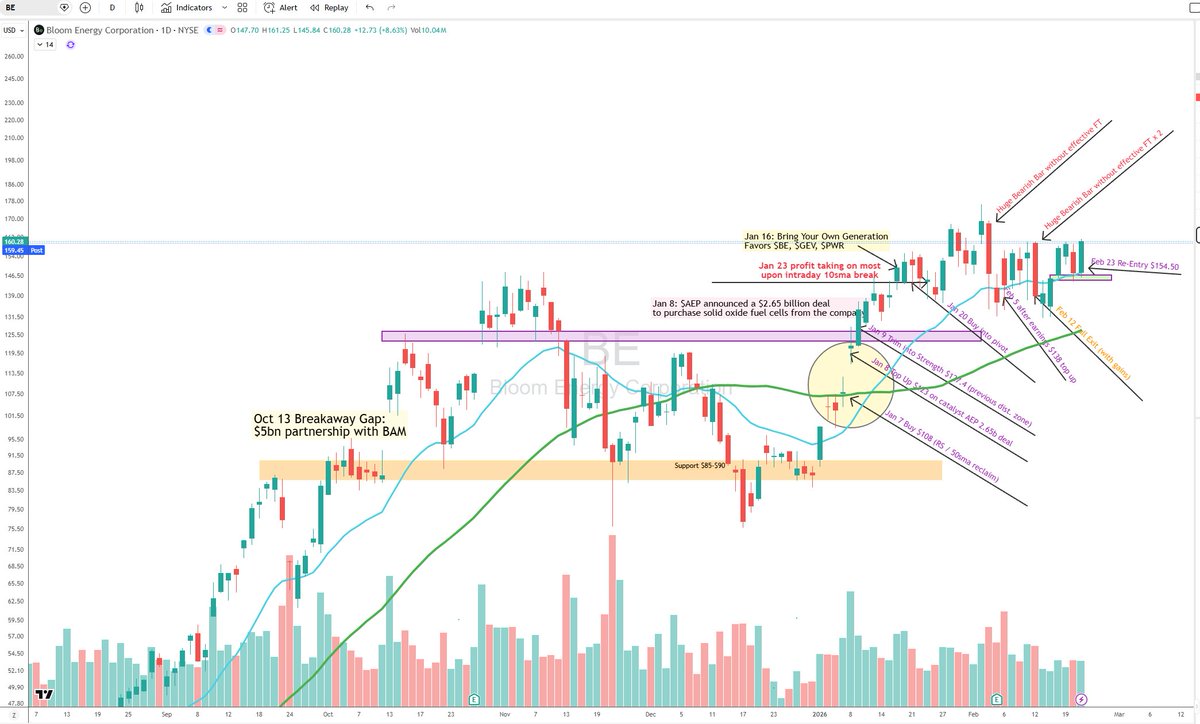
$BE (Re-Entry) FWIW, I am back onto $BE with a 4% starter. Context: I did a full exit on Feb 12 (with good profits), didn't like the wide and loose price action, moreover other opportunities were working smooth and well. Today's re-entry is a little bit higher than my exit price, but with higher certainty (me feel). It reclaimed 21ema with a gap, retested it and starting this week with a bullish bar. The price seems refusing to break down further despite the two large bearish kill candles recently. Will reassess if price lost 21ema again.


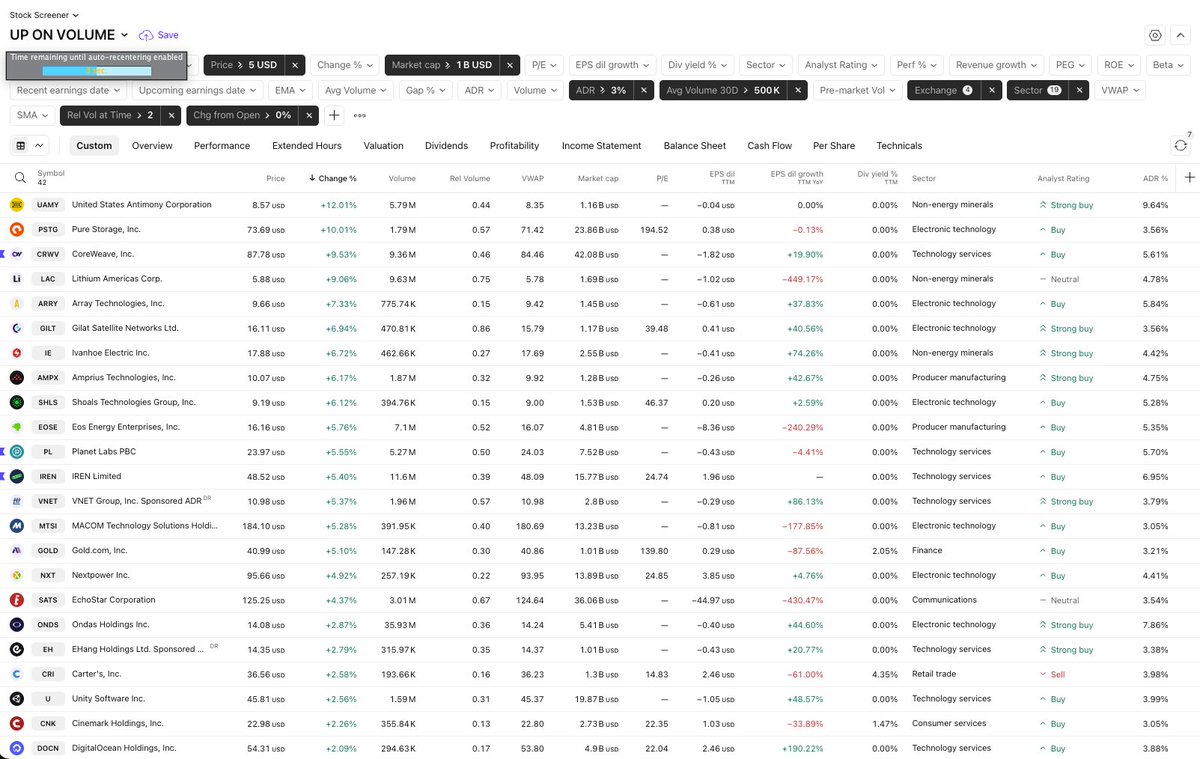
$SNDK $MA $AFRM $SOFI $V $PGY $JPM $MU $TSLA $COF $UPST $PYPL Lets get ready for tomorrow with this, I realized I was missing the best movers of the day because my scanners are broken. I just finalized my "Up on Volume" screener for the market open. If a stock isn't hitting these scanners by 9:45 AM, I’m not interested. The Setup: Morning Momentum ⚡️ Rel Vol at Time > 2.0: Compares current volume to the historical morning average for this exact time, not the quiet midday lull. Change from Open > 0%: Confirms the stock is trending higher from the start and isn't a "gap and trap" sell-off. ADR (20) > 3%: Ensures the stock has enough daily range/volatility to provide a tradeable move. Avg Vol (30D) > 500K: Guarantees institutional-grade liquidity for clean entries and exits with low slippage. Price > $5 / Market Cap > $1B: Automatically filters out "junk" penny stocks and focuses on quality mid-to-large caps. Simple. Clean. Effective.


This will mark my 8th year of Black Friday using Tradingview. Here are 8 FREE public scripts I highly recommend exploring to refine your workflow, templates, or layouts. They’re listed alphabetically by script name: 1. **ADR% - Average Daily Range %** - By @zerokapital tradingview.com/v/ss2QgCWi/ Use this to study the historical ADR% of securities and analyze how momentum stocks develop and build their volatility patterns. 2. **ATR% Multiple from 50-MA** - Credits to @DumbleDax tradingview.com/v/oimVgV7e/ My favorite tool for profit-taking or extension signals in setups. It’s also helpful for index analysis to gauge when to scale back on risk exposure. 3. **EPS & Sales** - By @DumbleDax tradingview.com/v/WiaFmLGR/ Arguably the best EPS & Sales script available. It integrates earnings, sales, beats, and guidance into your charts via table format or below price template, as seen in my trading ideas and stock update. 4. **Financials on Chart** - By @tradingview tradingview.com/v/Lbxl9OqZ/ A fantastic on-chart display of up to 9 fundamentals (Qtr/Yr) of your choice from over 100 options, including PEG, Earnings Yield, Price to Free Cash Flow Ratio, and ROIC%. This is great for your long-term investment overview without referencing to another 3rd party website for fundamental data. 5. **Industry Group Strength** - By @amphtrading tradingview.com/v/5NsvcOVp/ This indicator helps you pinpoint the best-performing stocks within specific industry groups. My default template lists the top 5 RS stocks from the same industry as the stock I’m analyzing. @amphtrading also offers 41+ free scripts, making him one of the most generous contributors to our TradingView community. 6. **Range Tightening Indicator** - By @Ollie_AllCaps tradingview.com/script/yaIeno7… A price-tightening indicator using a lookback period. It’s also useful for identifying the "rate of change" of potential bottoms or tops, as highlighted by Stanley Druckenmiller in his podcast with Nicolai Tangen. 7. **Simple Volume with Pocket Pivots** - By @finallynitin tradingview.com/v/JkB0iCFp/ The most versatile volume script, in my opinion, offering extensive customization for color coding, dollar volume, RVOL, and more. 8. **Swing Data** - Credits to @DumbleDax tradingview.com/v/uloAa2EI/ This table consolidates essential data for swing traders in a simple format, providing everything you need to improve trading execution & efficiency. If you found this post helpful and valuable, consider retweeting🔁to spread the words to support their efforts and encourage future updates and enhancements. I hope these scripts will prove beneficial on your trading journey.


COREWEAVE AI Hedge Fund Situational Awareness loaded up on CoreWeave. So did Paul Tudor Jones, Citadel and DE Shaw. CoreWeave had a final unlock last week. Every unlock they have the stock hits a local low. I expect the same here. The heightened volume and RSI suggests an intermediate low is coming soon. At a P/S of 5x with strong revenue growth, it's hard to see how this isn't up significantly in 12 months. Check out the attached charts. $CRWV $NVDA h/t @nic_carter