

Dr. AryalNR
720 posts
Dr. AryalNR
@aryalNR
DataScience | Biostatistics l PhD DataAnalytics @ UniMelbourne l HealthAnalytics @ MacquarieUni.
Katılım Nisan 2011
537 Takip Edilen138 Takipçiler

Twitter is cool.
But it’s 10x better when you connect with people who like playing with data.
If you’re into data science, math or statistics, say hi.
English

Dr. AryalNR retweetledi


Dr. AryalNR retweetledi

Drug-drug interactions (DDI) can be harmful, but care should be taken when implementing DDI alerts with electronic medication management systems so as not to introduce alert fatigue. New research from A/Prof Ling Li @lli_sydney @JWestbrook91 Mel Baysari
link.springer.com/article/10.100…
English
Dr. AryalNR retweetledi

Pleased to research with EMCRs: No relationship between socioeconomic status, education level + development and progression of diabetic retinopathy in type 2 diabetes: a FIELD trial substudy - Rao - 2023 - Internal Medicine Journal - Wiley Online Library onlinelibrary.wiley.com/doi/10.1111/im…
English
Congratulations Magda Raban on your promotion to Associate Professor, reflecting your leadership in research on #medicationsafety and electronic decision support to improve healthcare for all.
researchers.mq.edu.au/en/persons/mag…

English
Dr. AryalNR retweetledi

Are you and your co-authors editing the abstract of your paper again and again before submitting to get it just perfect?
👇 Use this template instead and save yourself hoursss!
A thread. 🧵
English
Dr. AryalNR retweetledi
The Ladder of Causation
This is a fundamental idea that everybody who cares about data needs to know about.
1. The Ladder of Causation has three levels.
1. Association. This involves the prediction of outcomes as a passive observer of a system.
2. Intervention. This involves the prediction of the consequences of taking actions to alter the behavior of a system.
3. Counterfactuals. This involves prediction of the consequences of taking actions to alter the behavior of a system had circumstances been different.
2. The levels of causation are defined by the kinds of data to which we have access as experimenters.
Imagine a machine that can spit out data. You can observe what comes out of the machine and analyze the information, but you can't touch the machine. This is the level of Association. It is the level of most statistical analyses and AI algorithms.
Now imagine that you are allowed to touch the machine. You can set it to generate specific datasets that you would like in the future. This is the level of Intervention. It is the kind of data that we get out of standard scientific experiments where we fully control the environment.
The final level of the ladder of causation is our own imaginations. It is the ability to imagine the machine as it used to be, and to imagine what we would have gotten from it had we pushed different buttons. We have to use our imaginations because we can never directly observe what would have happened in the past had we done things differently. This is the level of Counterfactuals.
It is the hardest kind of science to do because we can't do experiments to answer the questions that we really want to answer.
3. The counterfactual imagination is central to our science, our morality and even our storytelling.
The counterfactual level is the most conceptually difficult level because we can never get counterfactual data even in theory. It is also the most fascinating level.
It is the level of thought experiments like the one that led Einstein to invent the theory of relativity. He imagined himself riding along a light beam and took that idea to its logical conclusion.
Most of the laws of physics are counterfactual laws. They tell us what will happen in all situations including worlds with histories that are different from our own. This is one of the reasons that physics is such a powerful science.
The counterfactual level is also the level of our moral imaginations. It is core to our ability to reason morally that we can imagine what would have happened had we or others acted differently.
The ability to consider counterfactuals is central to our ability to read and write stories.
Arguably, it is the ability to understand counterfactuals that sets human beings apart from other animals.
There are many more deep ideas here which I will explore in future threads.
This is post 004. It is part of a series of posts about the new science of causal inference. They are based on the content of the Book of Why by Judea Pearl with lots of commentary from me.
Follow me (@kareem_carr) so you don't miss out on the next post.
Please show support by liking and retweeting the thread.

English
Dr. AryalNR retweetledi
Dr. AryalNR retweetledi
Every Data Scientist needs to know these ideas.
They will blow your mind.
1. Correlation vs Causation
P(A | B) is the probability of A given B. It is the probability that we will observe A given that we have already observed B.
P(A | do(B)) is the probability of A given do(B). It is the probability that we will observe A given that we have intervened to cause B to happen.
In this context, an intervention simply means to take an action of some kind. Therefore do(B) means to take an action which causes B to happen.
The expressions P(A | B) and P(A | do(B)) might seem very similar but they represent very different situations.
2. We can only learn P(A|B) from the data alone.
Bob has an extremely accurate weather app and is always very good about bringing his umbrella when it rains. We observe Bob over several years and we find that whenever it rains, Bob always has his umbrella and he never brings his umbrellas on days when it doesn't rain.
In the language of probability, we say P(Umbrella | Rain) = 1 and P(Rain | Umbrella) = 1 as well.
What we can learn from this data alone is how to predict whether it rains with a 100% accuracy by checking whether Bob has an umbrella. We can also learn to predict with 100% accuracy whether Bob has an umbrella by checking if it's going to rain.
What we cannot learn is what will happen if we give Bob an umbrella on a random day of our choosing. The answer to this question is P(Rain | do(Umbrella) ) and it's unknowable from the data alone.
We need prior knowledge about how the world works to properly interpret the data we collected. We need to know that rain has an effect on Bob's behavior, but Bob's behavior has no effect on the rain.
Information about the effects of interventions are simply not available in raw data unless it is collected by controlled experimental manipulation.
3. Scientific Experiments work because they produce a very special kind of data.
You may have heard of what many people call a scientific experiment. Take a collection of objects, animals or people. Randomly split that collection into a control group and a treatment group. Apply your intervention to the treatment group while leaving the control group alone. If you observe any differences between the treatment group and the control group, it is logical to attribute these differences to the treatment. You can therefore say the differences were caused by the treatment.
In statistics, the procedure I just described is called a Randomized Controlled Trial. It is a procedure for generating a specific kind of data where:
P(Difference | Treatment) = P(Difference | do(Treatment) )
This is why traditional science experiments work. They are designed to capture causal information. This is not the case for vast majority of data that we collect in society.
Without human guidance or access to real world knowledge, statistical algorithms and artificial intelligences can only learn P(A | B) from the raw data. This is a fundamental mathematical limitation on the use of data alone.
That's it for now. This post is part of a series of posts about the concept of causal inference. They are based on the content of the Book of Why by Judea Pearl with lots of commentary from me.
Follow me (@kareem_carr) so you don't miss out on the next post.
Please show support by liking and retweeting the thread.

English
Dr. AryalNR retweetledi
For @WHO #WorldSepsisDay, we are so excited to share our #PhD candidate @k_ackermann1's fantastic animation on #sepsis for #VisualiseYourThesis. Watch and learn about #sepsis and research.
#VYT2023 #WSD @Macquarie_Uni
protect-au.mimecast.com/s/iliQCjZ12Rfr…

English
Dr. AryalNR retweetledi
For #WorldSepsisDay, we stand #togetheragainstsepsis at the Australian Institute of Health Innovation with a motivated team researching tools for early detection. Here's a link to A/Prof Ling Li's @lli_sydney research: researchers.mq.edu.au/en/persons/lin…

English
Dr. AryalNR retweetledi
This #WorldSepsisDay we congratulate PhD student Khalia Ackermann @k_ackermann1, who came second-runner up in the @Macquarie_Uni 3MT finals with her presentation on #sepsis. Watch Khalia here - only three minutes!
@lli_sydney @JWestbrook91 @aryalNR
vimeo.com/856590884?share
English

@mail2neeti Congratulations Neeti! Feel free to contact me if you require assistance with biostatistics.
English

Pleased to share that I have been nominated as member of Institutional Review Commitee of Institute of Medicine, Tribhuvan University. I will be working together with leading experts in medicine and public health to review academic research proposal to ensure they are ethical
English
Dr. AryalNR retweetledi

Moving from bookdown to Quarto (and the corresponding GitHub Actions changes) {r-bloggers.com/?p=343118} #rstats #DataScience
English
Dr. AryalNR retweetledi

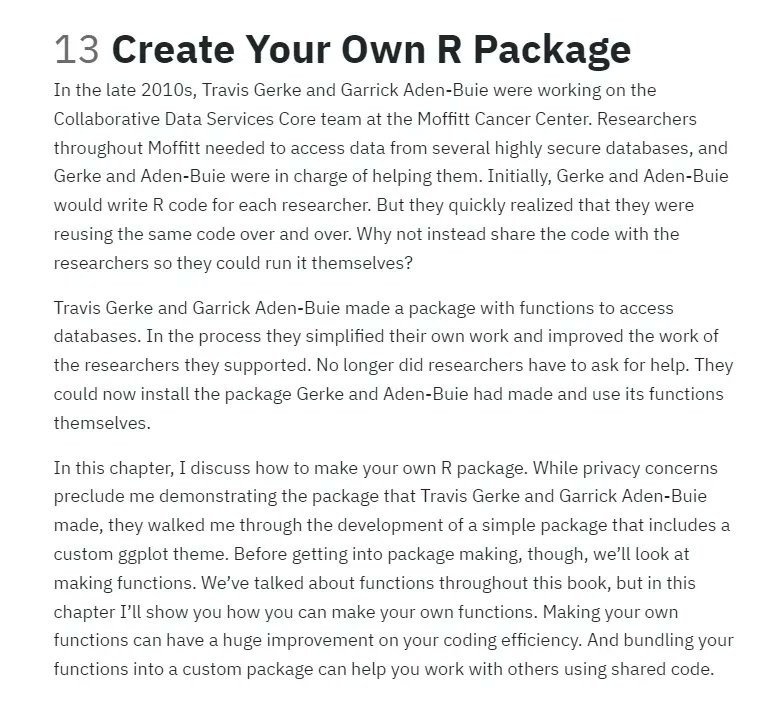
Do you find yourself reusing the same R code over and over? Make a custom package for it to be more efficient.
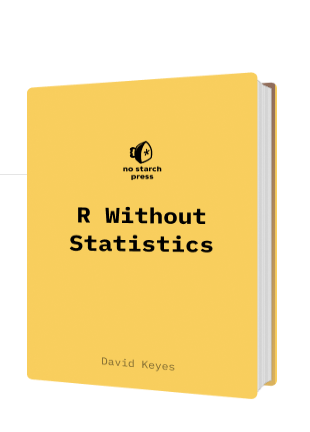
In chapter 13 of R Without Statistics, I discuss how to make your own R package. Let me know what you think!
rfor.us/packages
#rstats
English
Dr. AryalNR retweetledi
No matter how slow you go, you are still lapping everybody who isn’t consistent … 🐢
English
