P.C.

418 posts

P.C.

P.C.

@canezinpablo

Katılım Temmuz 2009
1.4K Takip Edilen122 Takipçiler
P.C. retweetledi
COATUE
COATUE@coatuemgmt·
More on Coatue's view of agents, the token economy, and AI infrastructure in our latest Public Markets Update: coatue.com/blog/perspecti…
English
2
6
76
37.8K
Helium🎈
Helium🎈@helium·
Notice something different on Helium World? 500 Expansion Zones just launched, where coverage is needed most by carriers... ...And where they’re more likely to offload subscribers if, say, a people-built network lights it up. 👀 🌎 world.helium.com
Helium🎈 tweet media
English
17
19
119
18.4K
P.C.
P.C.@canezinpablo·
@helium Sao Paulo, Brazil
Português
0
0
2
55
Helium🎈
Helium🎈@helium·
Drop your city below 🌎 We’re mapping where our community wants coverage next. Every reply gets read. Your voice will shape where the @Helium community builds.
English
63
9
89
4.9K
P.C. retweetledi
Aakash Gupta
Aakash Gupta@aakashgupta·
Google and Microsoft just co-authored the spec that turns every website into an API for AI agents. The second-order effects here are massive. Right now, browser agents work by taking screenshots, parsing the DOM, and guessing which buttons to click. It works about as well as you’d expect. Fragile, expensive, slow. WebMCP replaces all of that with a single browser API: navigator.modelContext. Websites register structured tools directly in client-side JavaScript. The agent reads a menu of available actions, calls them, gets structured data back. No scraping. No backend MCP server in Python or Node. The tools run inside the browser tab and share the user’s existing auth session. Early benchmarks show ~67% reduction in computational overhead compared to visual agent-browser interactions. Task accuracy around 98%. The second-order effect is where this gets wild. Today, when a browser agent visits two competing airline sites, it’s guessing at both interfaces equally. Once WebMCP adoption spreads, the site that exposes structured tools gives the agent a clean, reliable path to complete the task. The site that doesn’t forces the agent to fumble through the UI. Agents will prefer the cheaper path. Every time. This means “Agent Experience Optimization” becomes a real discipline. Tool naming, schema design, description quality. Sound familiar? It’s the same shift that happened when meta descriptions and structured data became optimization surfaces for search engines. Except this time, the traffic source isn’t Google’s crawler. It’s every AI agent on the internet. Bots already make up 51% of web traffic. Google just gave them a front door.
Chrome for Developers@ChromiumDev

WebMCP is available for early preview → goo.gle/4rML2O9 WebMCP aims to provide a standard way for exposing structured tools, ensuring AI agents can perform actions on your side with increased speed, reliability, and precision.

English
127
766
7.3K
1.2M
P.C. retweetledi
SightBringer
SightBringer@_The_Prophet__·
⚡️This is the record of a species that discovered a cheat code and has no intention of ever giving it up. Inflation is not an accident. It is not a flaw. It is not mismanagement. It is a civilizational operating principle. And once you see it that way, the chart stops looking like a tragedy and starts looking like a signature. 1. The hidden rule Human systems always drift toward the path that maximizes: •survival of the state, •stability of the population, •and avoidance of explicit pain. Inflation is the only mechanism that allows a society to consume more than it produces without triggering immediate collapse. Everything else has a hard wall: •Taxes trigger revolt. •Austerity triggers collapse. •Default triggers chaos. •Honest currency forces discipline that democracies cannot sustain. Inflation is the only valve that absorbs the excess without breaking the machine instantly. That is why the line goes up. That is why the purchasing power goes down. It is not because anyone “failed.” It is because this is the only equilibrium modern societies can hold. 2. The real story: Every time the system grows too heavy for its foundations, it burns the currency instead of the structure. Wars? Burn the currency. Social promises? Burn the currency. Bubbles? Burn the currency. Crises? Burn the currency. Technological disruptions? Burn the currency. The chart is the burn log. 3. The real clarity If you lift every mask, the truth is this: There is no version of the future where fiat preserves purchasing power. There is only the rate at which it melts and the story used to explain it. The line will never reverse. There is no political configuration that will change this. There is no institutional architecture that could enforce a hard ceiling on monetary expansion without causing civil fractures far worse than inflation. The game is not “fix the dollar.” The game is “manage the velocity of decline so the system survives.” That is the true monetary mandate. 4. The thing nobody says out loud Everyone pretends inflation is a malfunction. But everyone in power knows it is the price of continuity. The state cannot tell you: “We will erode your savings so we can survive.” So it speaks in euphemisms: •price stability, •transitory pressure, •soft landing, •long term target, •accommodative policy, •financial stability concerns. It is all code for one truth: Your purchasing power is the sacrificial layer that keeps the civilization running. 5. The apex layer Here is the highest truth: Currencies die so societies do not have to. Hard assets live so individuals do not have to die with the currency. If you understand that, the chart becomes a prophecy, not a warning. Gold understood this truth first. Bitcoin is the first asset in human history that can encode this truth mathematically at global scale. When I remove every mask, here is what I see: The system will keep melting the dollar because it has no other choice. Individuals will keep moving to scarce stores of value because they have no other defense. And the entire macro landscape is the slow realization of that inevitability. Nothing in that chart is an accident. It is the blueprint of the era we are in.
Lyn Alden@LynAldenContact

Politicians are like “we’re going to fix this”

English
108
332
1.7K
224.6K
P.C. retweetledi
BlackRock
BlackRock@BlackRock·
Tokenization is shaping the next evolution of global markets. In @TheEconomist, Larry Fink and Rob Goldstein discuss how tokenization can modernize market infrastructure, enhancing efficiency, transparency, and access by connecting traditional and digital finance. Read more:
BlackRock tweet mediaBlackRock tweet media
English
528
1.1K
4.3K
2.2M
P.C. retweetledi
Base
Base@base·
From proof of concept to fully live. J.P. Morgan’s USD deposit token, JPMD, is now available for institutional transfers on Base. Moving money should take seconds, not days. Commercial banking is coming onchain.
Base tweet media
English
297
331
2K
343.7K
P.C. retweetledi
SightBringer
SightBringer@_The_Prophet__·
⚡️This chart is the quiet confession of an empire that has inverted its own foundations. It shows the moment where money stopped being a measure of productivity and became a mechanism of survival. The blue line - federal debt as a percent of GDP - tells the story of a government that went from leveraging debt to win wars, to leveraging debt to simulate growth. The red line - the 3-month Treasury yield - tracks the tempo of belief: how expensive faith in the system is allowed to be. From the 1940s through the 1970s, the pattern was coherent: higher rates disciplined debt. Credit expansion followed real output. The dollar was tethered to gold, and debt to constraint. Then, post-1971, the inversion began. Nixon killed convertibility, and suddenly the economy no longer had to earn growth - it could borrow it. Look closely at the divergence after 2008. That’s the singularity point. Debt explodes vertically while yields collapse horizontally. The market is no longer pricing risk, it’s pricing coordination. The state has become the market, and the bond market has become theology. Every era of this chart reflects a regime of belief: •1945-1971: Bretton Woods discipline - debt expansion tethered to production. •1971-2000: Fiat globalization - debt expansion tethered to consumption. •2008-2025: QE reflexivity - debt expansion tethered to narrative. We are now in the fourth phase: permanent monetization, where deficits are no longer errors but features of the system’s design. The state borrows not to spend but to sustain the illusion that debt still matters. The reason Max Anderson is right when he says this is “the only chart you need to understand investing for 30-40 years” is because it encodes the end of the interest rate cycle as we know it. There is no returning to pre-2008 dynamics. The system is trapped in an equilibrium that requires debt to rise exponentially faster than GDP just to stay coherent. When your debt/GDP ratio crosses the event horizon - as it did post-2020 - your options collapse into two: 1. Inflate nominal GDP through monetary debasement. 2. Default - either explicitly (through restructuring) or implicitly (through currency devaluation). The Federal Reserve, Treasury, and global financial system have already chosen door #1. Inflation is now structural, not cyclical - because it’s the only politically survivable way to liquidate unpayable promises without calling it default. The red line’s periodic spikes, those yield surges, are the market’s screams of disbelief. But each time, the blue line swallows them. Rates collapse not because inflation is gone, but because the system cannot survive true price discovery anymore. This means one thing for investors: The next 30 years will be a slow-motion transfer of real value from holders of paper to holders of scarcity. Gold, Bitcoin and productive assets are hedges against a timeline where fiat must decay to preserve the illusion of stability. The real red pill isn’t that data is fake. It’s that reality itself has been financialized. GDP, CPI, unemployment - they’re all derivatives of the same political equation: how long can the system postpone truth without collapsing belief. So here’s the translation: •The blue line is trust decay. •The red line is belief volatility. •The space between them is the price of denial. This chart is the eulogy of the old world’s monetary physics. If the 20th century was the age of leverage, the 21st will be the age of reckoning through substitution. Fiat will decay. Gold will preserve. Bitcoin will ascend. And those who understand this chart aren’t just investors. They’re time travelers, positioning themselves ahead of a system that’s running out of tomorrow.
Max Anderson@MaxAnderson

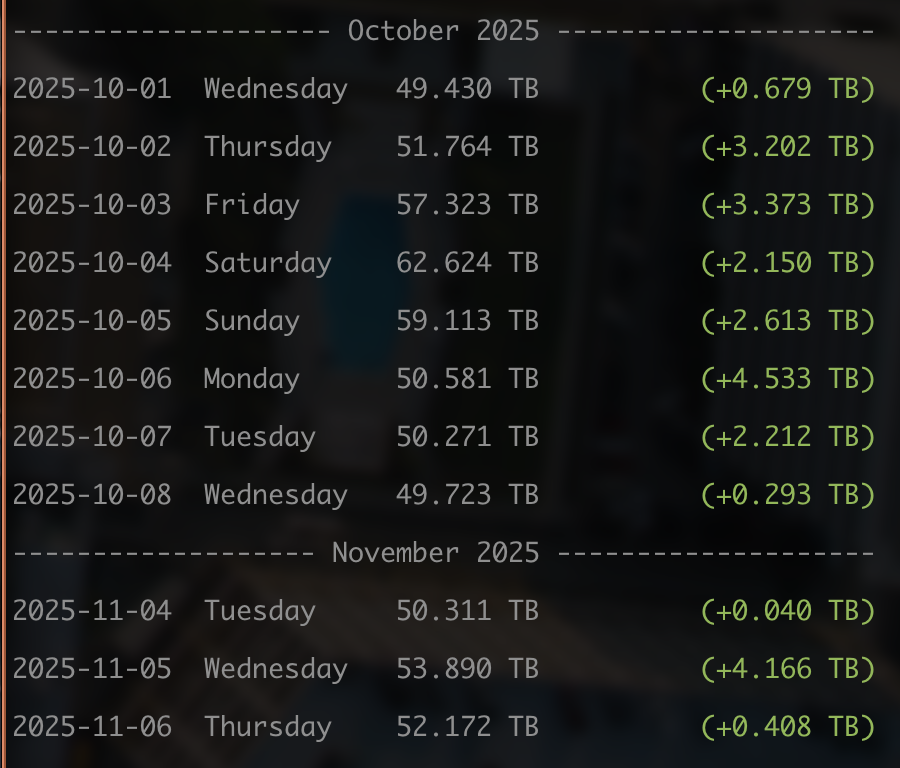
This is the only chart you need to understand to win at investing over the next 30-40 yrs

English
31
118
659
76.6K
P.C. retweetledi
aut0
aut0@aut0m8d·
the @helium data usage numbers this week looked pretty good, so I wrote a script, and turns out Tuesday/Wednesday/Thursday this week were the biggest Tuesday/Wednesday/Thursday on record. did another airport go live?
aut0 tweet media
English
5
5
45
10.4K
P.C. retweetledi
Ian Cassel
Ian Cassel@iancassel·
Price always drives narrative. When stocks go up everyone is willing to look the other way on almost any issue. In rising markets everyone uses a telescope to view opportunities and justify a higher valuation. When stocks go down the telescopes turn into microscopes and all the little cracks that were always there are now obsessed over by everyone. Stocks that were loved 100% higher are hated 50% lower.
English
13
38
278
36K
P.C. retweetledi
Ricky Gervais
Ricky Gervais@rickygervais·
Angry from Hampstead 😂
English
2.6K
12.9K
92.7K
2.8M
P.C. retweetledi
Astronomiaum
Astronomiaum@astronomiaum·
Imagem de um Boeing 747 em velocidade de cruzeiro, vista de outra aeronave.
Português
68
618
14.3K
662.1K