
Carlos retweetledi

To understand scaling in politics/economics/culture:
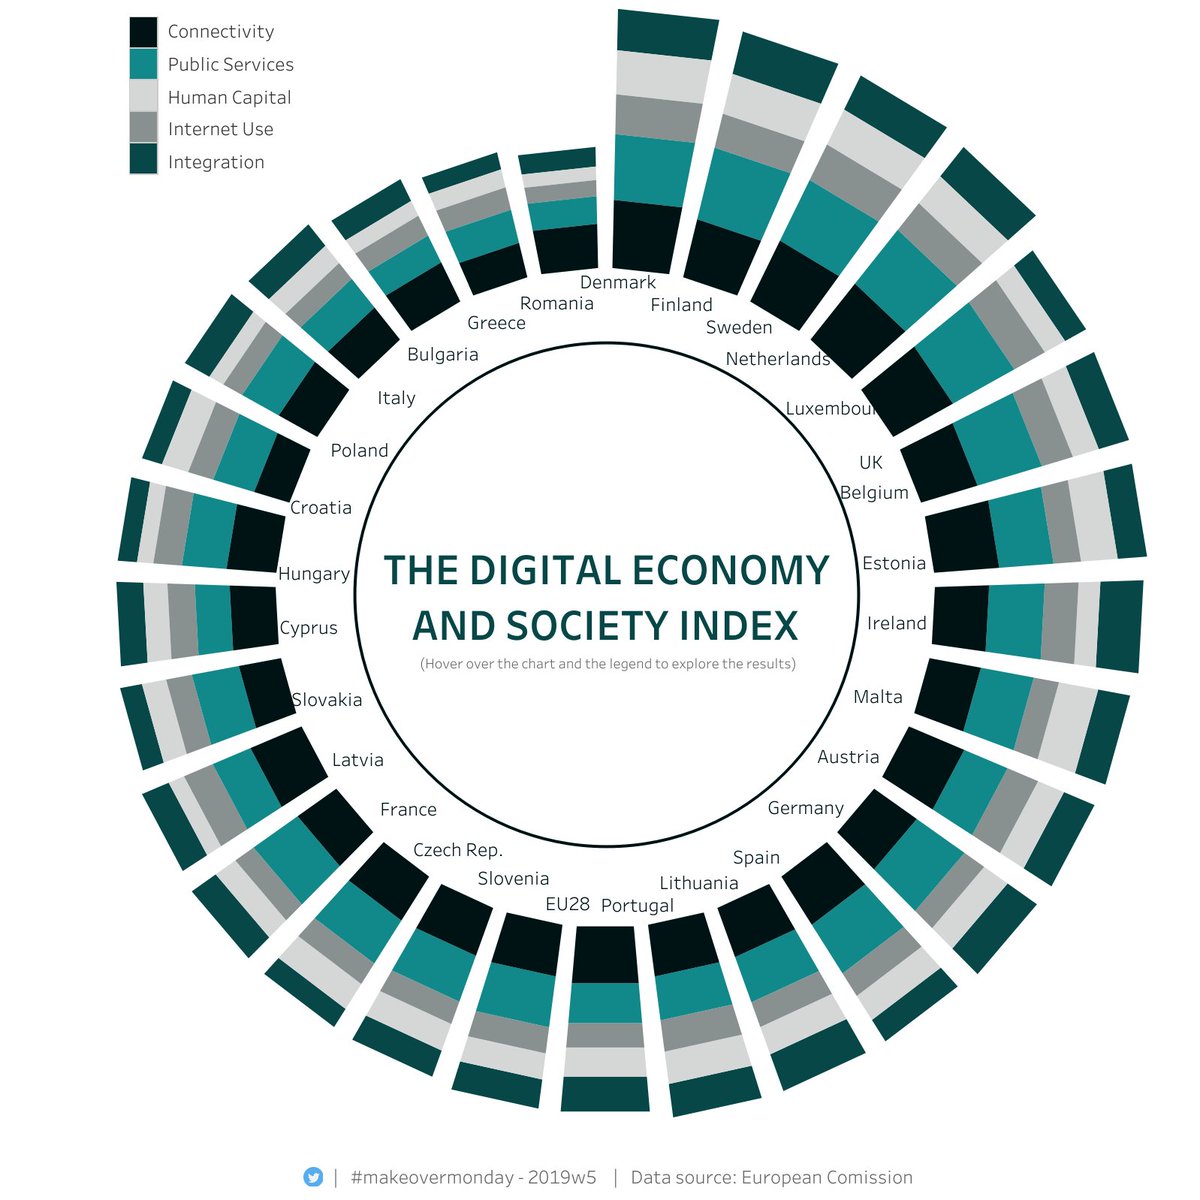
Mediterraneans (olive oil pple) have traditionally done best in groups & organizations of size < n,
N. Europeans (Butter pple) do best in groups & organizations > n.
Creating large orgs/states= Procrustean bed.
Discuss.
English