
the_Carpool_CEO
8.5K posts

the_Carpool_CEO
@carpool_ceo
Husband and Father. Laundromat / RE CEO. Dividend investor (opinions only, not advice!). Mississippi native, South Dakota resident. Future NYSE bell ringer.
Sioux Falls, SD Katılım Şubat 2013
1.7K Takip Edilen1.8K Takipçiler

Slowly winding down on here after solid ~6 year run. Once my last big inv soon adds another digit behind the family net worth, it’ll be time for a substantial break until the next target rich environment appears.
Minimum stress + maximum travel, sun, steaks & weights = best IRR.
English
the_Carpool_CEO retweetledi

$350 increase in export prices.
$TROX and $CC going to get volume and price.
Cathy@Cathy7757887435
The price of #TiO2 has increased three times this month.
English
@SummerSnowUSA @natezahm I sold a bunch of $4 2028 $trox puts
I’m heavy $asix but was buying in teens
English

@natezahm Very briefly in the past but I will take a look. Thank you for the rec!
English

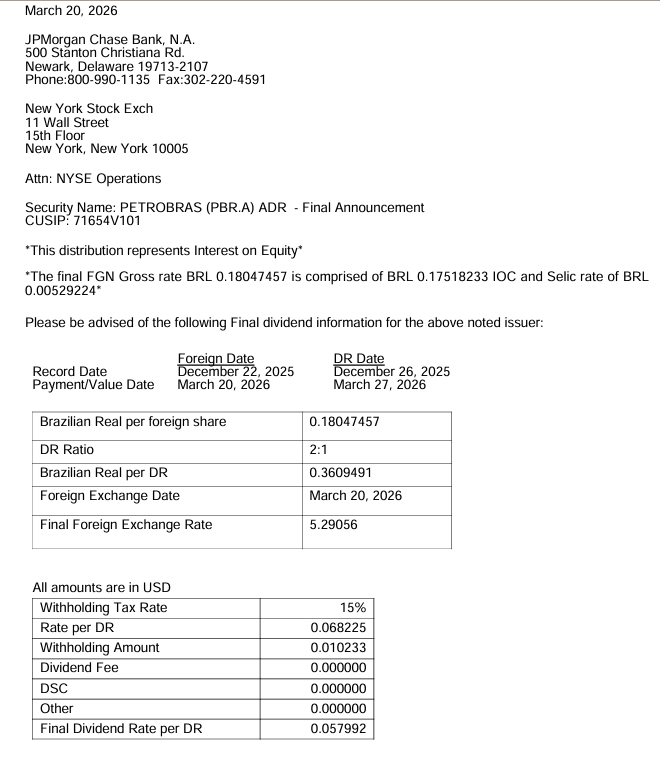
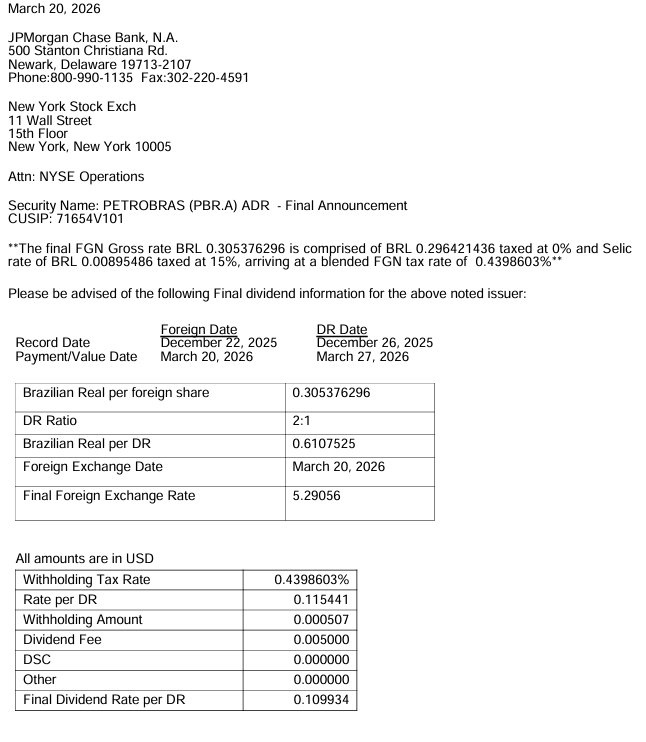
The 2nd installment of Q3 dividend of $PBR and $PBR.A, to be paid on March 27, has been fixed. The net amount, after tax and fees, is $0.167926 per ADR.
English


rumor has it @carpool_ceo backed up truck at $4.70 on $GGN at open
English


@carpool_ceo It's on my watchlist but although it's cheap with only a fwd PE of 9x it won't capture the same benefit as $MOS, $ICL or $CF. It's primary production is Nylon, with ammonium sulfate as a by-product. $ASIX requires Sulphur, which has gone up from $165 per tonne to $500.
English
the_Carpool_CEO retweetledi
$MOS is my #1 commodity supercycle pick - Deep Dive below 👇
What Mosaic actually does:
Mosaic is the world's largest integrated producer of phosphate AND potash — the two crop nutrients that cannot be synthesised from the air. They must be mined from finite geological deposits.
Two segments. Two very different cost structures. Both matter. Both are misunderstood.
━━━━━━━━━━━━━━━
Segment 1: Potash — the fixed-cost engine.
Mining cash cost at Esterhazy K3: ~$75/tonne. That number barely moves with oil, sulfur, or ammonia prices. The mine is built. The infrastructure is fixed.
Current MOP price: ~$265/t → margin ~$190/t
Mean-case MOP ($577/t, avg of prior episodes) → margin ~$502/t
2022 MOP peak (~$875/t) → margin ~$800/t
Every $10/t MOP increase = $65M incremental annual EBITDA.
$265/t → $577/t = +$312/t = ~+$2.0B EBITDA. Same mine. Same cash cost. Different price.
This is what genuine fixed-cost operating leverage looks like.
━━━━━━━━━━━━━━━
Segment 2: Phosphate — the spread business.
Phosphate is NOT a fixed-cost business. To make DAP fertilizer, Mosaic must buy:
• Sulfur: 0.4 long tons per tonne of DAP
• Ammonia: 0.23 tonnes per tonne of DAP
Both are variable costs that move with energy markets. Sulfur has spiked to $496/long ton (was $96 in Jan 2021). Mosaic faces a ~$250M EBITDA headwind in Q1 2026 from this alone.
This is a real cost. Don't let anyone — including me — hand-wave it away.
━━━━━━━━━━━━━━━
So why does phosphate still work in the bull case?
Two reasons:
1. Sulfur is a refinery byproduct:
Sustained oil >$100 = sustained refinery throughput = more sulfur supply = price normalisation. The current spike is a transitional disruption, not a structural shift. Historically these spikes mean-revert within 12 months.
2. The 2022 proof:
In 2022, ammonia rose +288% and sulfur +165%. Mosaic still delivered $6.2B EBITDA. Why? Because DAP prices surged +100% and potash +280% — output prices overwhelmed input costs and stripping margins EXPANDED. The 2022 SEC filings confirm this is not theoretical.
The phosphate thesis requires output prices to lead inputs. History shows they do — but it’s a spread bet, not a fixed-cost bet.
━━━━━━━━━━━━━━━
The valuation gap is the clearest part of the story.
$29.30 stock. $13.9B EV. $2.4B 2025 EBITDA.
EV/EBITDA: 5.8×
10-year median: 7.4×
Sector median: 10.6×
MOS is trading 26% below its own historical median on already-depressed trough earnings. 2022 actual EBITDA was $6.2B — same assets, same mines, just different commodity prices.
The gap between $2.4B today and $6.2B in 2022 is almost entirely commodity pricing. It’s not a broken business.
━━━━━━━━━━━━━━━
Five converging catalysts — all pointing the same direction.
① Oil >$100 → potash price lag: historically peaks 8 months after oil crosses $100 (confirmed across 2008, 2011 and 2022 episodes)
② China phosphate export restrictions: volumes fell from 9.9M t (2021) to 4.5M t (2025). Restrictions confirmed through Aug 2026. Mosaic is fielding demand from customers China historically served.
③ Sulfur normalisation in H2 2026: refinery throughput recovery increases byproduct supply.
④ Record global fertilizer shipments forecast for 2026: management guidance, grower nutrient replenishment after strong 2025 crop
⑤ US Critical Minerals List + Defense Production Act: phosphate and potash designated strategic. First-mover domestic producer benefit.
Five drivers. None of them are priced in at $29.
━━━━━━━━━━━━━━━
The buyback advantage — a structural tailwind on top of the commodity thesis.
2022: ~380M shares outstanding. Stock peaked ~$75.
2026: 317.5M shares outstanding. That’s 17% fewer shares.
If Mosaic hits 2022-equivalent EBITDA on 317M shares vs 380M shares, the same earnings generate materially higher value per share — before any valuation re-rating.
Management has been buying back stock at $29 for 18 months. Every share retired at trough prices is compounding value waiting to be unlocked.
━━━━━━━━━━━━━━━
What’s not in my model — free optionality.
• Ma’aden stake: marked at ~$1.9B in Q3 2025. That’s ~$6/share on the balance sheet not captured in EV/EBITDA.
• Uberaba rare earths: processing phosphogypsum waste into NdPr oxide (EV magnets). Joint development agreement signed Mar 2026. Production target 2030.
• Florida land monetisation: flagged by management for 2026.
• US strategic procurement: Defence Production Act invocation could mean gov’t contracts at above-market prices.
None of this is in the $102 mean-case target.
━━━━━━━━━━━━━━━
The risks — stated clearly.
• Sulfur stays elevated:
If Hormuz disruption reduces refinery output rather than increasing it, sulfur supply stays tight. Phosphate margins stay compressed deeper into 2026 or beyond. This is the #1 near-term risk and it is real.
• Oil retreats below $80:
Removes the entire commodity lag thesis for both potash and phosphate. Thesis requires sustained oil >$100.
• Belarus/Russia potash exports recover:
Additional supply caps the $577/t repricing case.
• Brazil credit crunch persists:
Mosaic Fertilizantes missed 2025 targets. Brazil is the volume recovery driver — if credit stays tight, the recovery is delayed.
• Balance sheet:
Net debt $4.6B. FCF was constrained in Q4 2025. Watch H1 2026 cash conversion closely.
━━━━━━━━━━━━━━━
The numbers.
Current:
$29.30
EV/EBITDA 5.8×
26% below own 10-yr median
Bear ($25, −15%):
Oil retreats. Potash flat. Sulfur persists. Everything goes wrong at once.
Mean ($102, +248%):
8× EV/EBITDA on avg-episode EBITDA of ~$4.6B. Potash to $577/t. Sulfur normalises H2.
China restrictions hold.
Conservative multiple — below MOS own median.
Bull ($125, +327%):
7× EV/EBITDA on confirmed 2022 EBITDA of $6.2B. Fewer shares than 2022 amplify per-share value.
Analyst consensus: ~$34 (12-month static, no commodity cycle assumption)
The analysts will upgrade after it’s already moved.
Not financial advice. DYOR. 🌾
$MOS $NTR $CF $ICL
Unicorn Hunter 📈@EUnicornHunter
Deep dive on $MOS to follow tomorrow, key points in the graphic below 👇
English


Chems and ag went bananas today. I’m irresponsibly long near term
English