
Caswell Munyai retweetledi

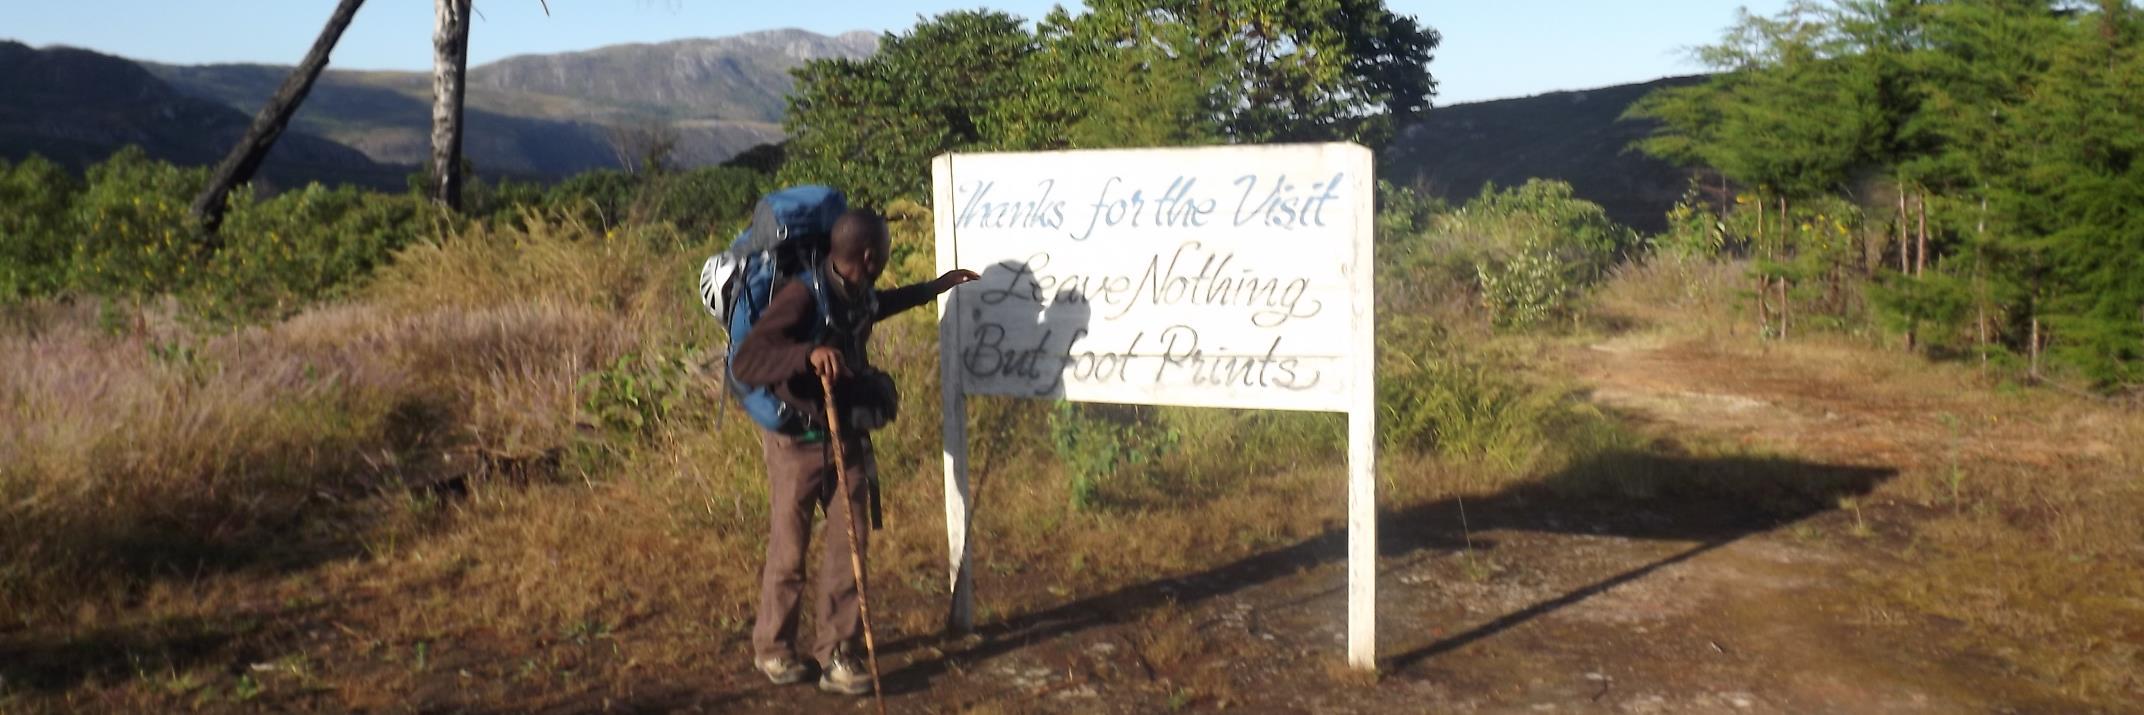
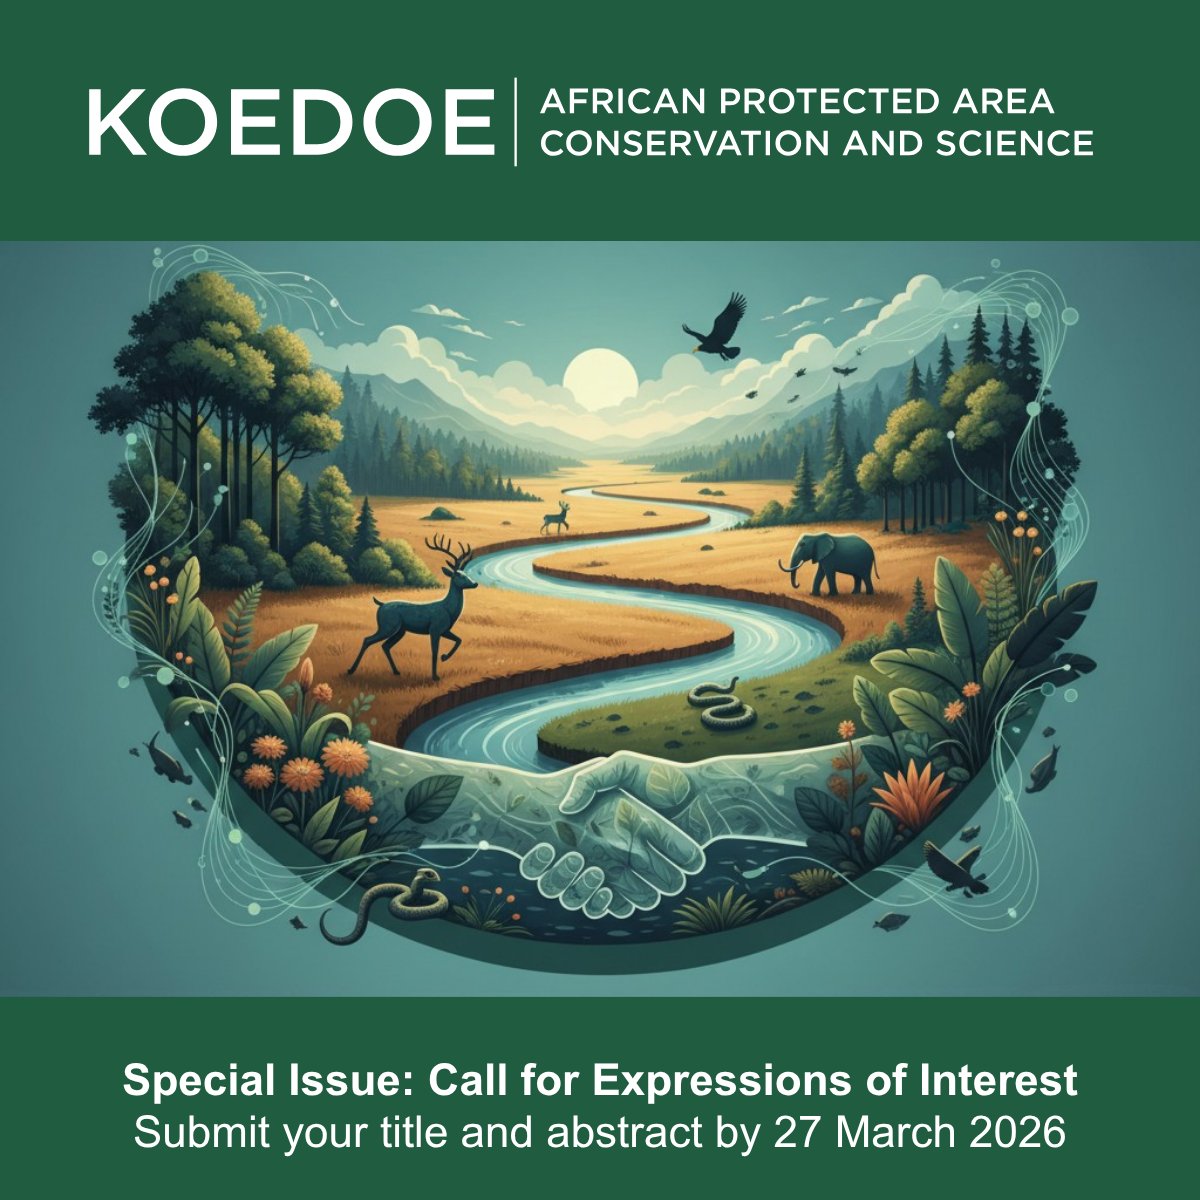
'Koedoe' invites Expressions of Interest for its 2027 Special Issue: 'Towards Just and #SustainableMegaLivingLandscapes.' Showcase innovative research, lessons, and partnerships shaping @SANParks Vision 2040. Submit by 27 March 2026. Learn more: ow.ly/pUTP50YxX8B
#AOSIS
English