Christoffer H. Dausgaard

1.9K posts

Christoffer H. Dausgaard banner
Christoffer H. Dausgaard

Christoffer H. Dausgaard

@chdausgaard

PhD, political scientist @polscicph @uni_copenhagen. Retrospective voting, social groups, political behavior.

Copenhagen Katılım Ağustos 2015
2.1K Takip Edilen1.1K Takipçiler
Sabitlenmiş Tweet
Christoffer H. Dausgaard
Christoffer H. Dausgaard@chdausgaard·
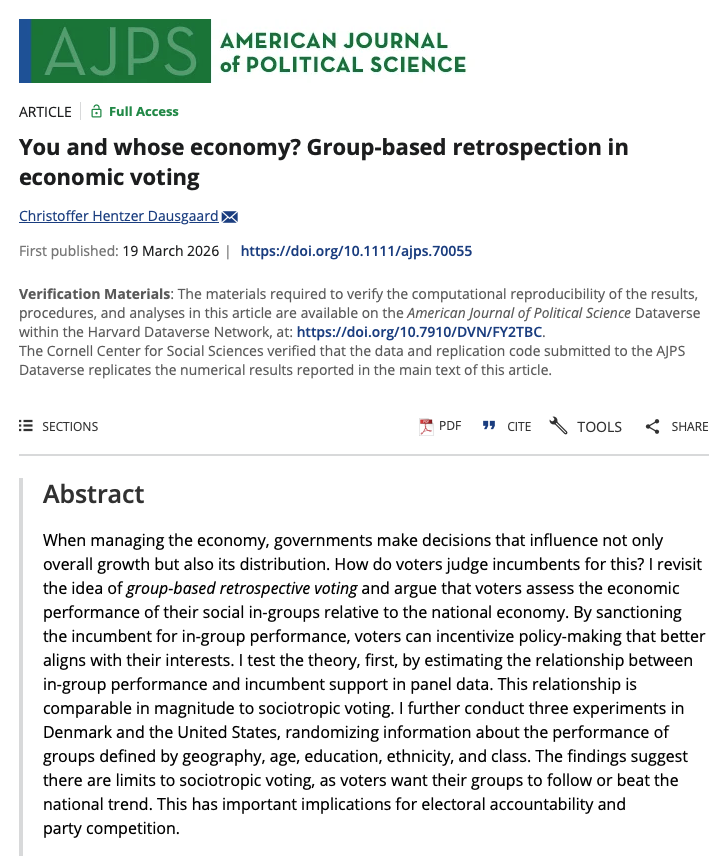
Very excited that the first paper of my PhD is out in @AJPS_Editor! 🎉 I theorize and test the idea of "group-based" economic voting using experimental + observational evidence from Denmark + UK + US. 1/🧵
Christoffer H. Dausgaard tweet media
English
4
24
113
7K
Christoffer H. Dausgaard retweetledi
Thiemo Fetzer 🇪🇺🇺🇦 - same handle elsewhere
Its now ten years since the UK voted narrowly to Leave the European Union. I have studied how the UK got there through my research for many years now. Evidence is growing that the UK is indeed leveling up, but, by leveling down. Let me introduce the Brexit Cost project:
Thiemo Fetzer 🇪🇺🇺🇦 - same handle elsewhere tweet media
English
2
15
29
2.5K
Christoffer H. Dausgaard retweetledi
Verasight
Verasight@verasight_data·
Congrats to @chdausgaard (Copenhagen) on a new @AJPS_Editor article, with US survey data from Verasight. Voters judge how their own group is doing, not just the national economy, and reward or punish incumbents for it. doi.org/10.1111/ajps.7…
Verasight tweet media
English
0
1
2
132
Christoffer H. Dausgaard retweetledi
Juan Felipe Riaño R.
Juan Felipe Riaño R.@JuanFelipeRiano·
🚨New NBER working paper alert 🚨 🤔2021–2024 was the worst U.S. inflation in four decades. The question: Did voters react to the rising prices, or to the shrinking paychecks? 😱We approached this paper with one major surprise: there is no official measure of inflation at the county level in the U.S. 🌟To study the relationship between inflation and electoral outcomes during, we first had to construct local inflation measures using county-level data on family budget costs and incomes. The answer? -> Check it out! 👇 🔗 nber.org/papers/w35301
Juan Felipe Riaño R. tweet mediaJuan Felipe Riaño R. tweet mediaJuan Felipe Riaño R. tweet media
English
7
51
264
59K
Christoffer H. Dausgaard retweetledi
joseph francis
joseph francis@joefrancis505·
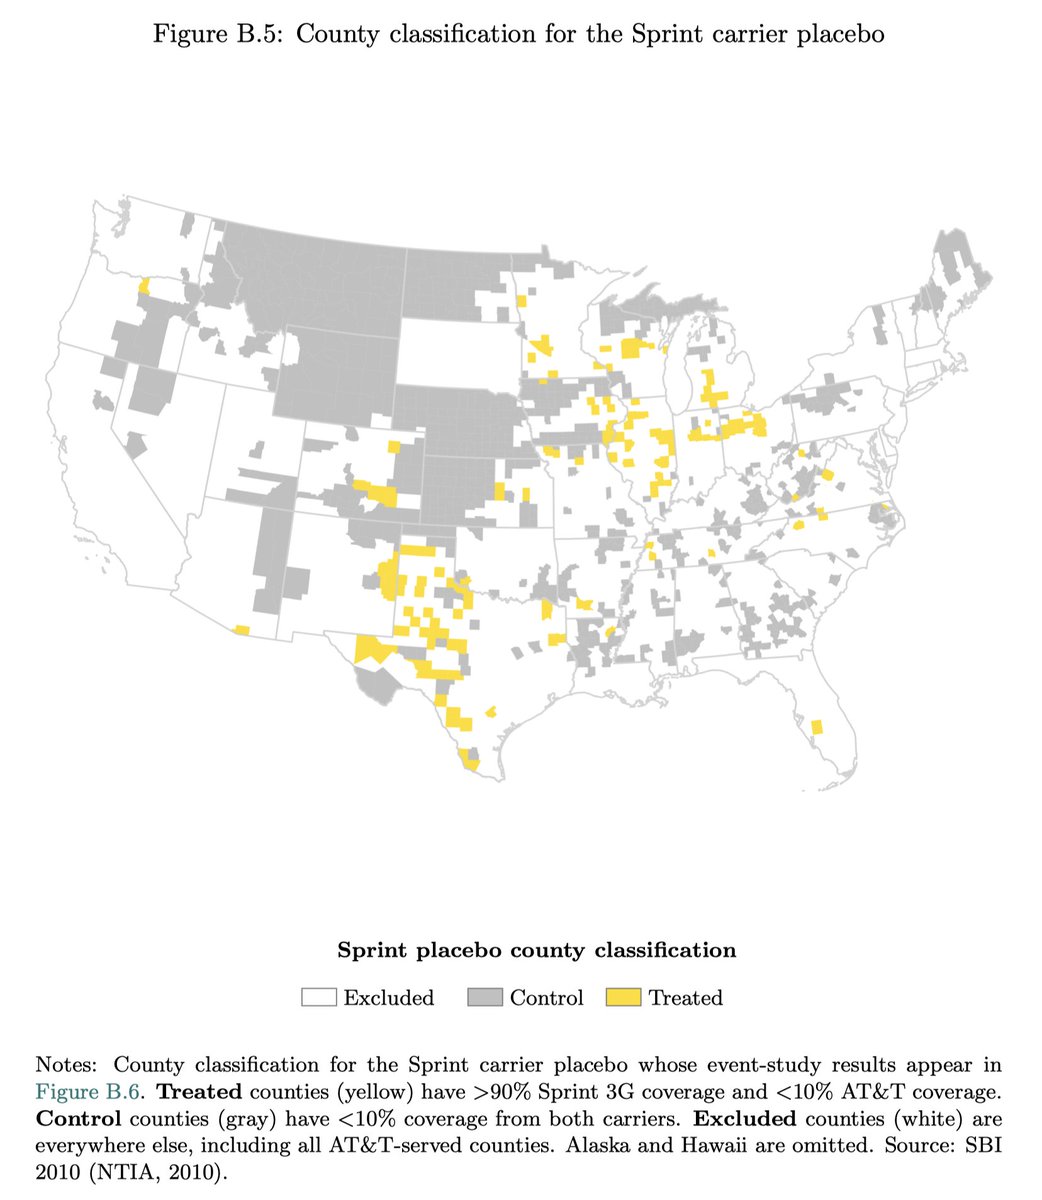
I fear that the new cellphones-cause-low-fertility NBER working paper has found a potentially genuine divergence between the fertility rate in rural and urban counties in the US, then labelled it "iPhone." The problem is that AT&T coverage was heavily urban, resulting in an imbalance between the control and treated group. The matched Poisson regression is supposed to address that by overweighting the small number of notionally urban counties that did not have iPhone coverage. But I believe that by "urban," they mean counties in which just 33% or more of the population were in towns of 2,500+ people. It would therefore included a lot of places that are, in fact, rural. To me, it seems like there's a failure of identification. Hence, the SDiD result could reflect iPhones or a differential effect of the Panic of 2007 on rural and urban areas. We don't know. The other-carrier placebos are also uninformative because they are structurally incapable of reproducing the urban-rural confound, given how they are mapped. The paper is here: nber.org/papers/w35310.
joseph francis tweet mediajoseph francis tweet mediajoseph francis tweet media
English
19
60
392
54.5K
Christoffer H. Dausgaard retweetledi
Yamil Ricardo Velez
Yamil Ricardo Velez@YamilRVelez·
Did the treatment work because it included moralizing language, as your theory predicted, or because it was packed with political references and written in an informal style? A new JASA paper by Imai and Nakamura offers a clever approach to these questions and others: leveraging generative AI models to extract and control for latent confounds. As researchers start relying more on generative AI outputs as treatments, this kind of approach serves as a useful post-hoc robustness check. But this isn't solely for AI-generated treatments. It also works for human-generated treatments, since the vast semantic information captured by these models can help adjust for features we may have trouble measuring or articulating. Exciting to see an emerging workflow that uses AI at multiple stages of the experimental design process. imai.fas.harvard.edu/research/llm/
Yamil Ricardo Velez tweet media
English
0
7
50
3.6K
Christoffer H. Dausgaard retweetledi
AEA Journals
AEA Journals@AEAjournals·
Forthcoming in the AER: "Taxing Top Wealth: Migration Responses and their Aggregate Economic Implications" by Katrine Jakobsen, Henrik Kleven, Jonas Kolsrud, Camille Landais, and Mathilde Munoz. aeaweb.org/articles?id=10…
English
0
43
127
26.5K
Christoffer H. Dausgaard retweetledi
Gabriel S. Lenz
Gabriel S. Lenz@GabeLenz·
Want to use agents like Codex or Claude Code to speed up academic projects? Want to tell the agents what changes to make to each figure and table and then watch the changes appear in the book, dissertation, or article? Then, you might find repo helpful. ...
Gabriel S. Lenz@GabeLenz

Codex has taken the pain out of finishing a data-heavy book. Here’s a paragraph about it. I use high effort for planning, medium for execution with a ChatGPT plus. Yet to hit a limit, despite talking to it many hours a day (using Wispr Flow). Academia sure is changing.

English
1
4
24
4.4K
Erin Hengel
Erin Hengel@erinhengel·
@chdausgaard @ben_golub Establishing a corr between time/rounds spent in peer review and citations isn't the purpose of this paper, but you can see a clear negative correlation between time in Tables 1 and 2 (p. 12 and p. 15). (There is no or a positive correlation w no. rounds.) erinhengel.github.io/time/time.pdf
English
1
0
2
81
Christoffer H. Dausgaard
Christoffer H. Dausgaard@chdausgaard·
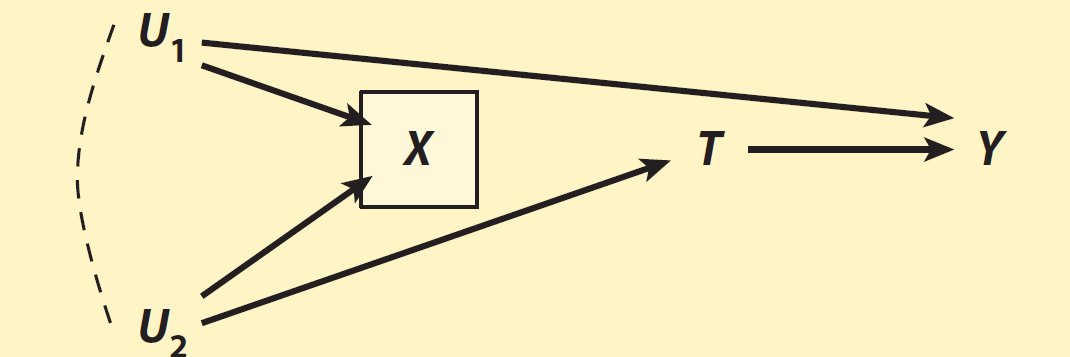
I mean this is just pretty obviously collider bias, right? By conditioning on Nature comms acceptance it induces a spurious negative correlation between reviewer leniency and paper quality. Very obvious that papers that *survived* tougher reviews are higher quality on average.
Jay Van Bavel, PhD@jayvanbavel

People often complain about tough peer reviews But papers that elicited stronger criticism from reviewers and required more-extensive revisions received more citations tha did papers that drew light comments and sailed through the peer-review process. We need to embrace constructive criticism if we want to do stronger work. nature.com/articles/d4158…


English
3
14
126
17.3K
Erin Hengel
Erin Hengel@erinhengel·
@chdausgaard @ben_golub Of course, in economics journals papers are very rarely rejected after receiving an R&R so it’s perhaps less likely that weak papers given R&Rs will be weeded out in subsequent rounds and more likely that they’ll be accepted.
English
1
1
3
155
Christoffer H. Dausgaard
Christoffer H. Dausgaard@chdausgaard·
@erinhengel @ben_golub Interesting! I’d be curious to see those estimates. To be sure, collider bias could in that case still be depressing a strong relationship without flipping the sign; whereas here it flips the sign. The problem is that this correlation kind of mixes up both effects.
English
1
0
0
286
Erin Hengel
Erin Hengel@erinhengel·
@chdausgaard @ben_golub Actually, a reverse correlation is generally observed, at least in economics journals. (That is, accepted papers that went through more rounds and longer peer review are generally cited less than accepted papers that went through shorter peer review with fewer rounds.)
English
2
0
6
512
Christoffer H. Dausgaard retweetledi
Seth Lazar
Seth Lazar@sethlazar·
I have been testing it *very* extensively, and I think that, as of right now, the confidence is warranted. However I do think that people should have a clearer sense of what it's saying when it says something is 100% AI generated. It breaks the item down into chunks, generally 350-400 words, and makes a prediction about whether that chunk contains some AI. So "This paper is 100% AI generated" really means "100% of the tokens in this paper are in a chunk that we believe has AI in it".
English
3
3
103
9.7K
Rune Schmidt Qvist
Rune Schmidt Qvist@runesqvist·
@chdausgaard My political beliefs serve my psychological need for my political beliefs to reflect the evidence.
English
1
0
1
53
Christoffer H. Dausgaard retweetledi
Hanno Hilbig
Hanno Hilbig@hannohilbig·
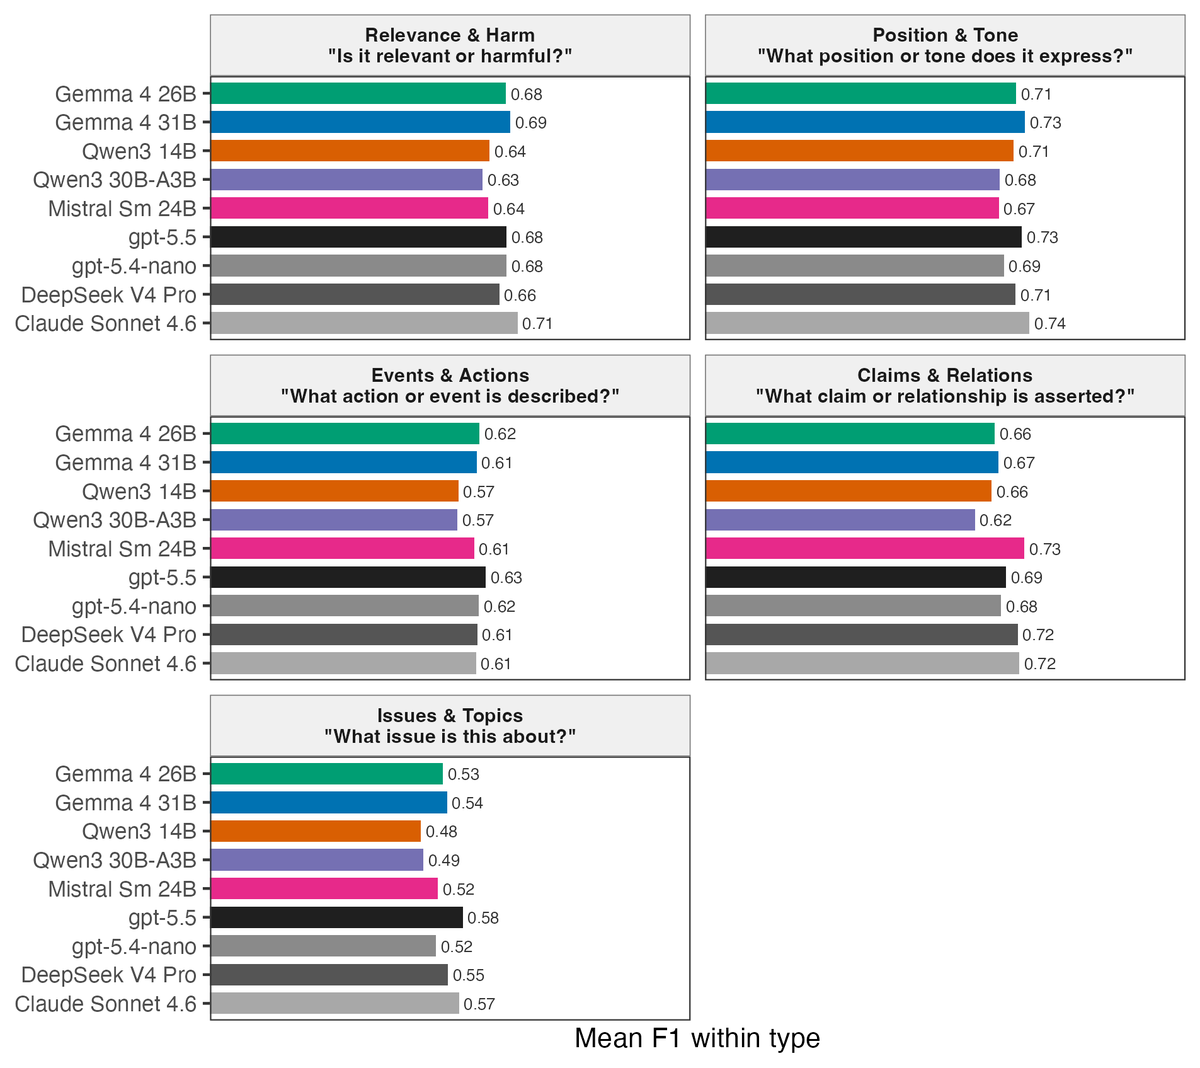
Update on my benchmark of local vs. commercial LLMs for text classification, focusing on political science applications. I compared 5 local open-weight models with 4 API models on 34 coding tasks (~147k predictions). Tasks include tweets, news, survey responses, policy texts, etc The best local LLMs are often close and sometimes perform better. Local models match or exceed API on 9/34 tasks. The average API advantage is pretty small, at 0.015 F1.
Hanno Hilbig tweet mediaHanno Hilbig tweet media
English
3
17
46
5.5K
Christoffer H. Dausgaard retweetledi
Owen Winter
Owen Winter@OwenWntr·
The local elections in one chart. Labour has been squeezed between the Greens in young wards and Reform in older working-class wards
Owen Winter tweet media
English
86
502
4.8K
694.6K
Christoffer H. Dausgaard retweetledi
Eashwar Nagaraj
Eashwar Nagaraj@eashwarnagaraj·
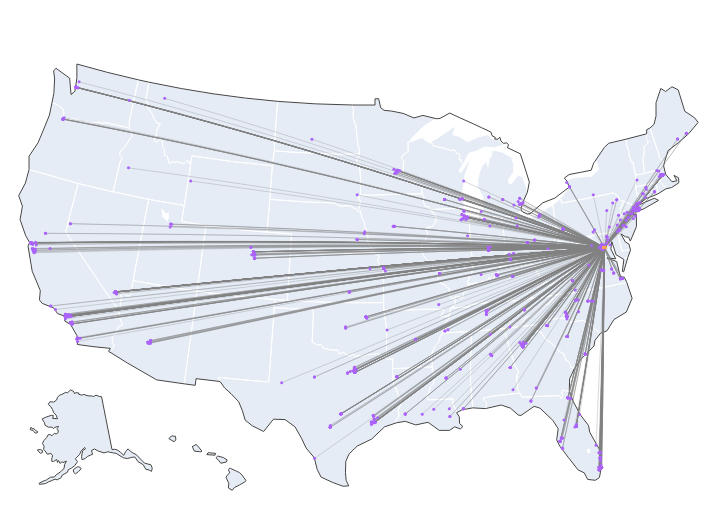
🚨Early version of my JMP! 🚨 To what extent is the contact between corporate lobbyists and federal government officials publicly disclosed? In other words, how big is the market for "shadow lobbying"? The Lobbying Disclosure Act mandates quarterly disclosure of lobbying "contacts" subject to many caveats. Watchdogs have long complained about lacunae in the LDA, but there is little evidence of the size of shadow lobbying market. In my JMP, I use 4.5 trillion pings from 179 million smartphones spatially merged to building shapefiles and observe movement between lobbyists' offices, corporate headquarter buildings, and the federal government in Washington DC. See below: movement of lobbyists from corporate HQs to federal government buildings:
Eashwar Nagaraj tweet media
English
10
76
434
147.5K
Christoffer H. Dausgaard retweetledi
Brandon Stewart
Brandon Stewart@b_m_stewart·
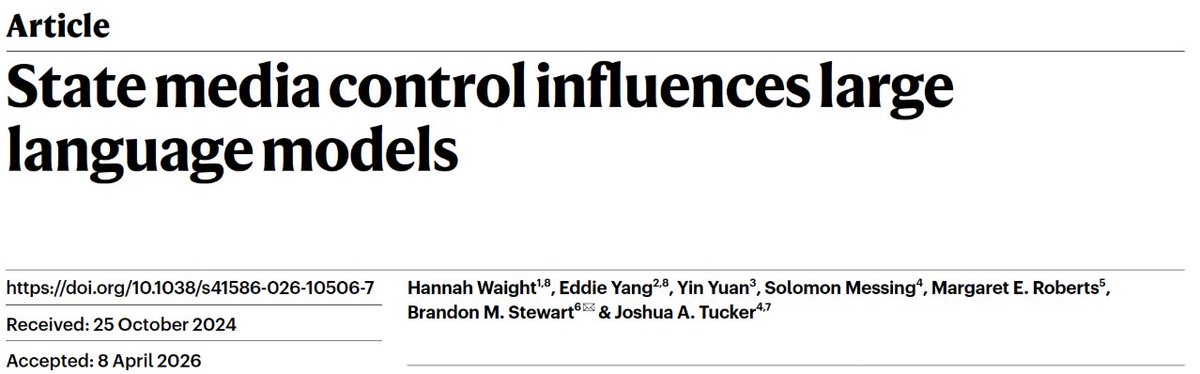
1/ New @Nature! We study how powerful institutions shape the information environment for LLMs. Commercial LLM training is opaque, so we trace a path from state-coordinated media -> training data -> model responses.
Brandon Stewart tweet media
English
5
70
178
27.3K