Top line is where the liquidity fuel has cyclically exhausted. It ends the red zone. All multi-year tops have printed here.
Bottom line is where the liquidity fuel has cyclically ignited. It begins the red zone. All multi-year parabolic moves have started here.
Bitcoin doesn’t care about the calendar. It cares about liquidity.
Where are we?
I bought RGTI, IONQ, and TSLA at the end of August. In less than two months, half of my account saw a gain of 85.54%/2 = approximately 43%. There were still many opportunities in early September, but due to risk management, I couldn't continue to build a position.
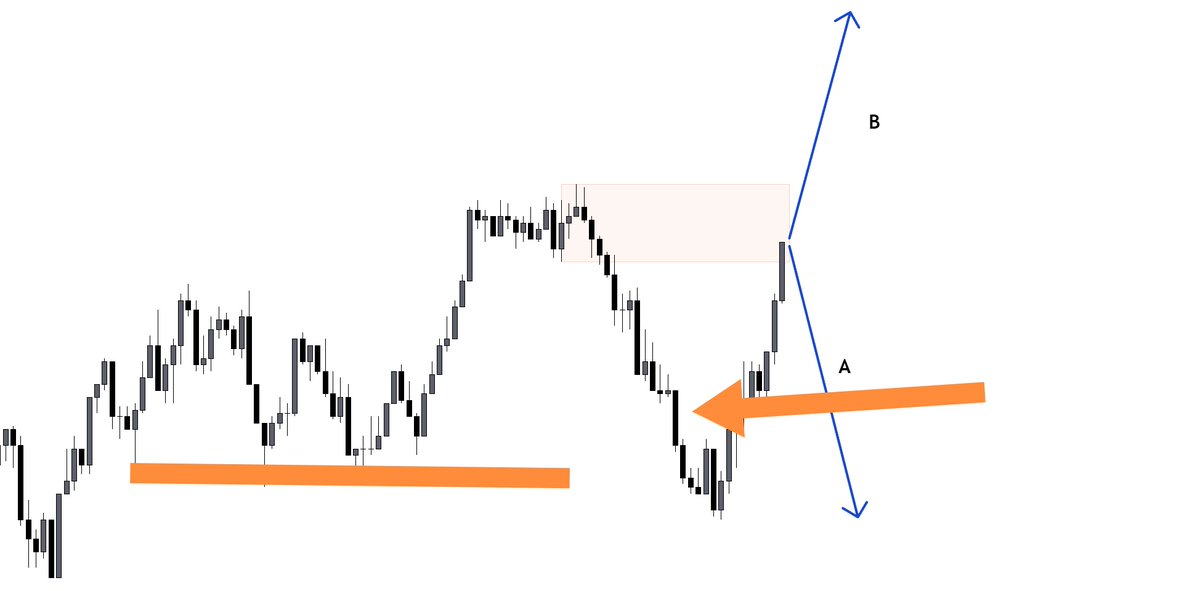
@JROD_FX I target B. Took at the lows and the Fvg for change in state of delivery to move up to take out the high as next oquidity hunt. Is that right? Plz advice, this is super useful.
Intraday Training
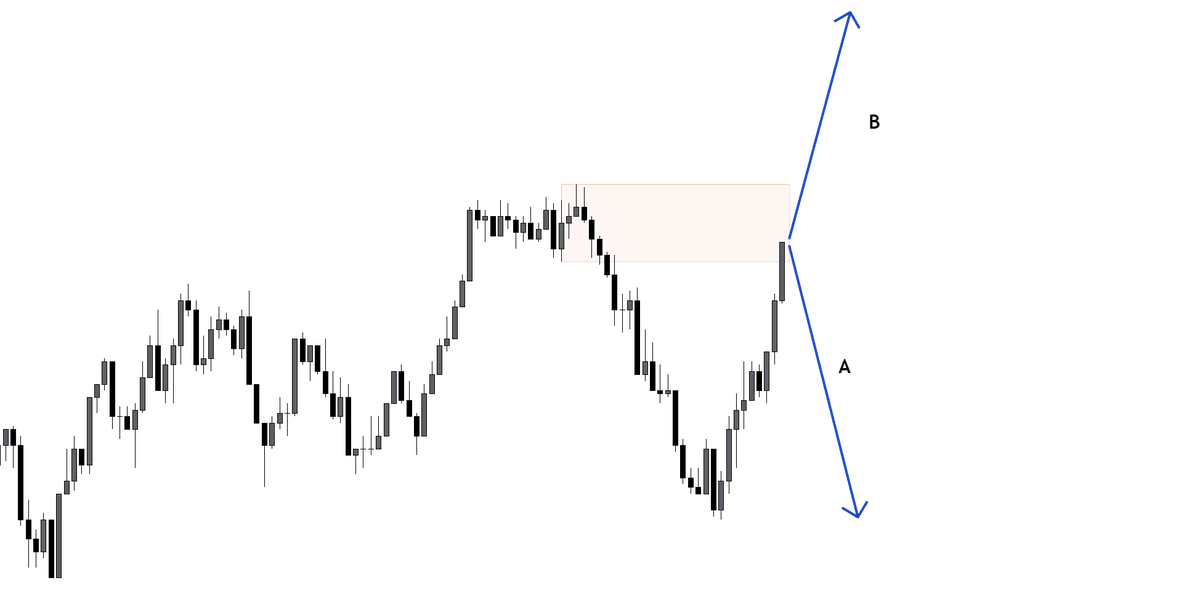
Please tell me which of the two scenarios is the most valid without context and why?
Before, we have little kids complaining in the comment section. I've received a lot of great dms saying that this has helped traders enhance their thought process.
So, why not try this little quiz?
@LumiTraders I just added multiple, but the shipping cost is not the same but increasing.. i.e. i was looking to buy 4... but see the shipping cost increase with each moust mat....
🎄New Year Giveaway! 🎄
To kick off 2024 with a bang, I'm giving away 3 trading mouse pads to show my appreciation for your incredible support! I’m very happy to have such a nice community here. Lots of people here send me daily messages with their kind words. Appreciate it so much and never expected I would have such amazing people in my life 😊
Also, many of you have shown interest in my mouse pad, and now, it is available for everyone to purchase.
lumitraders.com/pad
But let's do giveaway first! 🎁
Here's how you can enter:
1️⃣ Follow me 👀
2️⃣ Like and retweet ❤️
3️⃣ Drop a comment below sharing your 2024 goals and how you plan to achieve them ✨
3 winners will be announced on January 7, 2024.
Good luck, and let's make this year one to remember! 🌟
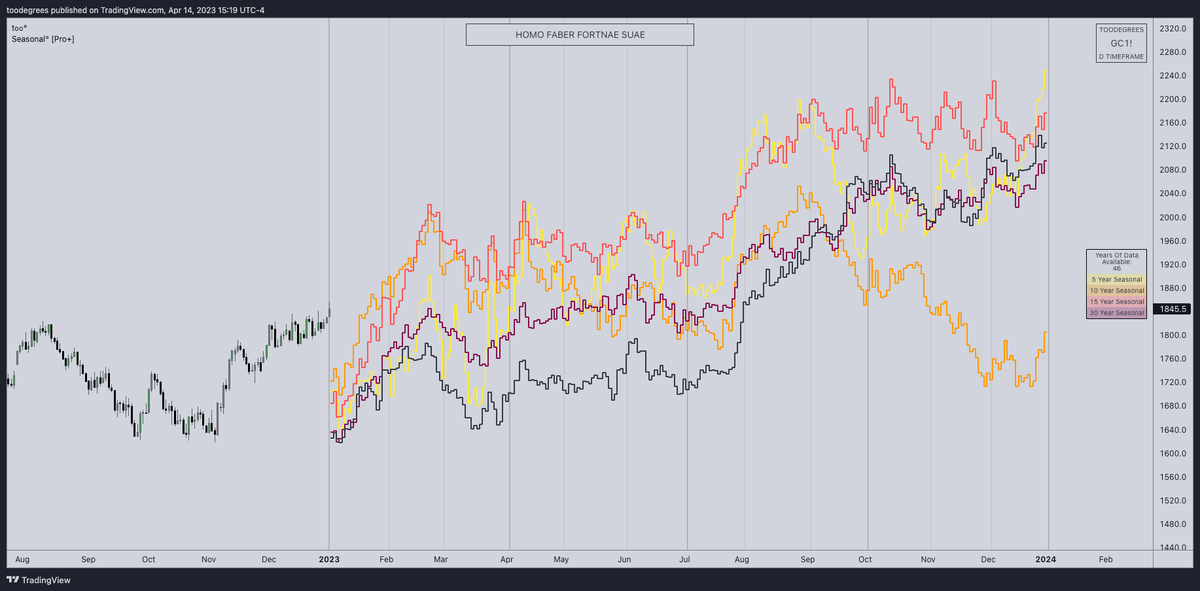
This tool can display FIVE different Seasonal Tendencies:
🟨5 Year Seasonal
🟧10 Year Seasonal
🟥15 Year Seasonal
🟫30 Year Seasonal
⬛️ All Time Seasonal
Monthly and Quarterly dividers can be shown as well, allowing you to have clear points of reference.
🧵Seasonal Tendency° [Pro+]🧵
A friend of mine introduced me to the challenge of visualizing Seasonal Tendencies in TradingView a couple months back. I have been using and coding them since.
Worked hard to code a tool that ICT traders could easily use.
Let me show it to you: