@NecoKronos Hear your logic, for sure! However, you cannot use the mentality of HL degens to mirror any actual trading behavior of commerical/tute traders on futures that trade on $CME
English
Cignals.IO
1.5K posts
@CignalsIo
#Bitcoin/#Crypto/#TradFi order flow and volumetric tools since 2017. Sign up today & trade like the pros do. Built by professional prop traders.


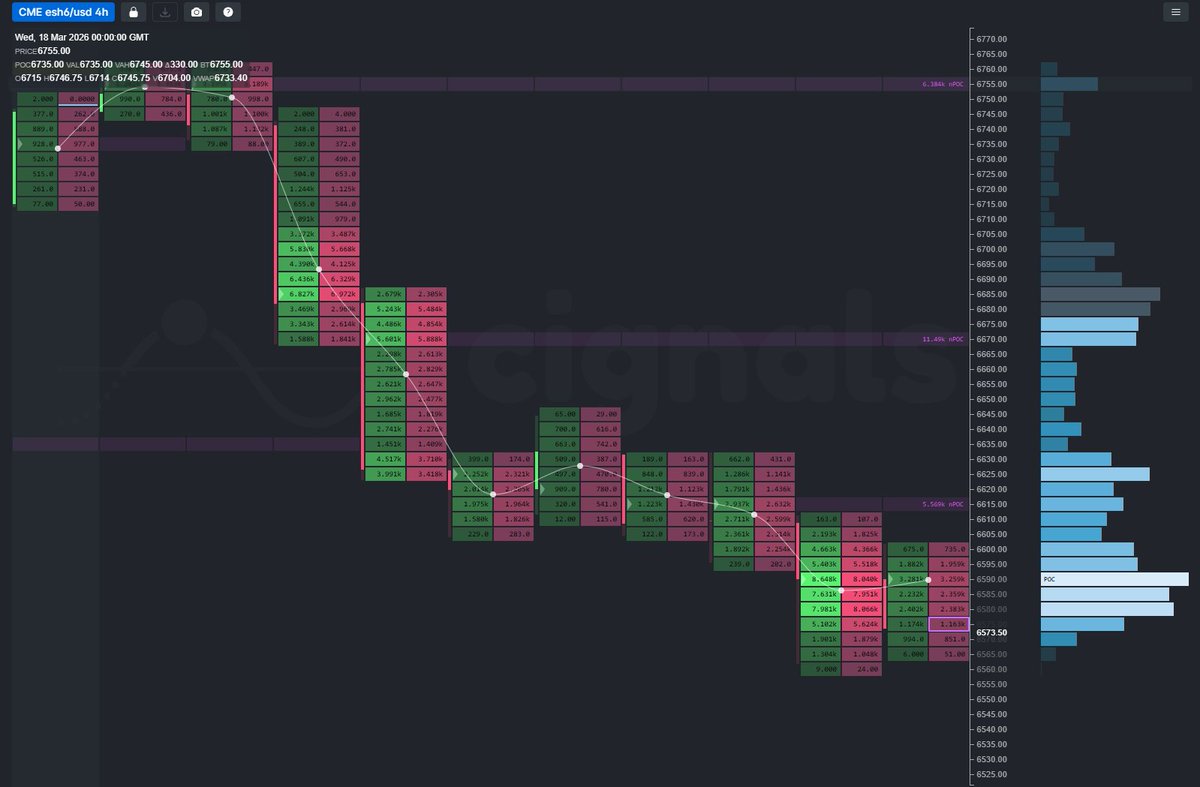


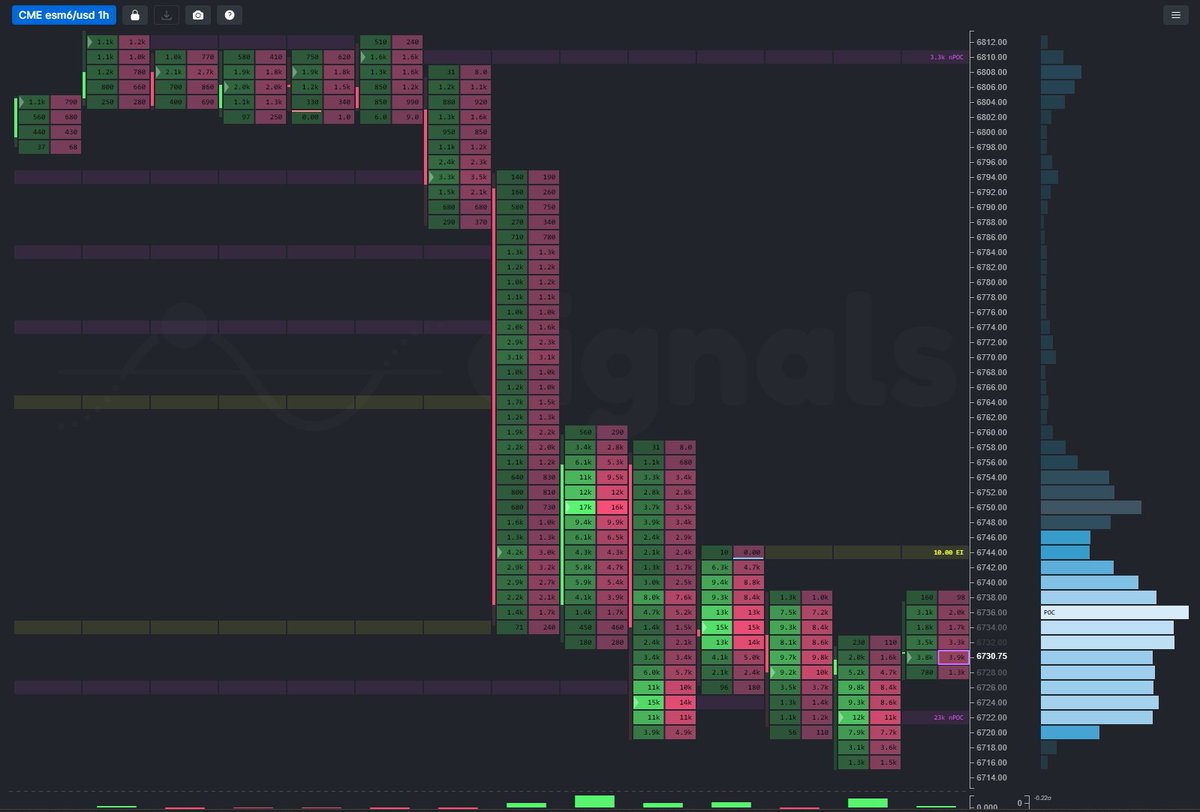
$ES_F showing major signs of rejection ~$6810 leading up to the #FOMC statement. Not much in the statement this time around, but #SEP appears to show only 1 potential rate cut this year & in 2027. Watching for break <$6700 as #JPow takes the mic for the presser at 2:30 PM EST.

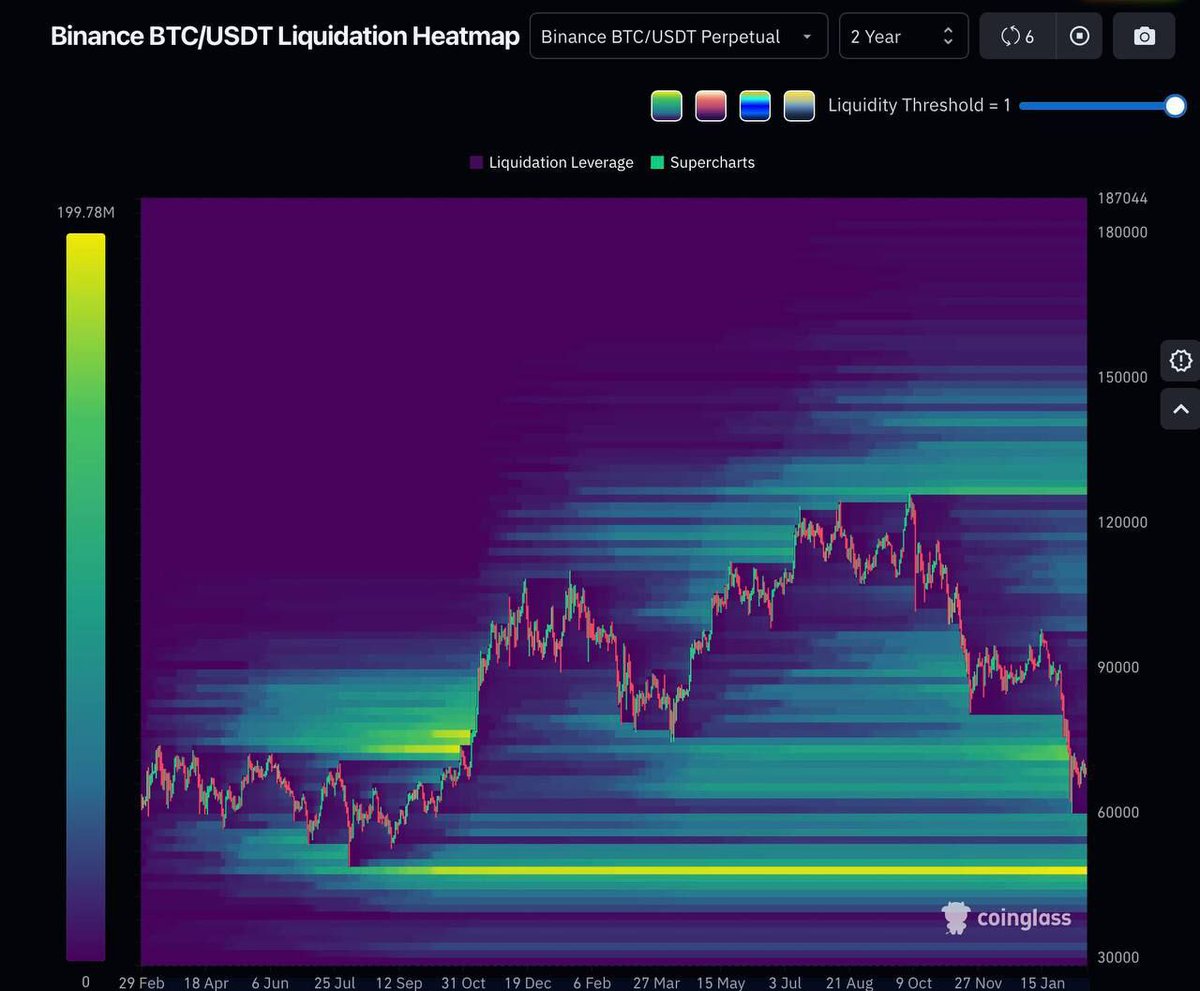
Liquidation Maps - Meme or Alpha I will show in three simple points why liq. maps should not be taken seriously I have spent a fair amount of time designing them myself & the conclusion I had each time was the data lacks reliably