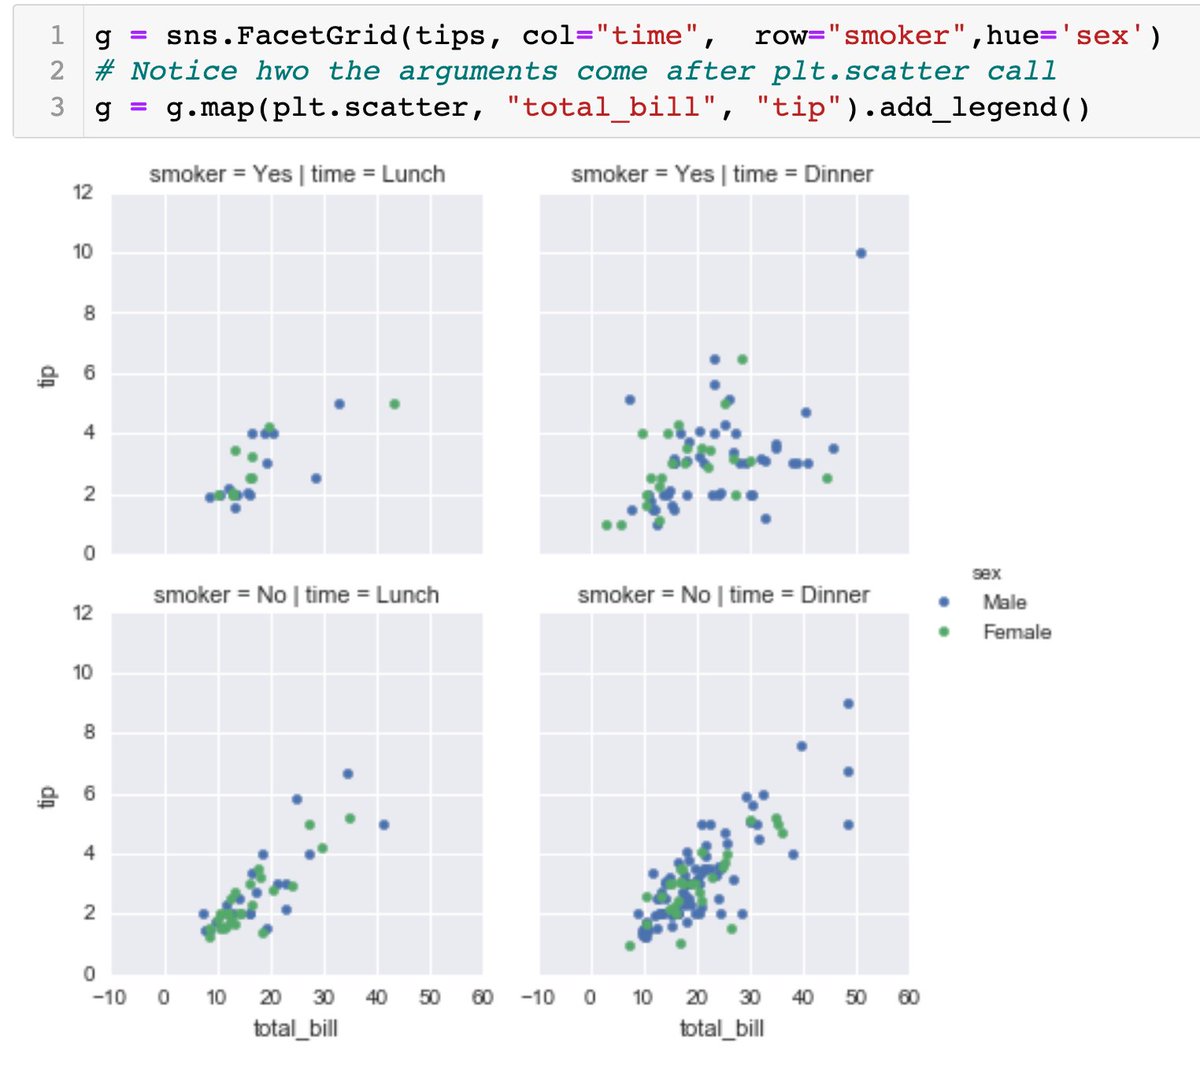
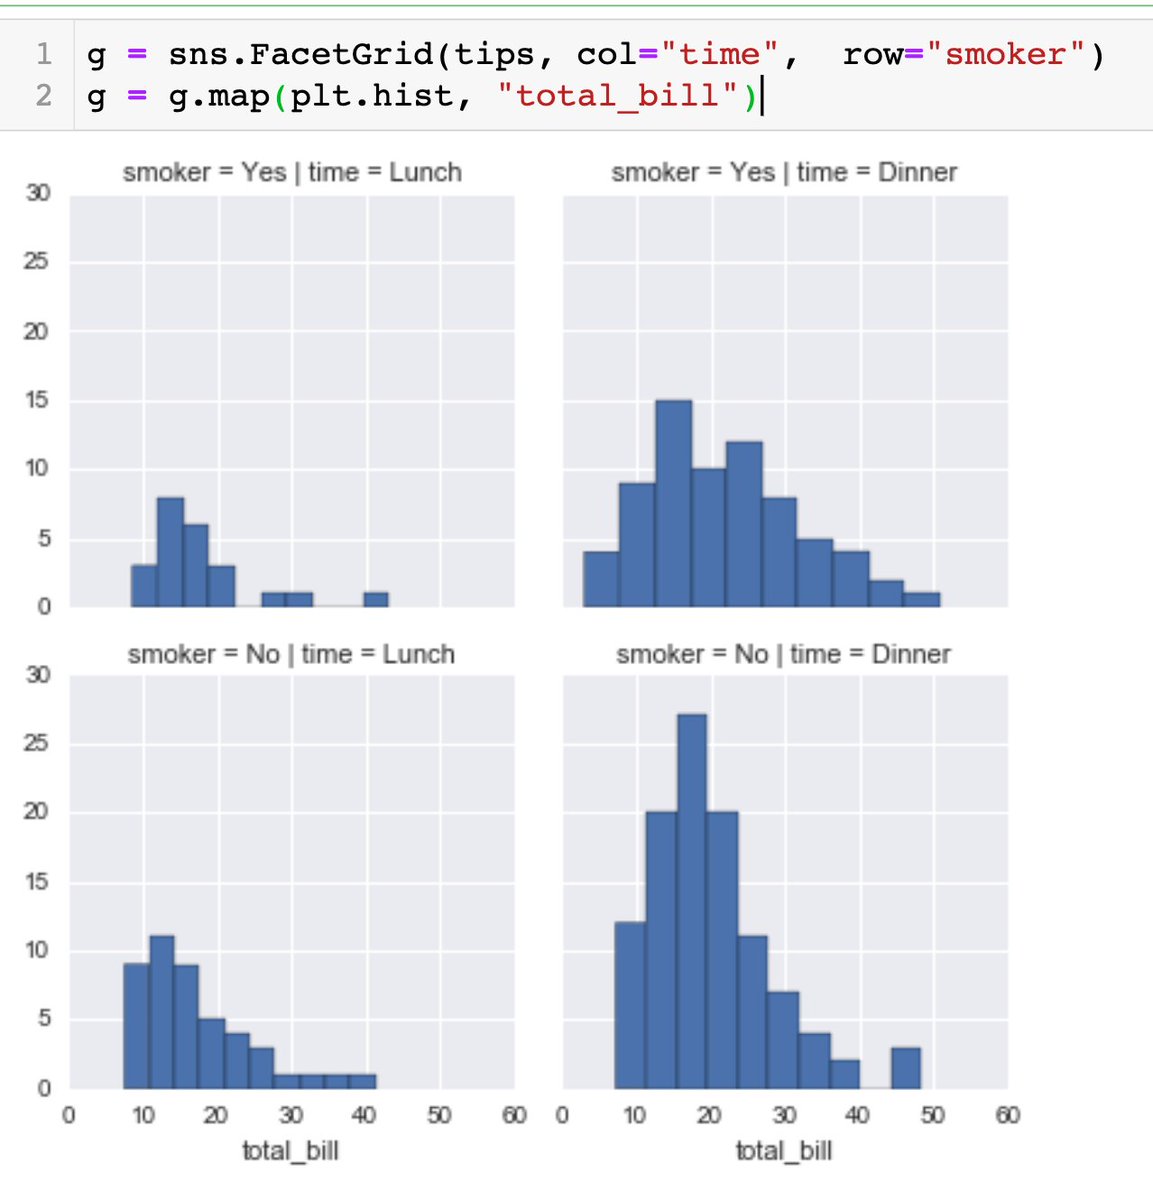
For FacetGrid, pass in the arguments according to the plot type.
g.map(plot_type, arguments_needed_for_the_plot_type)
Eg for scatterplot, 2 arguments needed:
2. FacetGrid - mapping a plot type and separating the results based on the column names (the variables you want to play around with)
eg row 1 represents smokers, row 2 represents non-smokers, and 1st column represents time=Lunch, 2nd column represents time=Dinner
#Day16 of #DataAnalytics#Seaborns
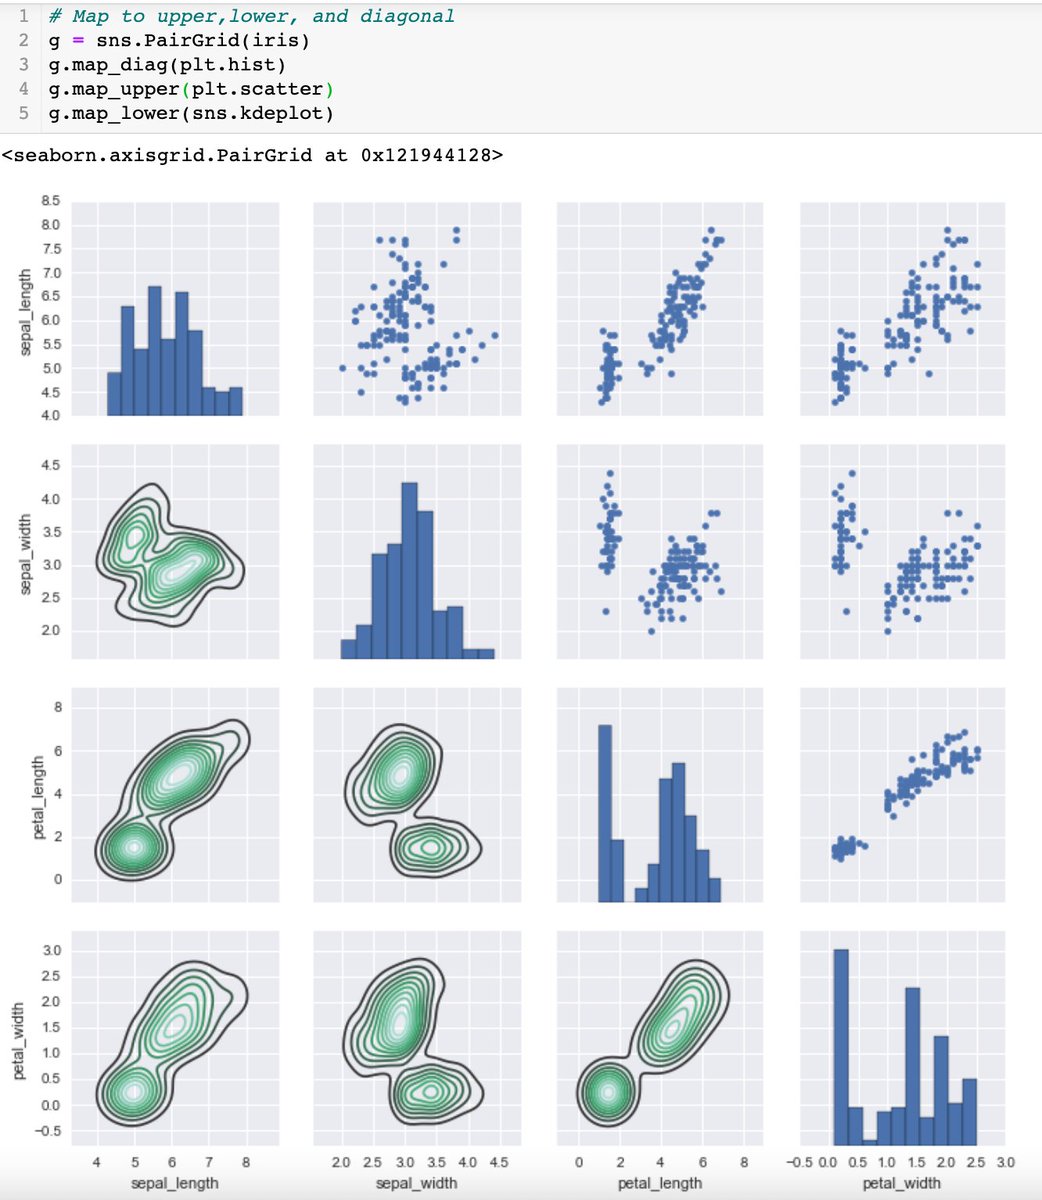
Grids are general types of plots that allow you to map plot types to rows and columns of a grid
1. PairGrid: similar to pairplot for plotting pairwise r/s but has more control over customisability of specific plots
#Day15 of #DataAnalytics#Seaborns
Place data in matrix form by .pivot_table()
.heatmap to plot data in color-encoded matrices.
annot=True for annotation of the values to be presented on the grid.
cmap to change color variation
VS .clustermap data grouped based on similarity
#Day15 of #DataAnalytics#Seaborns
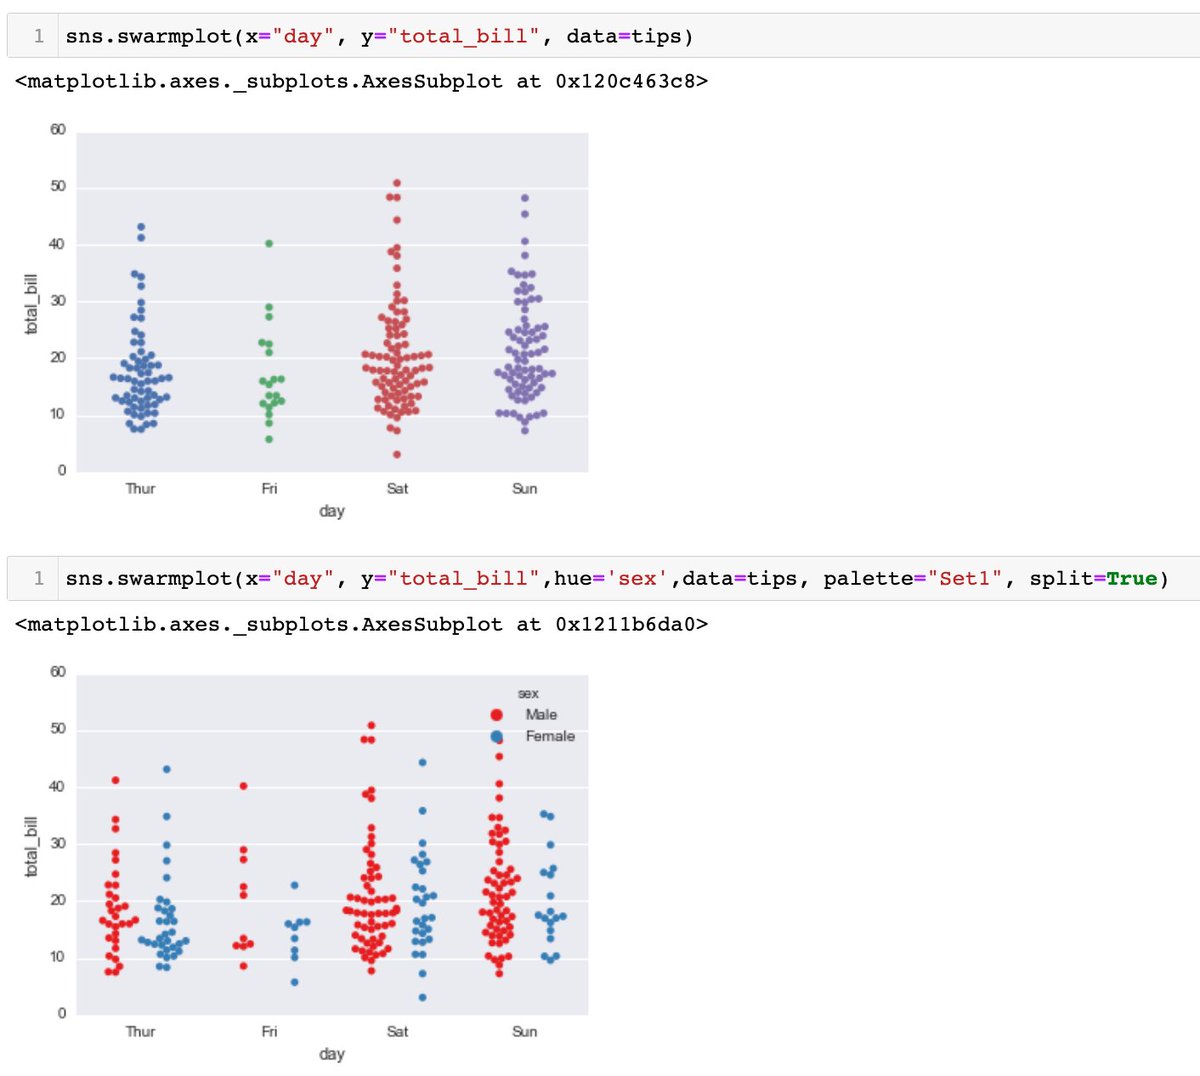
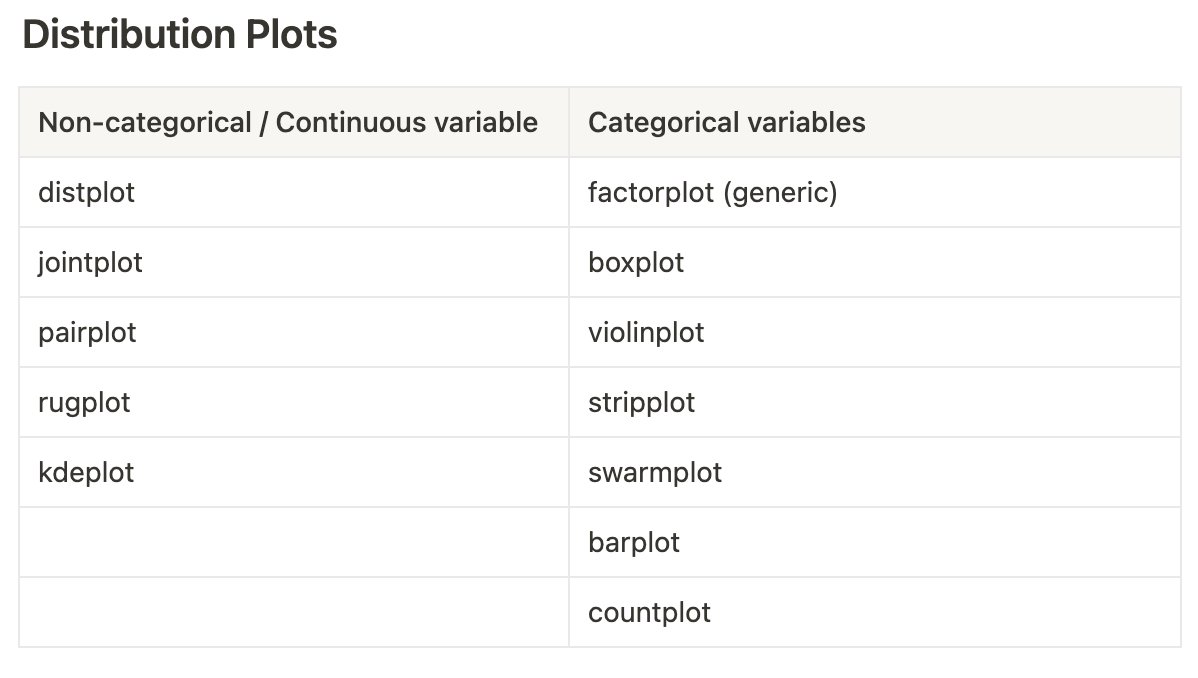
Categorical data:
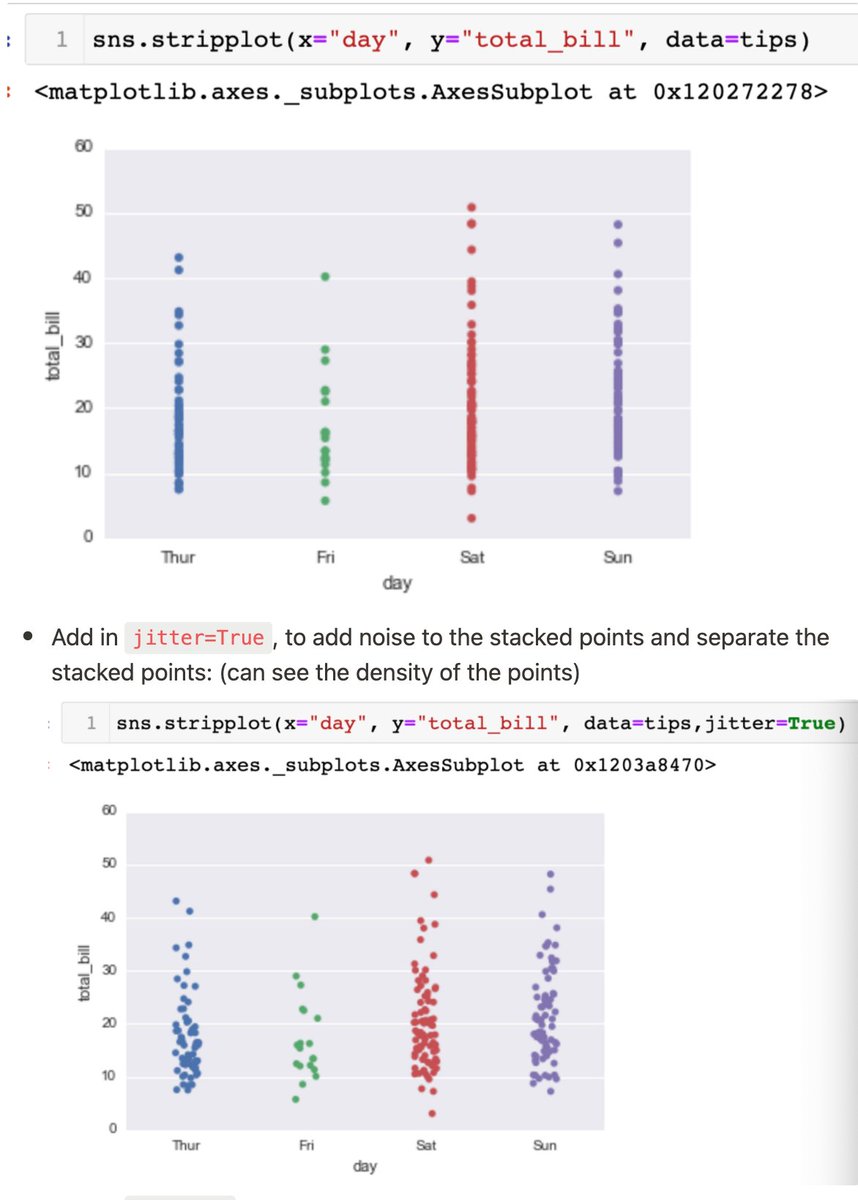
- stripplot (scatterplot, but points are stacked tgt. To separate it: jitter=True)
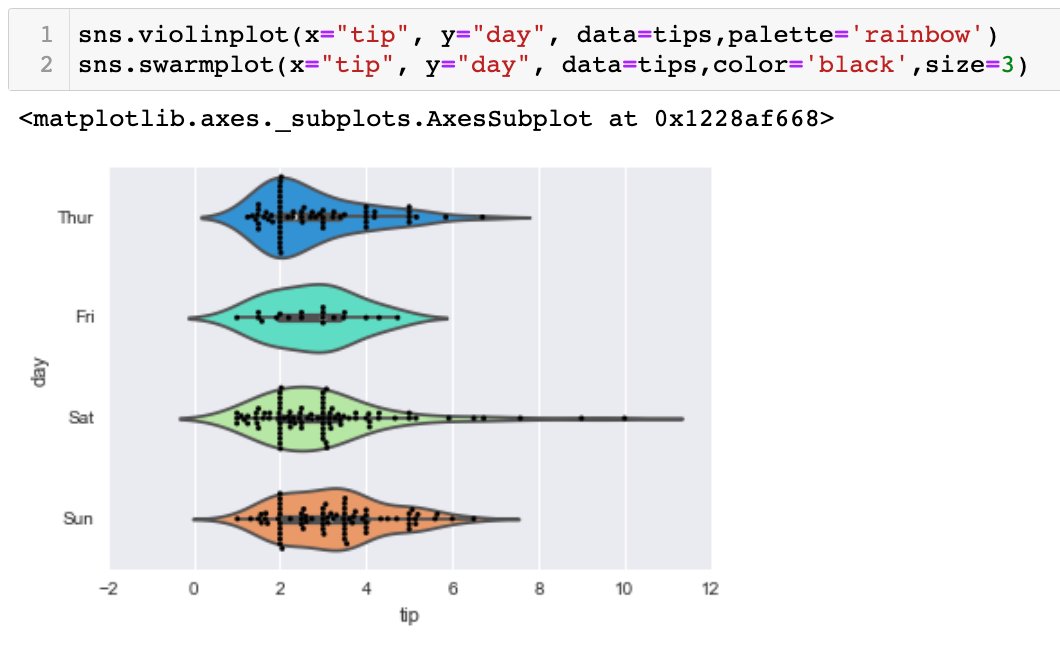
- swarmplot (similar to stripplot, but points are adjusted such that they don't overlap, and in the shape of violin. *can be combined tgt)
violinplot is similar to boxplot, but it features a kernel density estimation of the underlying distribution - harder to interpret but gives more information regarding distribution.
- possible to add a hue parameter
- split=True to combine 2 violin plots of same category into 1.
boxplot is a box-and-whisker plot that shows distribution of quantitative data, across the category. Adding a hue=' ' parameter allows the dataset to be split by another categorical column, eg distribution of total bill per day (1st cat), by smokers and non-smokers (2nd cat)
For categorical data, simplest generic form is the barplot. Default statistical function to estimate within each categorical bin is mean/average. Can change to other functions by changing 'estimator' parameter:
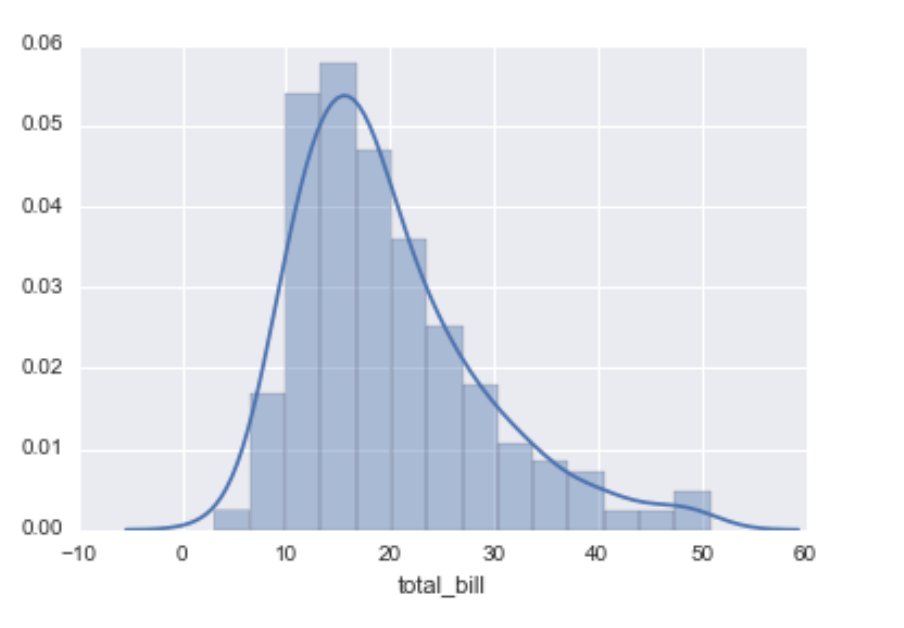
#Day14 of #DataAnalytics#Seaborns kdeplot - kernel density estimation. Idea is to replace each data point (represented by dashmark in rugplot) with a small Gaussian (Normal) distribution centered around that value, then summing the Gaussians for smooth estimate of the distributi
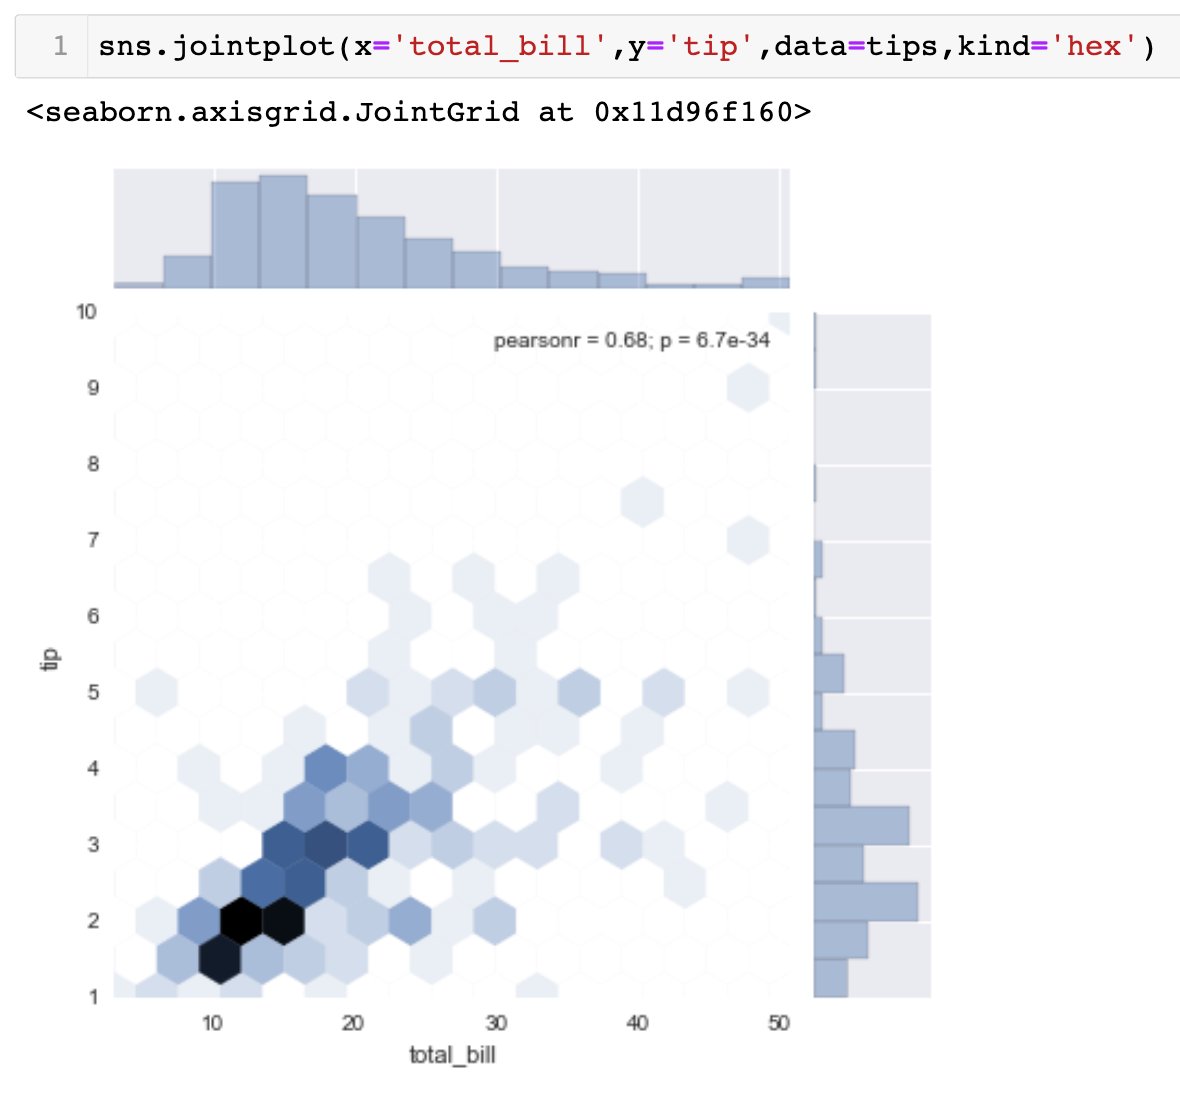
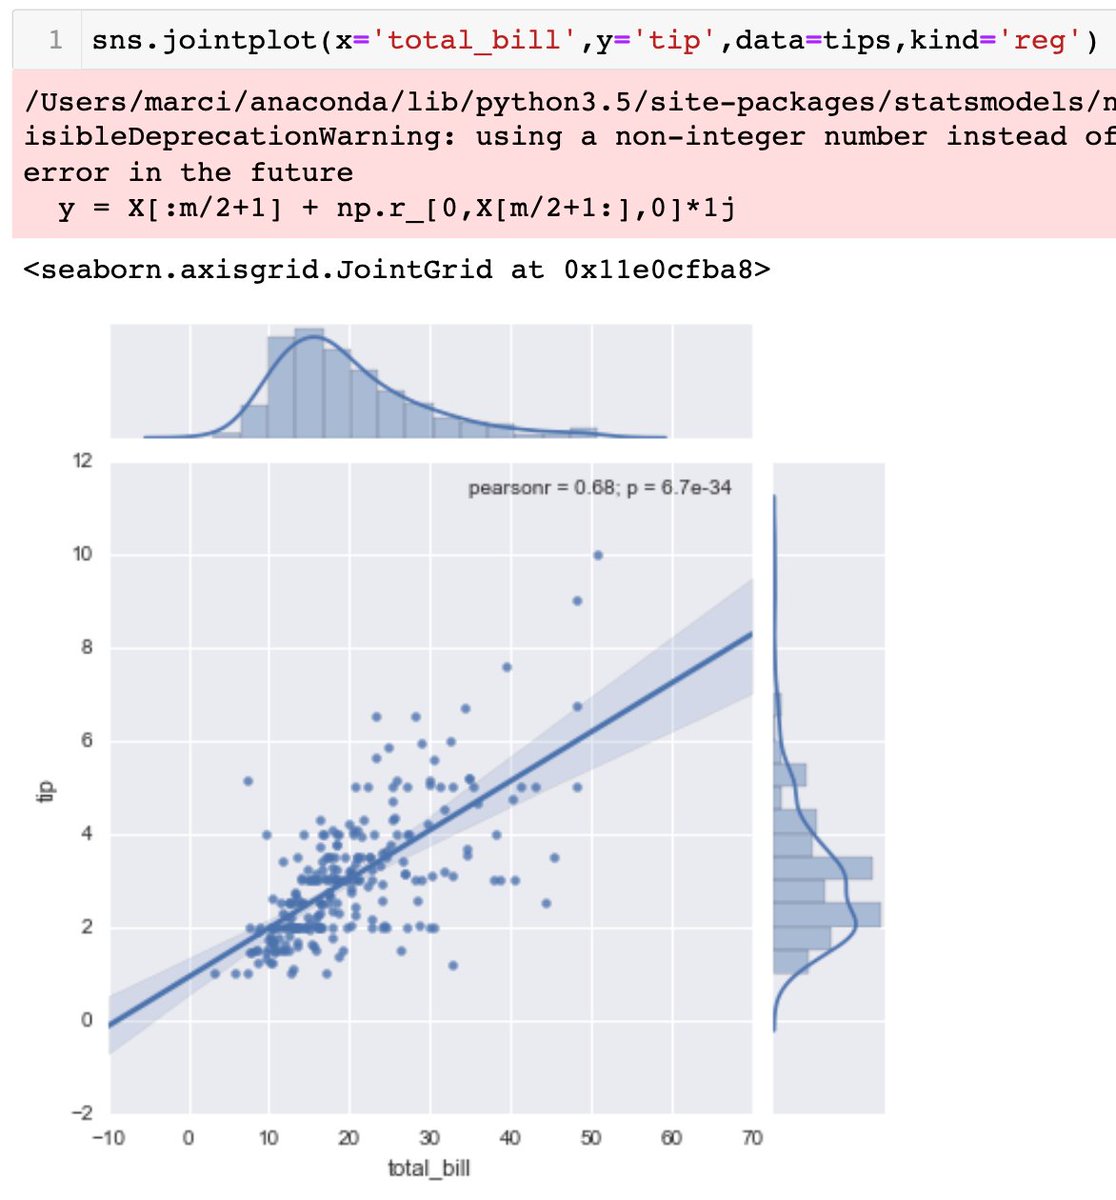
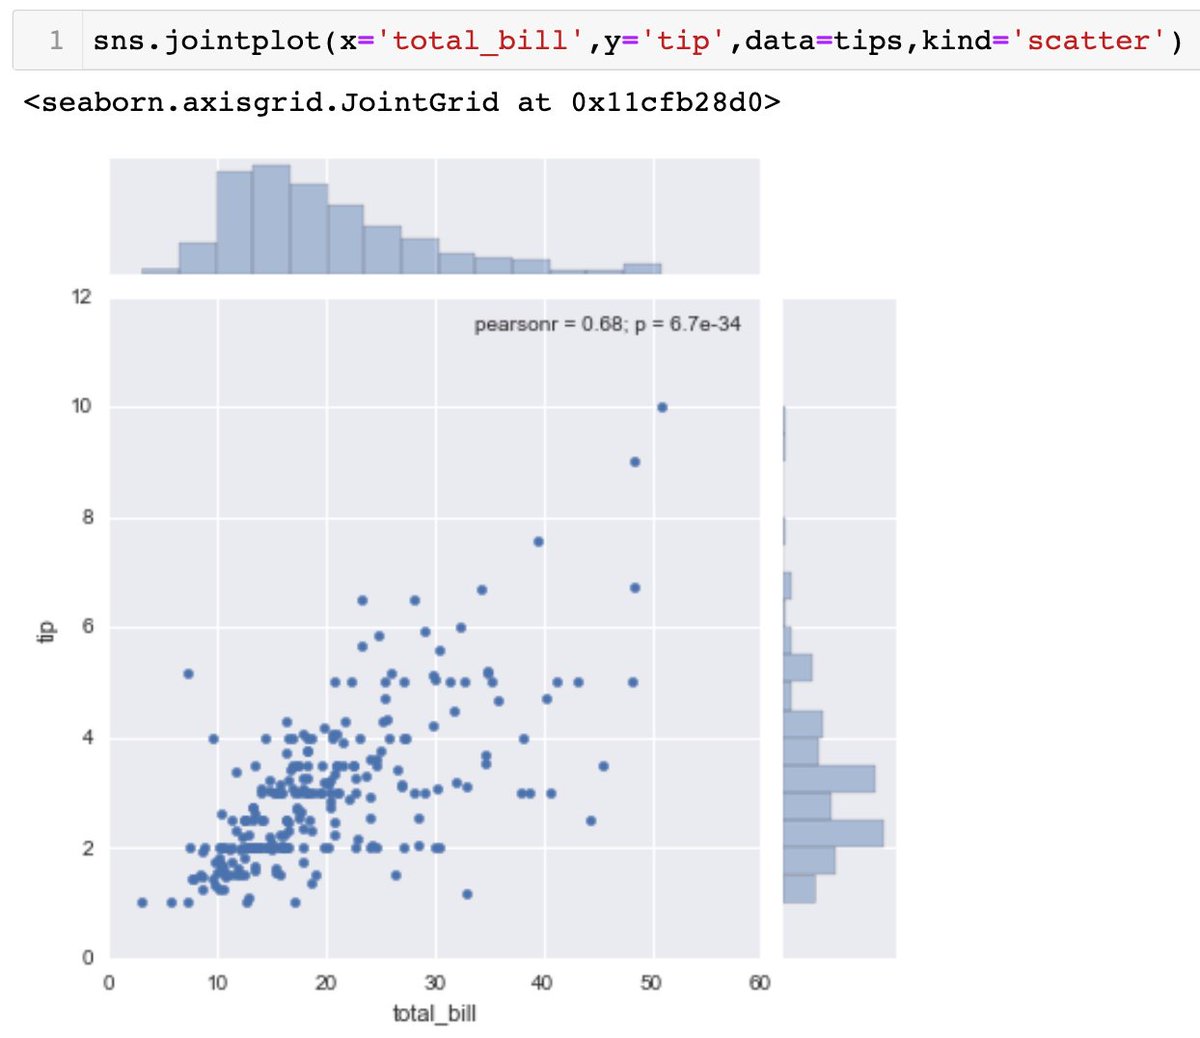
default for .jointplot is kind='scatter'. there is 'hex' for hexagonal distribution, 'reg' for regression line on top of scatter plot with pearson r value.
sns.pairplot(dataframe_name) will plot every pairwise relationships across entire dataframe (for the numerical columns)
#Day13 of #DataAnalytics#Seaborns another visualization tool, a popular statistical library.
- .load_dataset() for built-in datasets
- .distplot() shows a histogram/distribution of univariate data
- .jointplot(x='', y='', data=, kind=) to match 2 distplots for bivariate data
Lastly, to specify specific x or y axes values, you can configure the ranges of axis using .set_xlim([lowerbound,upperbound]) (meaning to zoom into specific axes range)
Adding a legend to the plot by specifying label=' ' in the method. (view pic)
Can specify the position of legend by: axes.legend(loc=n) where the numeric signifies a specific position (view documentation).
loc=0 to let matplotlib decide optimal location.
#Day12 of #DataAnalytics#Matplotlib
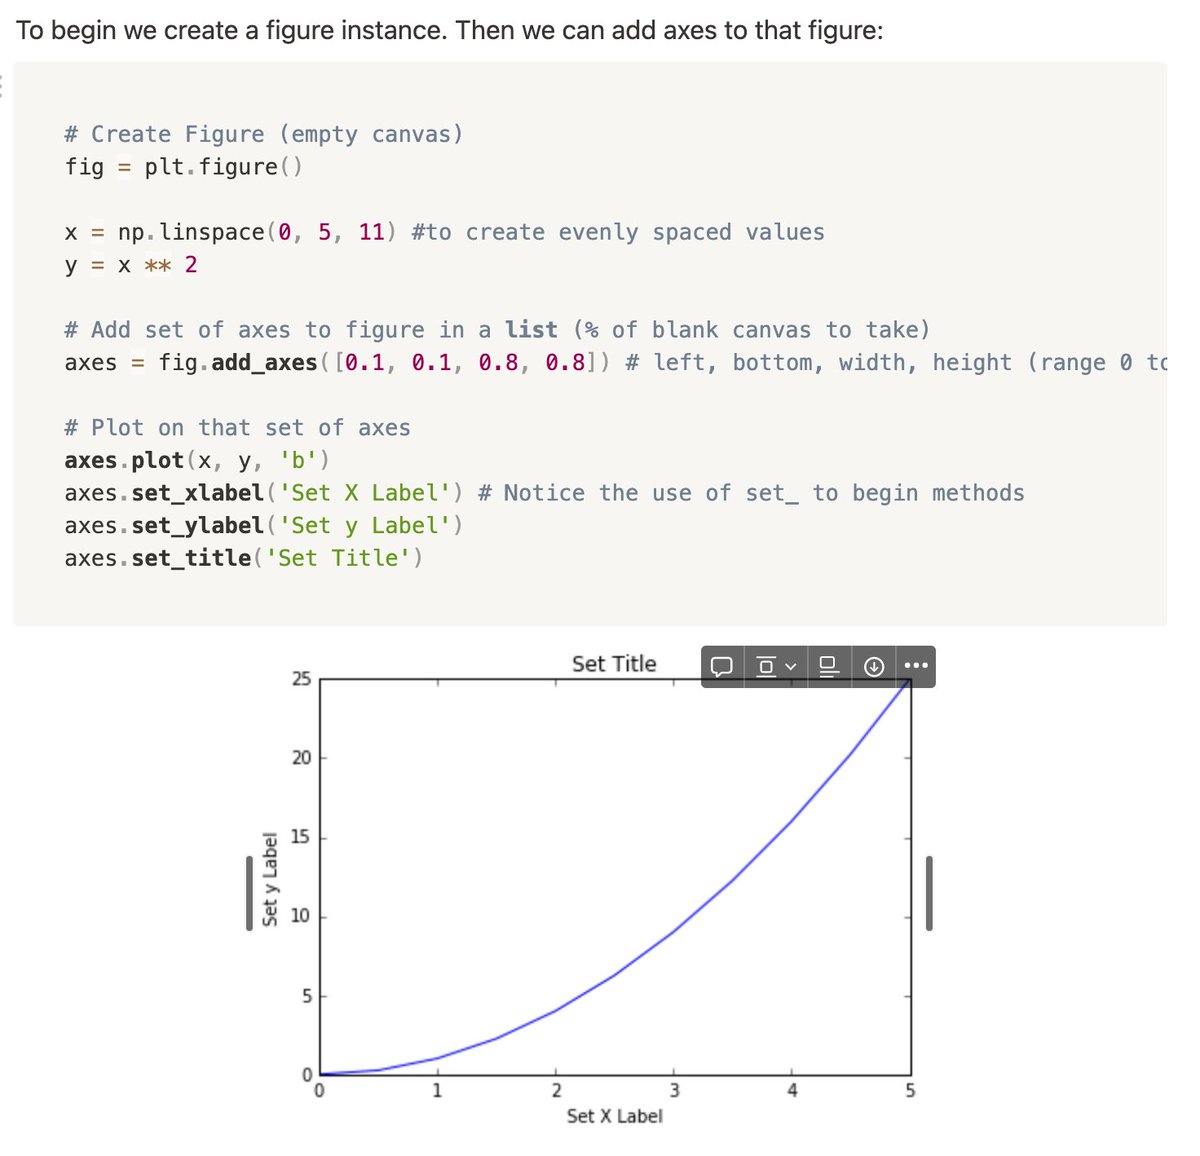
Creating figures through object-oriented method: create an empty canvas, then just call methods or attributes off of that object.
- plt.figure()
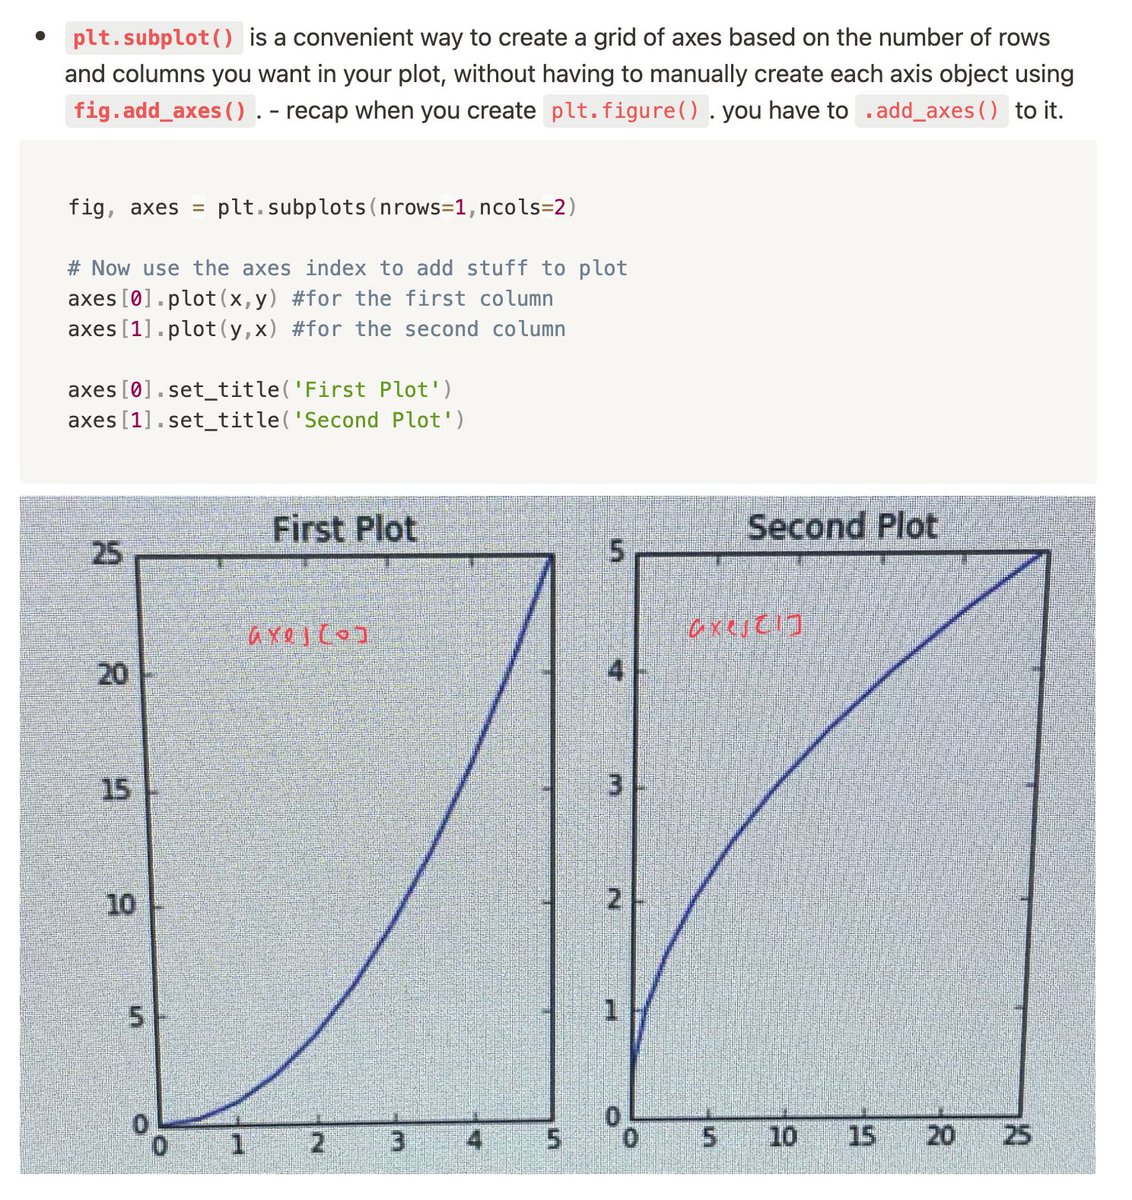
- plt.subplot(nrows=,ncols=)
#Day11 of #DataAnalytics
I'm struggling with #Matplotlib because my kernel keeps restarting/dying whenever I try to import matplotlib... this was the same problem I faced the previous time when I was learning this too...
#Day10 of #DataAnalytics
Started #Matplotlib visualization tool for Python!
View: #statistics" target="_blank" rel="nofollow noopener">matplotlib.org/2.0.2/gallery.… to see the whole list of figures that can be done + source code (eg statistical plots & scientific figures)
import matplotlib.pyplot as plt
%matplotlib inline
plt.plot()
#Day9 of #DataAnalytics
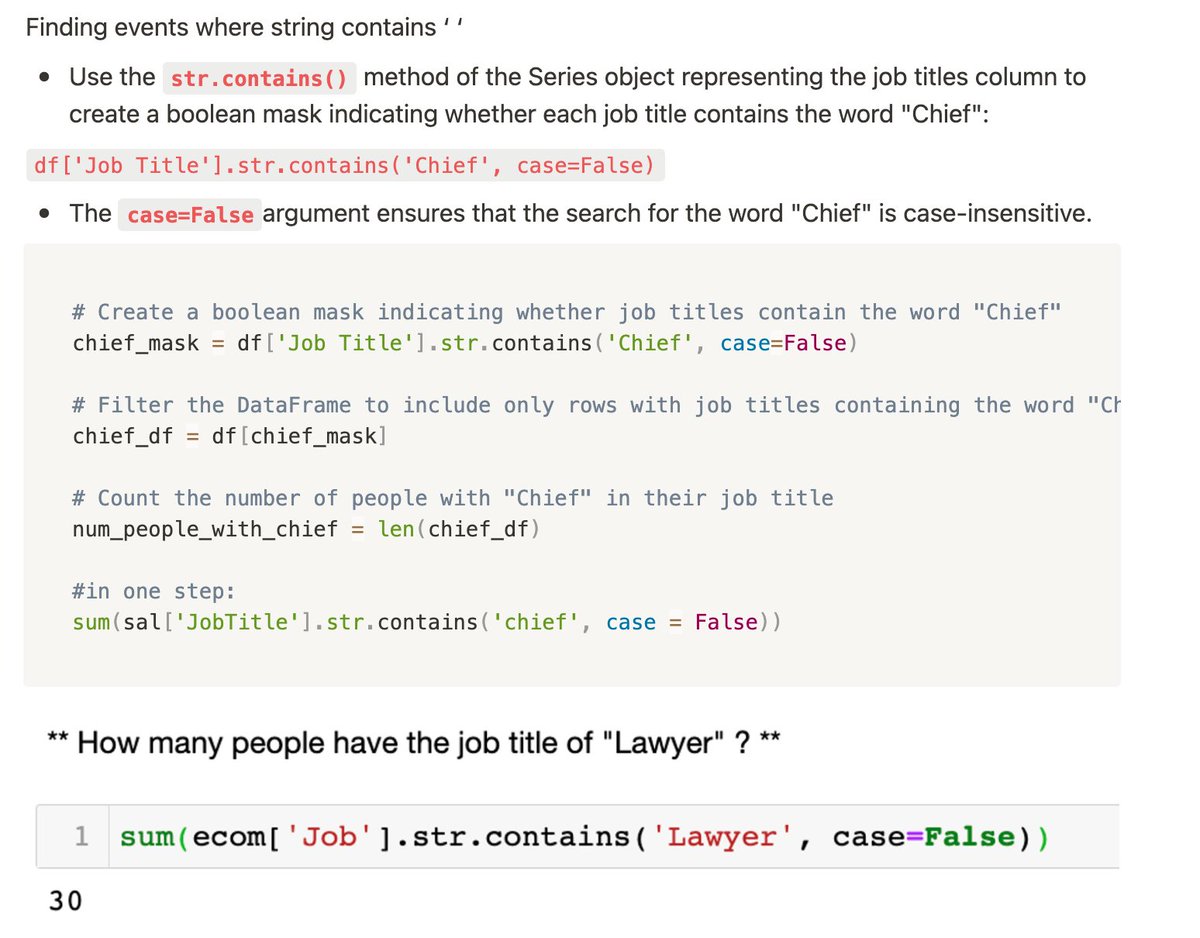
Finished a last section of learning #Pandas, and did extracting data with:
- str.contain(' ', case=False) to make it case-insensitive
- .head(n) to get the first n rows, usually paired with .value_counts
- len(df[’col2’].unique()) / df[’col2’].nunique()
.merge() for merging DataFrames based on values of specified columns, and handles overlapping data using how=' ' parameter. Default: 'inner', can change to outer/left/right
.join() mainly used for merging DataFrames based on the index rather than column values. Only inner join
#Day8 of #DataAnalytics#pandas
- .groupby(' ') similar to SQL syntax to group rows of data tgt and call aggregate functions eg .mean()
- .concat([ ]) pass in list of dataframes and join rows tgt. For columns, specify axis=1. (stacking vertically or horizontally)