@SoJustFollowMe How would you know, timing ahhh , nobody know
youtu.be/btPJPFnesV4?li…

YouTube
English
Mark Corbett
212 posts


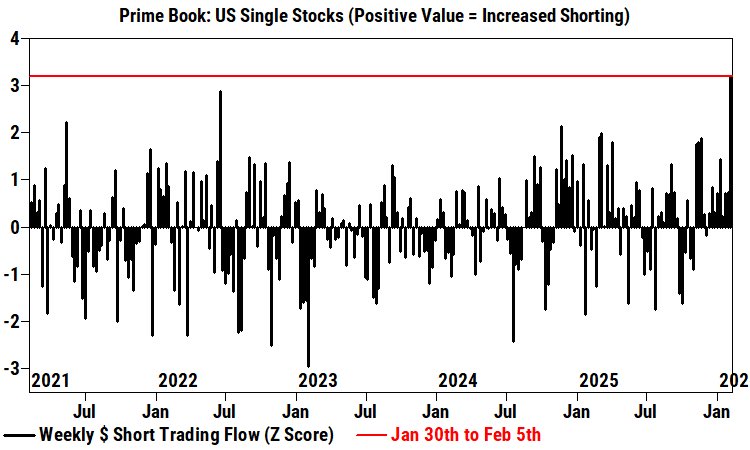
Yesterday I was asked about $SPX / #M2SL. While answering, it hit me – not everyone actually sees the essence of what I write. When was the first touch? January 12. Take high-risk assets like $NBIS, $APP, $HOOD, $SOFI – when did their corrections actually start? The second touch was January 27. Check the charts yourself for any asset you follow. We are now in a correction tied to a “two-touch” all-time high from 25 years ago. And I warned about this more than 3 months ago. Below are two pinned posts from January 12 and 27 – about the touch itself. Even further down are two November posts explaining the $SPX / #M2SL indicator. If you want to understand what’s happening, start there. Please be honest in the comments – did you read all four posts before? Is the content difficult? First – even when I explain things as simply as possible, the subject itself is comparable to open-heart surgery. By definition, it can’t be easy. Second – the problem isn’t how I explain it (I almost convinced myself it was). The problem is that many simply aren’t familiar with the underlying material. You don’t build a skyscraper starting from the 14th floor. You start with the foundation. Everything you need for that foundation is in the pinned post. Missed it? Time to catch up.
@jcrizane We considered this possibility as well. But the point is that these data are revised both monthly and annually and historically such revisions have never led to changes in the chart.


FED MOVES, YOU SNOOZE While most investors were guessing about the key rate, the #Fed quietly shrank its balance sheet – selling and redeeming assets it had piled up over the past 5 years. October: balance down to $6.6T from a record $9T at the start of 2022. Adjusted for GDP, back to April 2020 levels. ‼️ Remember this – it’ll help you understand the mechanics behind the process in my Saturday post about the #AI Bubble Crash.‼️ Comparison: Fed assets = 22% of GDP (lowest among major economies). The Bank of #England ~25%, #China 34%, #ECB ~40%, #Japan ~110%. WHY IT MATTERS Fed expanded its balance sheet buying government bonds to support banks and boost lending. Side effect: excess liquidity pushed up asset prices – even those the Fed didn’t buy: stocks, real estate, crypto. Now, shrinking the balance = less liquidity → pressure on prices. So far, we don’t see it because everyone’s hyped about possible rate cuts. $SPY $QQQ $SMH $MAGS $DIA $IWM $IEF $TLT
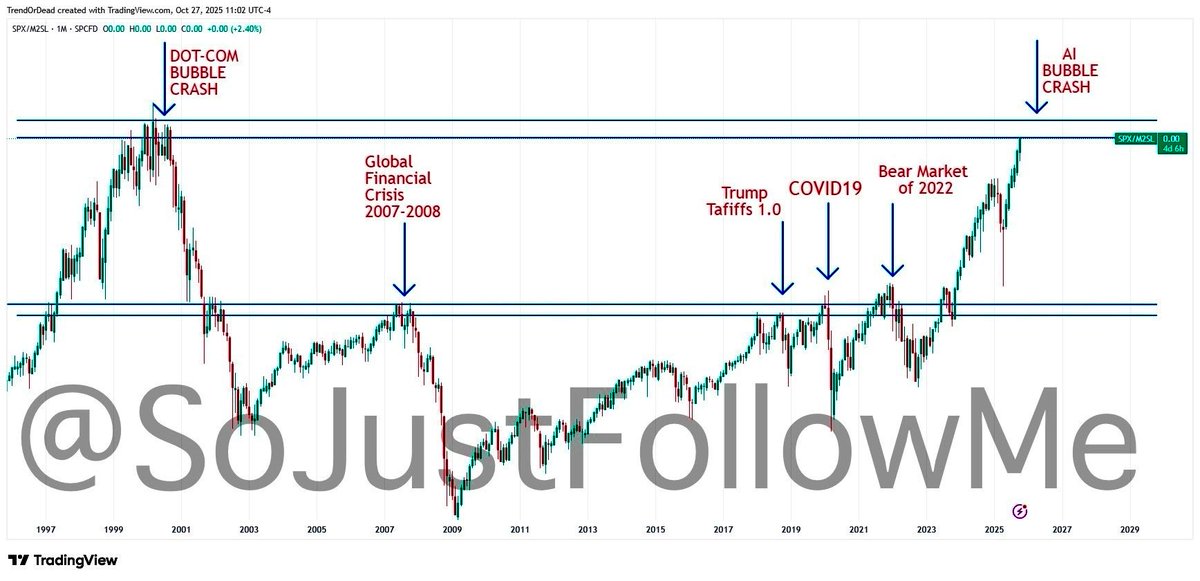
Tech Stocks relative to M2 Money Supply 🚨 Dot Com Bubble vs. Now 🤯👀