Sabitlenmiş Tweet

CryptoUltronOfficial
2.3K posts

@crypto_ultron
“Scalp. Swing. Conquer. Daily BTC/ETH/XRP trade setups Trade like Ultron — calculated, cold, & clean.” #Bitcoin #XRP #Altcoins


Bonus chart: ✅ Elliott Wave Count — #BTC Macro Structure Here’s the breakdown 👇 🧠 Structure (1) → First impulsive leg from ~15.5K → ~69K. Strong volume, no overlap, clean RSI breakout — classic start of a new macro cycle. (2) → Deep correction into ~15.5K. Tagged the 0.702–0.786 zone perfectly. Sharp structure = fits the “alternation rule.” (3) → Major impulse from 15.5K → 126K. Longest and strongest leg, RSI confirmed power (never lost 40). That’s textbook Wave 3 behavior. (4) → Ongoing correction from 126K → 102K. Still above Wave (1) top (69K) → no overlap ✅ Sideways-to-sharp structure opposite of Wave 2 → perfect alternation ✅ Tagged 1.618 extension (~102K) → ideal reaction zone. (5) → Next phase: final impulse leg forming. Targets: • 2.272–2.382 Fib = 137K–155K • 3.618 extension = 209K (max blow-off potential) 🧩 Summary • Count follows all Elliott Wave Monitor rules (no invalidation). • RSI + structure align perfectly with a completed Wave (4). • Macro trend still intact — BTC likely gearing up for its final Wave (5) extension toward 137–155K+ 🚀 📈 TL;DR RSI showing lower lows? Don’t panic. This is Wave (4) cooling off, not a macro breakdown. As long as RSI holds above 40, it’s just a momentum reset before Wave (5) launch. Break below 40 = red flag. Hold & curl up = rocket fuel. 🚀 As always — don’t blindly follow me, I just read the chart 😉 #BTC #Bitcoin #ElliottWave #CryptoUltron
🧠 Bitcoin 2W Chart — Before vs After Close The beauty of structure 📊 — nothing random here. 🧠 Posted on Oct 23: “RSI floor rising — momentum reloading at key trendline. Flat 20 EMA ($97K–$103K) = cycle guardrail.” ⚙️ Today (Oct 28): * RSI floor ✅ still rising — no breakdown. * 20EMA (~$97K–$103K) ✅ defended again — cycle backbone intact. * We’re now 8 bars into the cooling phase, right inside historical symmetry #BTC #CryptoUltron #Bitcoin


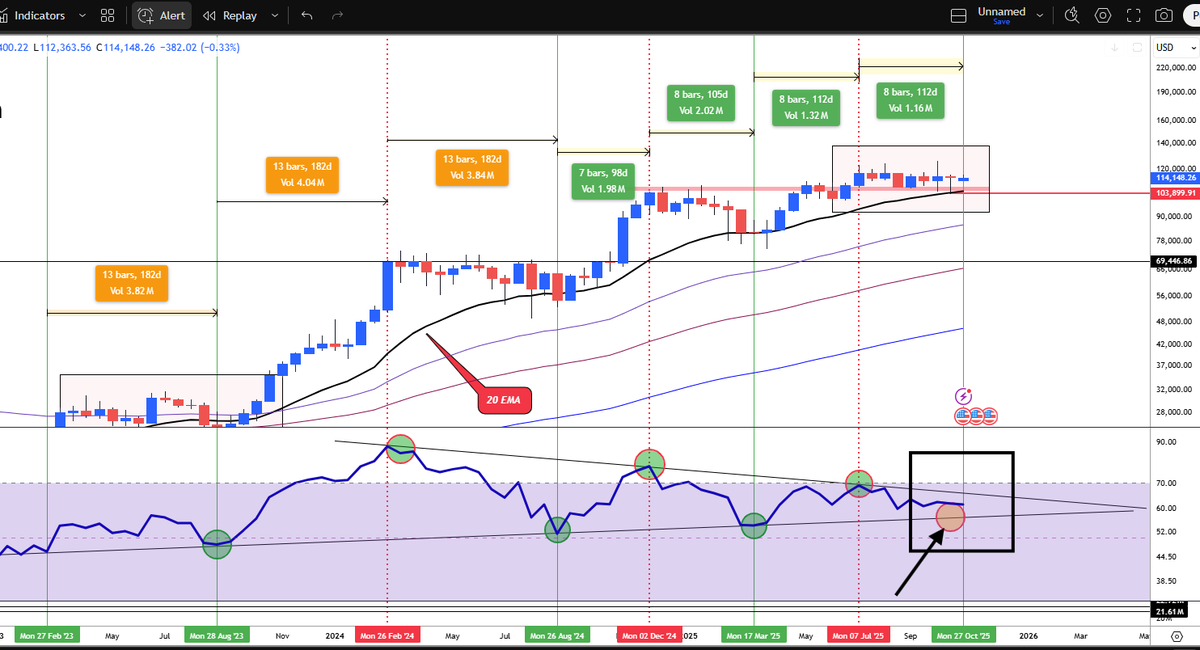

🔑 #Bitcoin 2W Chart—Key Observations 📈 RSI Floor Rising Momentum keeps resetting higher — every dip reloads without breaking structure. Hidden strength building under the surface. 🧭 Flat 20 EMA ($97K–$103K) → cycle guardrail. Holding above = trend intact. Lose it = macro cooling. ⏱️ Time Symmetry = Market Rhythm Every BTC expansion cycle so far: → ~13 bars of compression before a new ATH → ~7–8 bars of cooling before the next leg We’re exactly 7 bars into this correction, sitting right at the key RSI trendline — the same support that launched every prior expansion wave. ⚡ If rhythm repeats → BTC is nearing the next breakout inflection. Stay patient, structure is doing its job. #BTC #CryptoUltron
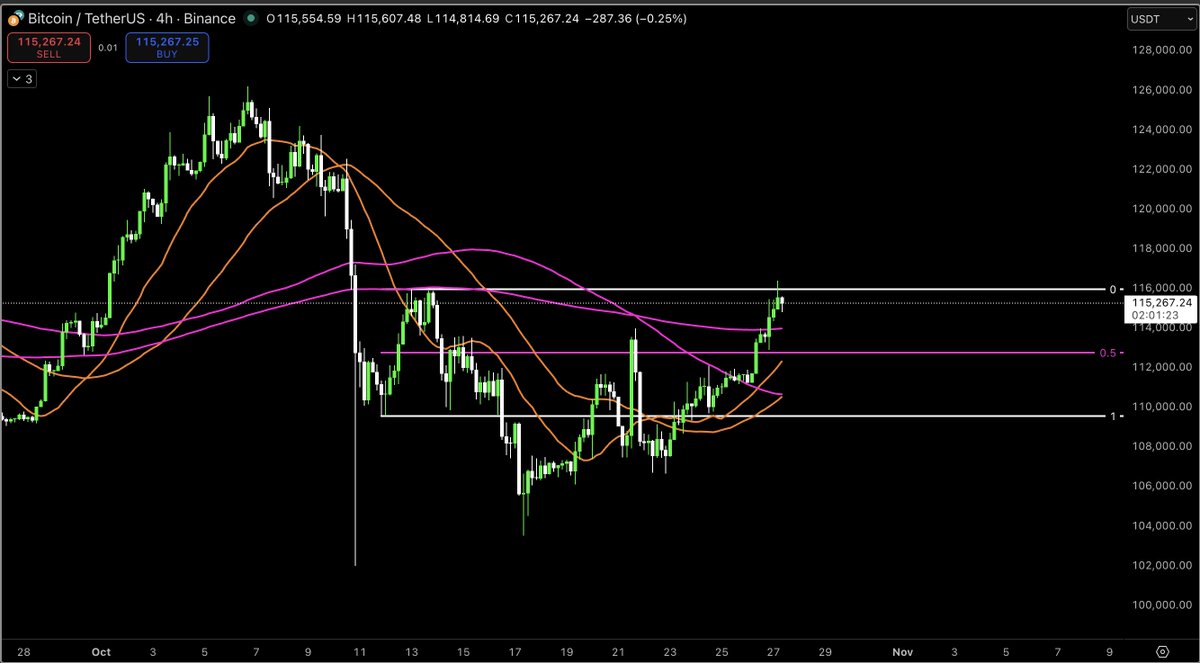
⚡️ BTC Market Plan: Oct 27 — Execution --> Extension The Oct 20 Roadmap Complete. Time to Reload. ⸻ 🔄 The previous plan (Oct 20) was executed flawlessly: BTC reclaimed 113.5K and pushed toward 115.4K. Trend Status: The Weekly candle closed strong, reclaiming the EMA cluster (111K–114K). Bullish trend is repaired; momentum is restored. Trade Profit: Spot/Swing positions initiated in the 108K–110K zone are now sitting at a healthy +4% to +10% profit—exactly following the liquidity sweep → reclaim → expansion model. ⸻ 🧭 Structure (multi-TF read) • Weekly candle green above EMA12/20 (113 – 114 K); buyers in control. • 3D engulfing reversal off 102.5 K → EMA ribbon reclaim → momentum curling up. • Daily MACD bullish cross ✅ RSI ≈ 69 = trending but hot. • 4H/12H RSI high 80s → expect short pullback to 114.2 – 113.5 K before next push. • 1H/15m cooling → micro double-top at 115.4 K resetting oscillators. Summary = bullish but overextended. Healthy retest first → then 116 – 118 K extension. ⸻ 🕒 Timeline • Monday–Tuesday → pullback window 113.5 – 114 K. • Tuesday–Wednesday → attempt toward 116 – 118 K. • Weekly close > 116 K → momentum expands → 120 K next. ⸻ 🧠 Summary BTC executed the Oct 20 roadmap to the dot — liquidity sweep, reclaim, and push up. Trend remains bullish but short-term hot. Base case = controlled dip to 114 K zone → continuation 116 – 118 K. Only invalid if D close < 111.8 K. Stay patient, trade edges, don’t chase middles. 🎯 Execution map ← Read below the next post As always — don’t blindly follow me 😉 I just read the charts. Smash that ❤️ Like & RT, and make sure to follow to keep this energy going! #CryptoUltron ⚡
⚡️ BTC Market Plan: Oct 27 — Execution --> Extension The Oct 20 Roadmap Complete. Time to Reload. ⸻ 🔄 The previous plan (Oct 20) was executed flawlessly: BTC reclaimed 113.5K and pushed toward 115.4K. Trend Status: The Weekly candle closed strong, reclaiming the EMA cluster (111K–114K). Bullish trend is repaired; momentum is restored. Trade Profit: Spot/Swing positions initiated in the 108K–110K zone are now sitting at a healthy +4% to +10% profit—exactly following the liquidity sweep → reclaim → expansion model. ⸻ 🧭 Structure (multi-TF read) • Weekly candle green above EMA12/20 (113 – 114 K); buyers in control. • 3D engulfing reversal off 102.5 K → EMA ribbon reclaim → momentum curling up. • Daily MACD bullish cross ✅ RSI ≈ 69 = trending but hot. • 4H/12H RSI high 80s → expect short pullback to 114.2 – 113.5 K before next push. • 1H/15m cooling → micro double-top at 115.4 K resetting oscillators. Summary = bullish but overextended. Healthy retest first → then 116 – 118 K extension. ⸻ 🕒 Timeline • Monday–Tuesday → pullback window 113.5 – 114 K. • Tuesday–Wednesday → attempt toward 116 – 118 K. • Weekly close > 116 K → momentum expands → 120 K next. ⸻ 🧠 Summary BTC executed the Oct 20 roadmap to the dot — liquidity sweep, reclaim, and push up. Trend remains bullish but short-term hot. Base case = controlled dip to 114 K zone → continuation 116 – 118 K. Only invalid if D close < 111.8 K. Stay patient, trade edges, don’t chase middles. 🎯 Execution map ← Read below the next post As always — don’t blindly follow me 😉 I just read the charts. Smash that ❤️ Like & RT, and make sure to follow to keep this energy going! #CryptoUltron ⚡

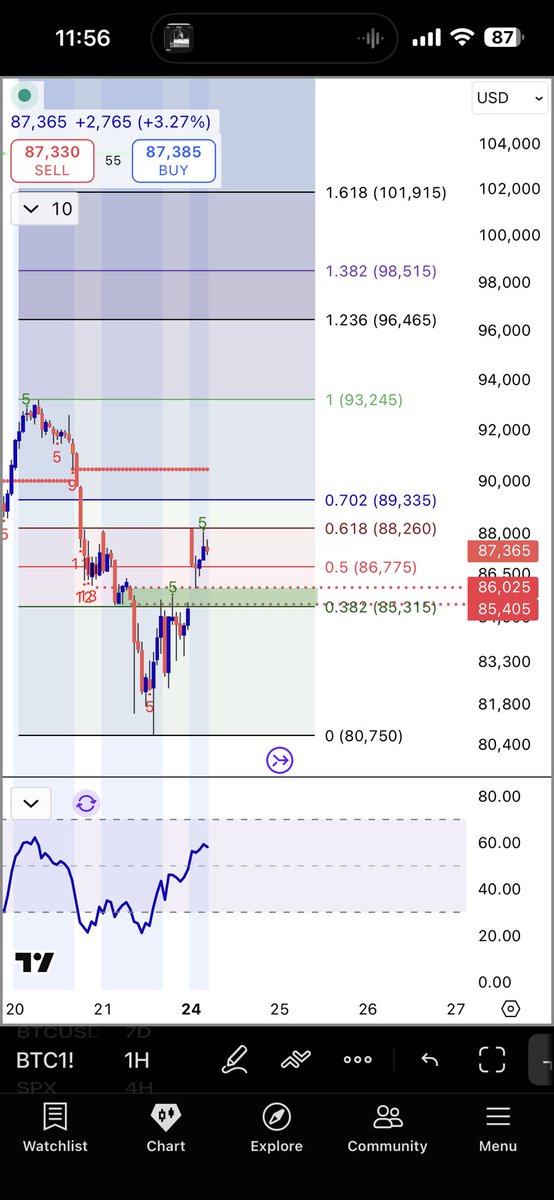
A big week ahead for crypto. $88-92k would bring in some pain. - Wynn
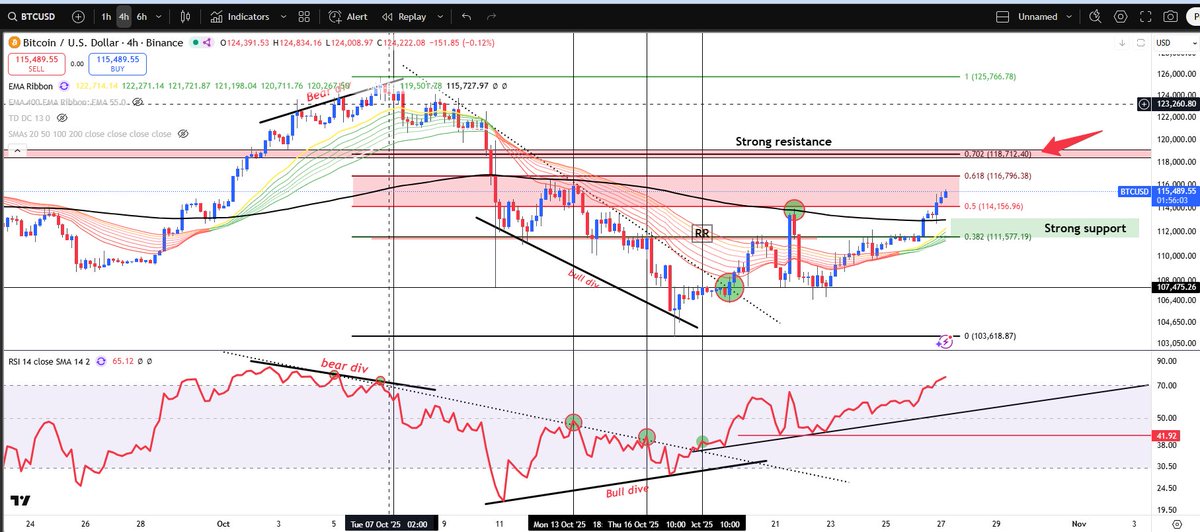
✅ BTC Market Update & Plan — 20 Oct (continuity from Oct 11) ⸻ 🔄 Since the Oct 11 update (what actually happened) •Plan said: reject 115–116K → 109/105/102.5K sweep risk; reclaim ≥116K for squeeze. •We rejected 116K, flushed to 103.5–102.5K (3D/1D wick confluence), then mean-reverted back to 111–112K. •Currently trading around 111.1–111.3K, testing the underside of 4H/1D EMA cluster. Still below heavy daily EMAs (EMA20 ≈ 113K, EMA50/60 ≈ 114K) → bounce into resistance, not a confirmed trend flip. 🧭 Structure •BTC reclaimed short-term structure but still below daily EMA 20–50 (113–114K). •Until we close >114.2–116K, it’s a relief rally inside resistance, not trend continuation. 🧩 Scenarios (probabilities) Base case (55%) — Range repair •Ping-pong between 110.4–113.5K. •First probe into 111.6–112.2K likely fades; if momentum holds, 113.3–114.2K gets tagged then rejected on first touch. Bear extension (25%) — One more downside sweep •Acceptance <111K → quick tag of 110.0/109.7K. •Lose 109.7K with volume → 108.7K → 107.6K liquidity sweep. Max pain retest 105–102.5K if daily closes weak. Bull reclaim (20%) — True squeeze •Daily close ≥113.5K = first reclaim (early long). •Daily close ≥114.2–116K with OBV uptick = trend continuation → 118.2 → 120 → 123–124.6K. ⸻ 🎯 Execution Map Spot / Swing Longs (continuity from Oct 11, adjusted) •Bid ladder: 110.4–109.7K → 108.7K → 107.6K. •Add-on: 105.8–105.0K → 102.5K (final). •Invalidation: Weekly close <101K (macro), Daily close <107.6K (tactical). Tactical Shorts (fade the underside) •Entry 1: 111.6–112.2K → Stop: 4H >112.6K / D >113.5K → Covers: 110.4K → 109.7K → 108.7K. •Entry 2: 113.3–114.2K (EMA cluster) → Stop: D >114.2–116K → Covers: 112.0 → 110.0 → 109.0K. Breakout Longs (confirmation only) •Trigger A: D-close ≥113.5K + OBV uptick → starter long. •Trigger B: D-close ≥114.2–116K → full risk-on → 118.2 → 120 → 123–124.6K. •Invalidation: fall back inside 113K with weak OBV → exit/retry lower. Scalps •Fade 111.9–112.2K (stop 0.4–0.6% above) → target 111.0/110.4K. •Buy 109.7–110.0K sweep (stop 0.5–0.7% below) → target 111.0/111.8K. ⸻ ⚖️ Risk management •Keep leverage light inside 110–114K range. •Trade edges, not the middle. •Cut early on structure invalidations (4H >112.6K or D <107.6K). •Re-add only on liquidity sweeps or confirmed reclaim (>113.5K). ⸻ 🕒 Timeline •Daily close: >113.5K = opens door to 114.2–116K. Rejection under 112.2K = keeps bias to downside sweeps. Sunday night: market pumps or recovers (low liquidity) •Monday U.S. open: volatility spike → dump retrace before new direction If that pattern repeats, expect 111.6–113.5K to be the trap zone for another short-term fade before any real continuation. 🔄 Bias flip triggers •Bullish: D-close >113.5K + OBV uptick + thinning sell walls at 114K+. •Bearish: D-acceptance <111K or rejection at 112–113K with lower highs → opens 109–105K range. ⸻ ✅ Summary That dump was a liquidity hunt, not a structural break. BTC recovered from the 102.5K sweep and is now retesting resistance at 111–113K. Until 114.2–116K is reclaimed, treat this bounce as a range repair, not breakout.