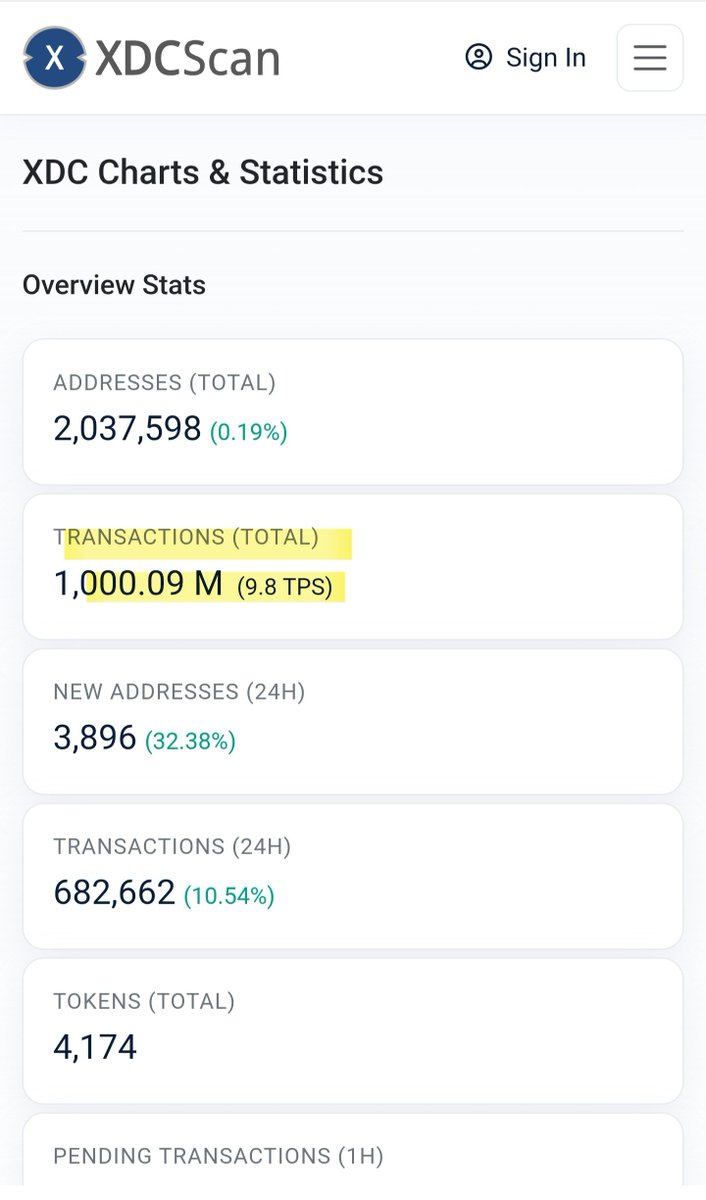

#XDC - $1 Then $2 Easy (The RGB Chart & More!) THIS POST WAS Originally Exclusive for Subscribers, but I don’t want many of you to miss out on this incredible opportunity. The #XDC chart looks AMAZING so far! 📊✨ Section 1: RGB (Red-Green-Blue) – The Visual Indicator🟥🟩🟦: ▫️It doesn’t require a TA guru to see how #XDC and the RGB circle are perfectly aligned—teeth-to-teeth matching! ▫️The previous cycle's white square and this cycle show a 60% drop, plus some discrepancies. If I’m right—and I believe I am—the next move could be a 10X pump (a massive 1000% increase). 🚀💥 ▫️Targeting between Fibonacci levels 1.414 and 1.618 — roughly $0.50 to $0.80. ▫️This is still below the previous cycle's blow-off top, which soared by 3,350%! 📈 If history teaches us anything, #XDC could replicate the same explosive move, potentially pushing toward $2+! 🎯🔥 Section 2: SRSI – Bullish Signals Ahead ▫️The SRSI is waving bullish signals! 🌟 ▫️We still have a long road to reach and sustain RSI levels above 80, but the momentum is definitely on the bulls’ side. 📈🐂 ▫️Big moves could be just around the corner for ! Section 3: 21 EMA & 33 MA – Watch Closely ▫️The 21 EMA is on the verge of crossing below the 33 MA. If that happens, it could turn super bearish. ⚠️ ▫️But most likely, this crossover will be avoided, and we could see a blow-off top before the inevitable retracement. ▫️When everyone’s asleep at the wheel, the market often slaps everyone with a sharp move higher… then comes the big crash! 💥🚨 Are you ready? Because I sure am. Here I come! 🚀🔥