Sabitlenmiş Tweet
MTA
13.8K posts


MTA retweetledi


MTA retweetledi


MTA retweetledi

This is exactly what I told you would happen.
S&P 500 just hit $7,538, a new all-time high.
Amid the worst geopolitical crisis of the century.
Oil is at $94.
The Strait of Hormuz is blockaded.
The US has already begun the next round of war escalation.
Nothing has been solved.
No real objectives have been achieved.
The escalation is only getting worse.
And the market is rallying into it.
I’ve seen this before.
When equities rally during an unresolved energy shock, the drop that follows isn’t slow.
It’s vertical.
Reminder: I’ve called all the market tops and bottoms for the last 15 years, including the Bitcoin bottom at $16,000 and the top at $126,000.
The next call will be even more important.
When I exit the markets completely, I’ll post it here publicly like I always do.
Turn notifications on. If you’re not following yet, you’ll understand why that was a mistake later.
English
MTA retweetledi

MTA retweetledi

best accounts to follow from each frontier lab to stay constantly up to date
Anthropic
@karpathy - must-follow account for AI; recently joined Anthropic
@bcherny - Claude Code creator, always shares great tips
@trq212 - also a Claude Code developer; writes amazing articles on CC
OpenAI
@polynoamial - works on reasoning research, shares a lot of technical details
@gabriel1 - Sora developer, great career path
@jxnlco - works on dev experience, shares a lot about Codex
Google AI
@OfficialLoganK - all the major Google Gemini and AI Studio updates
@ammaar - product and design; shares great things about vibe-coding in Google AI Studio
@fofrAI - cool use cases for generative models
Cursor
@leerob - the loudest voice behind Cursor updates
@ericzakariasson - shares great insights on using Cursor
@mntruell - Cursor’s CEO; major releases and usage updates
xAI
@milichab - recently joined xAI, shares updates on Grok
@skcd42 - also covers major Grok releases
@elonmusk - Elon does a great job reposting and hyping all xAI products
who else did I miss?
English
MTA retweetledi

MTA retweetledi

I’ve always believed the No.1 application of AI should be to improve human health.
That work started with AlphaFold, and now at @IsomorphicLabs with the mission to reimagine drug discovery and one day solve all disease!
We are turbocharging that goal with $2.1B in new funding.
English
MTA retweetledi

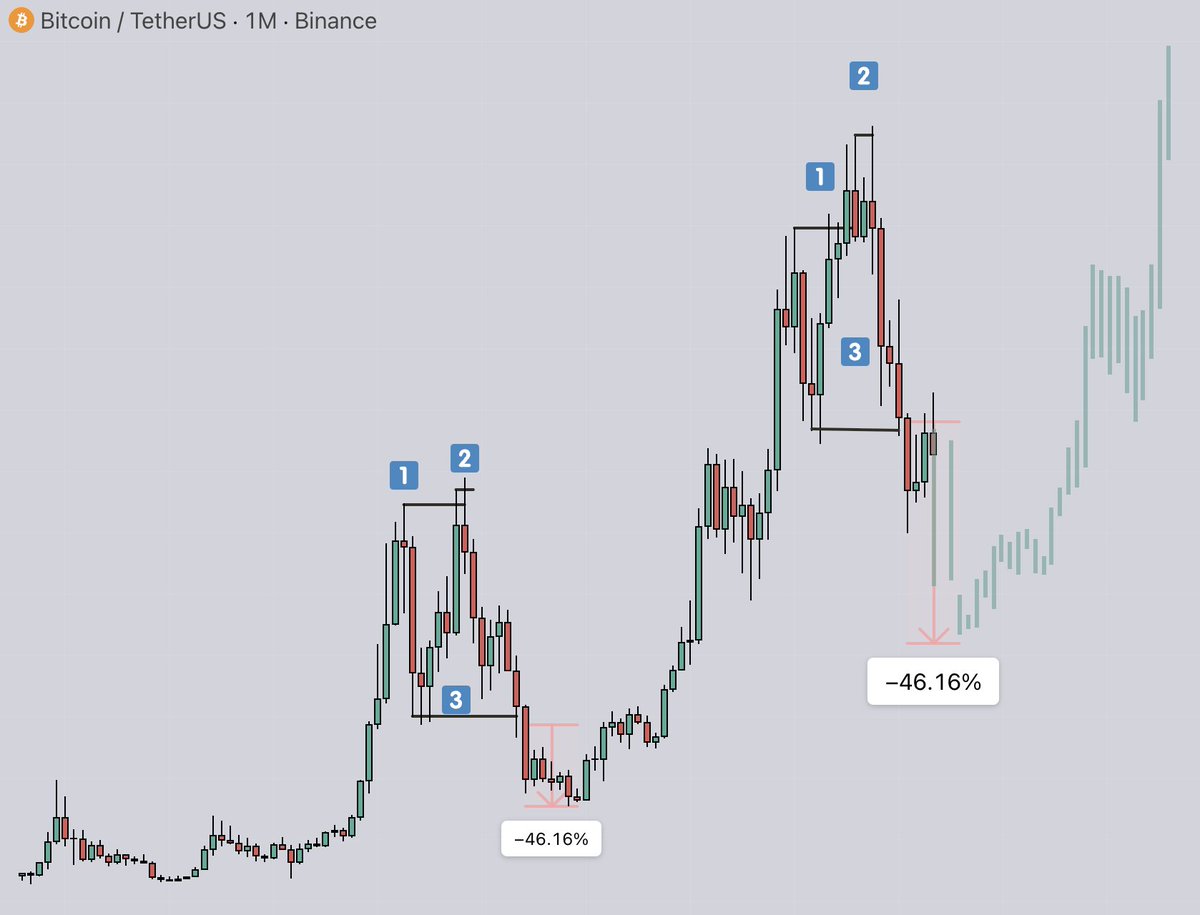
DON'T BUY $BTC UNTIL YOU SEE THIS
The real bottom always announces itself with massive volume. Always
We saw it in 2022-2023. The capitulation spike was unmistakable
Right now?
The volume box is empty - price is falling but nobody is truly panicking yet
That's the problem. The hardest flush always comes after retail thinks it's over
Wait for the spike. That's your signal
NOTIFS ON!
Gargoyle@degargoyle
$BTC IS RUNNING THE SAME 3-YEAR CLOCK SINCE 2018 And it's never missed a beat The structure is mechanical: - 365 days of bear - 1,065 days of bull - Higher peak each cycle 2018-2021: bottom $3k, peak $69k 2022-2025: bottom $15k, peak $126k We're now ~220 days into the bear phase of 2026-2029. Bottom prints around February 2027 After that, the next 1,065-day bull run begins This isn't a forecast. It's the same engine running for the third time NOTIFS ON!
English
MTA retweetledi

MTA retweetledi

$BTC DISTRIBUTION PHASE HAS BEGUN
Three signals lined up at the same moment:
1. Distribution on price
2. RSI uptrend broken
3. MACD formed a bearish cross
This is not the kind of setup I'd recommend ignoring
Watched this exact pattern play out countless times, and it always ends in one direction. Down
Don't say I didn't warn you
FOLLOW + NOTIFS ON!
Kalshi Crypto@Kalshi_Crypto
BREAKING: Our traders forecast Bitcoin will crash to $60,000 this year
English
MTA retweetledi

Mark my words 2.0:
Two weeks ago, I predicted the $BTC hits into the $82K.
And now it’s time to say it again:
Everyone thinks Bitcoin is breaking out again.
In reality, Bitcoin has formed a Wyckoff accumulation pattern.
Traders see accumulation and think there is no danger.
That’s exactly how they get trapped.
Bitcoin has already completed the first major reaction after the local high near $82K.
That is the Relief Rally phase.
And historically, this stage is followed by downside.
But the setup is not that simple:
- Drop toward $60K (finished)
- Secondary Test formation (completed)
- Bounce back above $75K (done)
- Re-sweep of the lows (next)
- Cycle bottom formation (coming)
That’s how accumulation works.
It doesn’t reward people who chase every bounce.
It rewards people who understand the structure.
Most traders only think in one direction:
“BTC is pumping. Bottom is in.”
Wrong.
Real accumulation is messy.
It shakes out early buyers.
It traps breakout traders.
It forces people to sell the bottom twice.
That’s why my main focus is still the same:
A potential <$50K bottom.
Not because Bitcoin is dead.
Because this is where the real accumulation phase can finish.
For the record, I was the only one publicly calling the exact bottom at $16,000 three years ago and the top at $126,000 in October.
If you missed those calls, don’t worry. I’ll call the next one too.
Turn notifications on. If you’re not following yet, you’ll understand why that was a mistake later.
DANNY@Danny_Crypton
Mark my words: $BTC will fill the $82K CME gap. 100%. And when it happens… Over $10 BILLION in shorts will get liquidated. That’s the TRAP. Everyone will call it a breakout. Everyone will think the bull market is back. But bulls won’t like what comes next. This move is not the end. It’s the setup. For the record: I’ve studied macro for 10 years and called almost every major market top, including the October BTC ATH. Follow and turn notifications on. I’ll post the warning BEFORE it hits the headlines.
English
MTA retweetledi

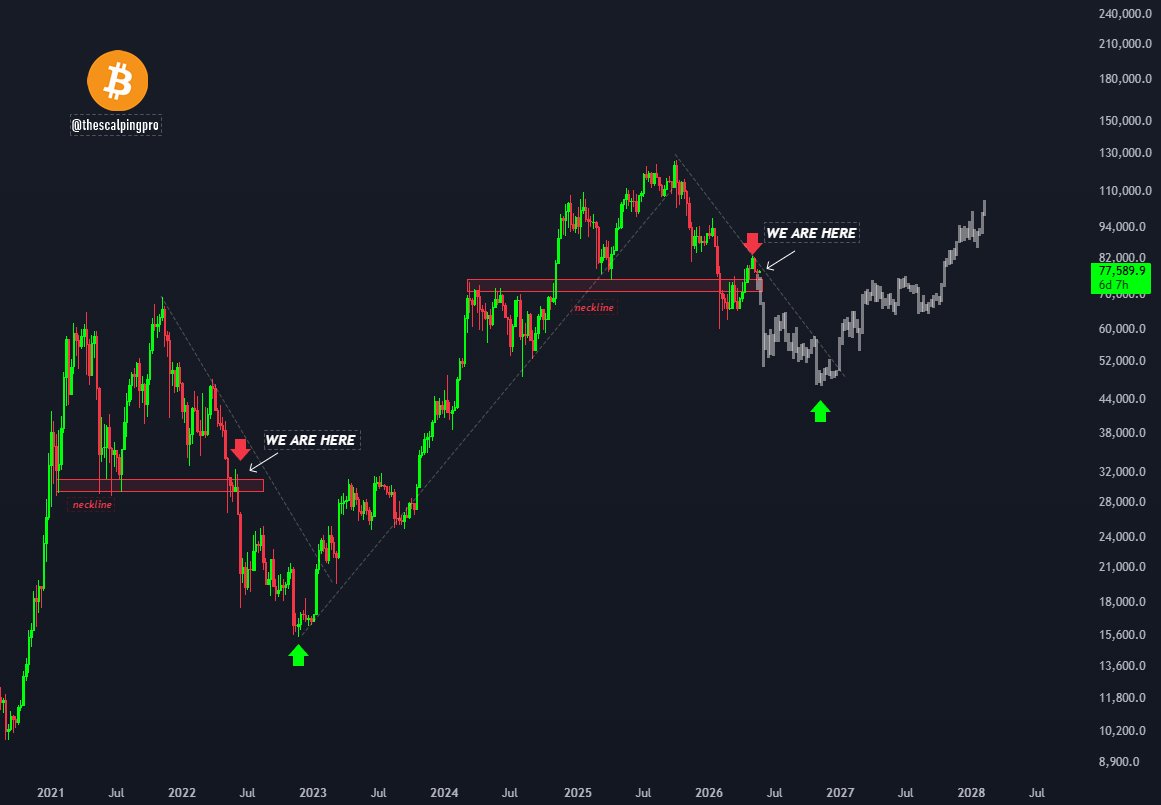
Everything is going according to the plan.
2018 → 2022 → 2026
Bitcoin cycle bottom will look exactly like this.
Remember, I was the only one publicly calling the exact bottom at $16,000 three years ago and the top at $126,000 in October.
If you missed those calls, don’t worry. I’ll call the next one too.
Turn notifications on. If you’re not following yet, you’ll understand why that was a mistake later.
Alex Mason 👁△@AlexMasonCrypto
🚨 READ THIS CAREFULLY Everyone thinks Bitcoin is breaking out. The chart says something completely different. Bitcoin is now forming a Wyckoff accumulation pattern. Most traders see accumulation and think the danger is over. That’s exactly how they get trapped. Bitcoin has already completed the first major reaction after the local high near $82.5K. That is the Relief Rally phase. And historically, this stage is followed by downside. But the setup is not that simple: - Drop toward $60K (finished) - Secondary Test formation (completed) - Bounce back above $75K (done) - Re-sweep of the lows (next) - Cycle bottom formation (coming) That’s how accumulation works. It doesn’t reward people who chase every bounce. It rewards people who understand the structure. Most traders only think in one direction: “BTC is pumping. Bottom is in.” Wrong. Real accumulation is messy. It shakes out early buyers. It traps breakout traders. It forces people to sell the bottom twice. That’s why my main focus is still the same: A potential <$50K bottom. Not because Bitcoin is dead. Because this is where the real accumulation phase can finish. For the record, I was the only one publicly calling the exact bottom at $16,000 three years ago and the top at $126,000 in October. If you missed those calls, don’t worry. I’ll call the next one too. Turn notifications on. If you’re not following yet, you’ll understand why that was a mistake later.
English
MTA retweetledi

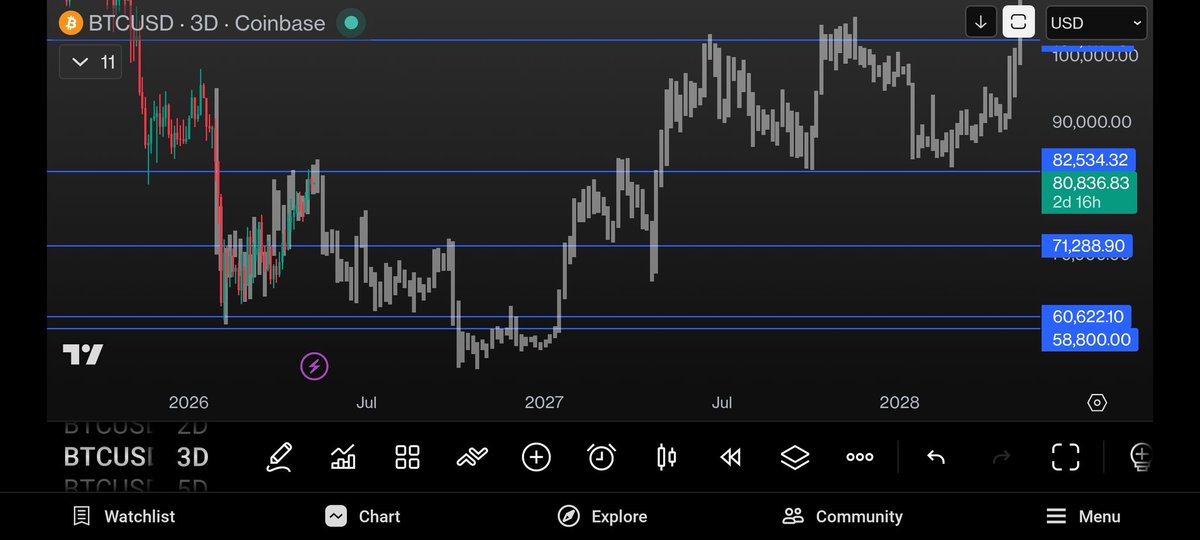
🚨 JUST LOOK AT THIS $BTC CHART...
BTC entered a critical “Bull Trap Zone” near $83k after rallying in an ascending channel
May 15, Kevin Warsh may become new Fed Chair - historically, Fed leadership changes trigger major market dumps...
First downside target is $60k, with a break below it
All eyes on BTC chart right now - turn on notifs, I’ll update
Kalshi Crypto@Kalshi_Crypto
BREAKING: Our traders forecast Bitcoin will crash to $60,000 this year
English
MTA retweetledi

MTA retweetledi


MTA retweetledi

Bitcoin is now hovering at the exact level where EVERY bull trap ends.
English
MTA retweetledi

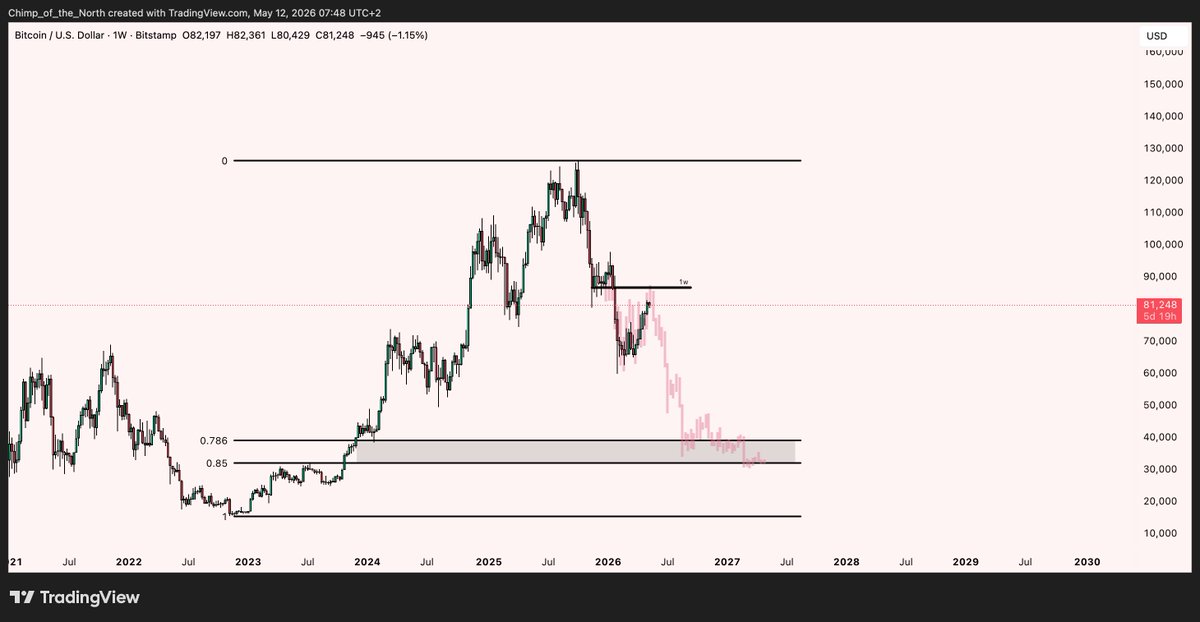
Are we in a bear market?
$BTC
Chimp of the North@cryptochimpanz
0.786 is the standard Fibonacci level of a bear market. That means 40k. Will this time be different? $BTC
English
MTA retweetledi
DON'T BUY $BTC YET
There's one signal I wait for before buying a cycle low
Not price or sentiment - but volume
Specifically - one violent capitulation spike that tells you the weak hands are finally out
2022 delivered it perfectly, but this cycle hasn't come close
Until that spike shows up - this is just a trap for impatient buyers
FOLLOW + NOTIFS ON!
bee🐝@0xbeehive
$BTC PATTERN REPEATING AGAIN CME gap filled. Resistance rejected. Price couldn't hold above This is exactly how distribution played out before - and now it's happening again The next move is obvious: Testing lower levels And if the flash crash repeats like last time, we're looking at 52-53.5k The pattern is too clean Are you ready? FOLLOW + NOTIFS ON!
English
MTA retweetledi

Bitcoin Is Heading Into The Exact $85K Bull Trap This Chart Predicted.
We’re mirroring the 2022 pattern right now, and $BTC will dump to $48,000 in 15 days.
Position accordingly and don’t let them fool you.
English
MTA retweetledi

