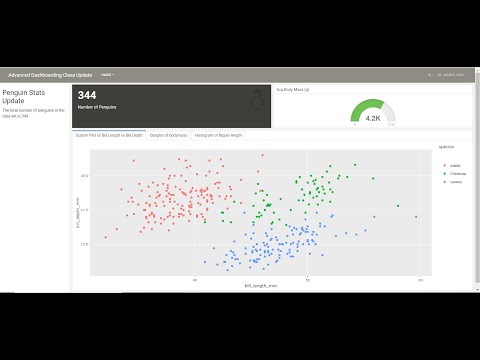
Dan

41 posts

Dan banner
Dan

Dan

@danielpballer

Army Data Scientist | Former Assistant Professor @WestPoint_USMA | Power BI & RStats Enthusiast | Data Viz

Washington, DC Katılım Haziran 2011
834 Takip Edilen201 Takipçiler
Dan
Dan@danielpballer·
@plusev Definitely.
English
2
0
1
48
Matt Downs
Matt Downs@PlusEV·
Going to release the beta of my new project here soon....anyone interested in testing?
English
113
3
163
25.8K
Dan
Dan@danielpballer·
Check out our session this afternoon on Data and AI Literacy, upskilling the workforce, and leveraging public/private partnerships to build a culture of data-driven decision making. #cdoiq2024 #data #datascience #AI #analytics
Dan tweet media
English
0
0
0
94
Dan
Dan@danielpballer·
@BillMakaka If you don’t want to go full shiny, flexdashboards are a great tool and are really easy to make if you are already working in R. Here is a workshop I ran last year that will walk you through the process. youtu.be/Opa_Nf88mCU
YouTube video
YouTube
English
0
0
1
23
Don't Fret
Don't Fret@BsMakaka·
I want to build a dashboard for a non-profit I volunteer at. I’ve never used a BI tool before but I’m willing to put in the hours. What’s the best tool out there to start with BI right now? I know of a few. #Analytics #DataScience #rstats
English
2
3
2
1.9K
Dan
Dan@danielpballer·
@statacake I ran West Point’s intro stats course for 2 years, both in base R and after switching to tidyverse. I’d definitely recommend using ggplot2 for the visualizations. Here is what we gave students as an into to tidy and ggplot2. danielpballer.github.io/Tidyverse_Tuto…
English
1
0
2
73
Michael Wallace
Michael Wallace@statacake·
Question for #RStats folks: is it worth the time investment to use ggplot2 in an intro stats class (2nd year undergrad, first time using R) where the only graphical work is histograms and scatter/bar/box/qq plots? I'm unsure how much overhead (if any) it adds over base graphics
English
36
5
29
23.9K
Dan
Dan@danielpballer·
Today I gave the last final to my Sabermetrics class, finishing my 4 years teaching at West Point. I feel lucky I was able to end my time here teaching our most R intensive course to 2 great classes. #RStats #highereducation
Dan tweet mediaDan tweet media
English
0
2
24
0
Dan
Dan@danielpballer·
@CDavieSTEM I'm glad you liked it and found it useful. Great dashboard. I really like the choropleth map you added.
English
0
0
0
0
Dan
Dan@danielpballer·
@FilmicAesthetic I'm glad you found it helpful. Once you start its hard to stop. I've made them to track everything from my workouts to sports betting.
English
0
0
0
0
Dan
Dan@danielpballer·
@shah_f1 Shah, That's awesome. I'm glad it worked for you.
English
1
0
1
0
Dan
Dan@danielpballer·
@FilmicAesthetic I hope you find it useful. Let me know if you have any questions.
English
0
0
1
0
Dan
Dan@danielpballer·
@rvidal I have not tried deploying in a private space yet. One of the nice things about the dashboard is that it creates a stand alone HTML document that can be opened with any web browser. So you would be able to email the document out or hang it on an internal SharePoint.
English
1
0
4
0
Ricardo Vidal
Ricardo Vidal@rvidal·
@danielpballer Thanks for sharing this Dan, very timely. I'm curious if you've been able to deploy the dashboard to a private space for internal company use. Any tips on adding authentication? (I haven't yet watched the video in full)
English
1
0
2
0