Sabitlenmiş Tweet

New Viz! 🤩🤩
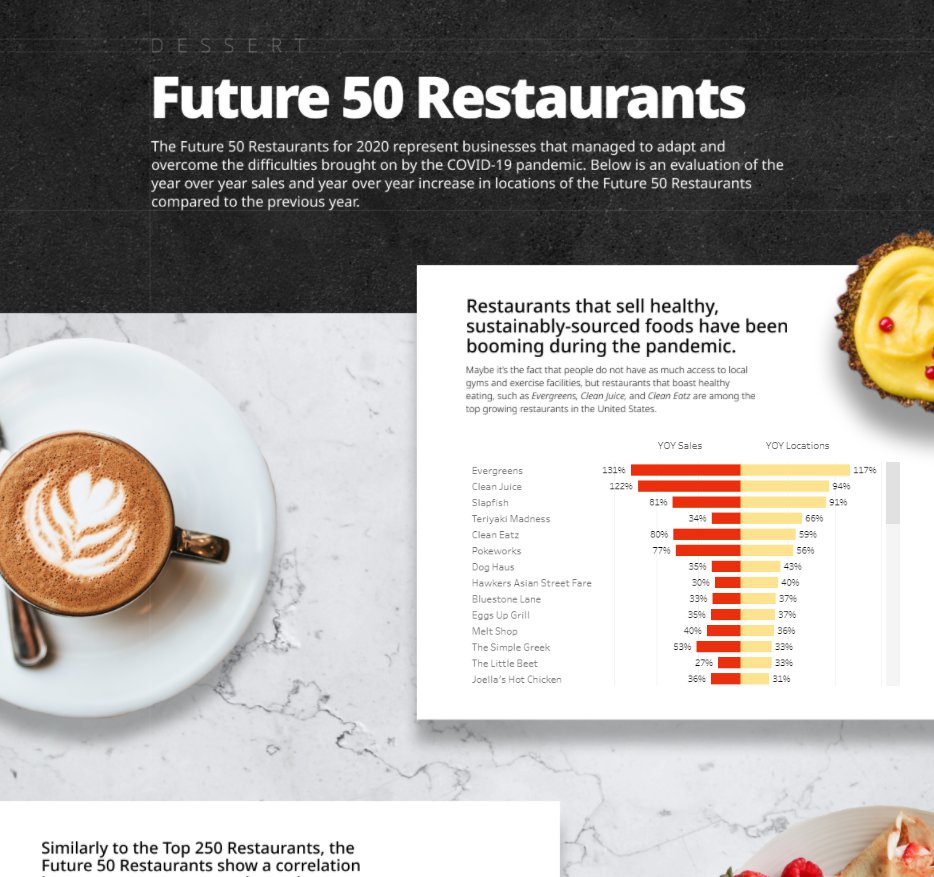
Want to know how the top restaurants performed in 2020? I certainly did. Here is an analysis of the Top 250 restaurants, Independent 100 Restaurants, and Future 50 Restaurants from Restaurant Business Magazine.
Public Link: public.tableau.com/views/ATasteof…


English