Ed Clissold

1.8K posts

Ed Clissold banner
Ed Clissold

Ed Clissold

@edclissold

Chief U.S. Strategist for Ned Davis Research (NDR). The truth resists simplicity so let's debate in 280 characters. Charts over text. rt ≠ endorsements.

Sarasota, FL Katılım Ağustos 2014
907 Takip Edilen19.6K Takipçiler
Ed Clissold
Ed Clissold@edclissold·
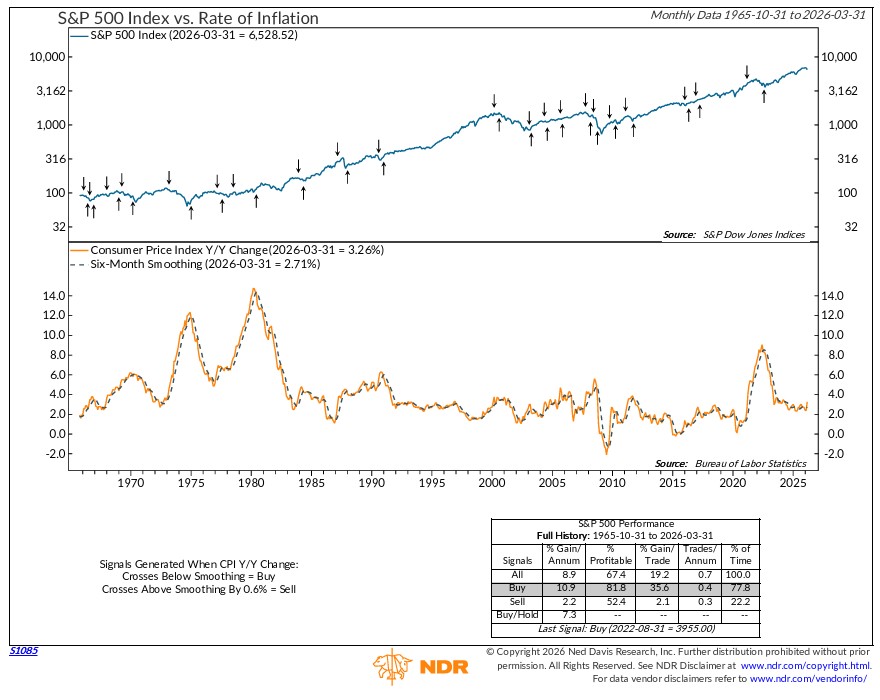
Today's CPI report pushed our disinflation/inflation indicator into its bearish mode. It's one part of the mosaic, but it's getting harder to say that higher oil prices are not having a broader impact. @NDR_Research
Ed Clissold tweet media
English
2
6
35
3.2K
Nic
Nic@nicrypto·
"S&P 500 at record highs" is a misleading headline. Just 5 stocks drove more than half the index's gains since April. Only 42 stocks are meaningfully contributing to the index's performance. The historical average is around 100. The average stock in the S&P has been struggling. This isn't broad market strength. It's a small cluster of AI names holding up a number most investors don't recognise in their portfolios.
Nic tweet media
English
39
33
210
35.2K
Ed Clissold
Ed Clissold@edclissold·
Since the financial crisis short-term breadth has been more volatile. ETFs, algos, and ZIRP made trading more like a stock market vs a market of stocks. A consequence is that breadth thrusts were more common. The violent industry rotations provide more stock-picking opportunities make breadth thrusts less likely. Does that mean the market can't rally? Of course not. Look at how few breadth thrusts occurred in the 80s and 90s. But it makes V-bottoms like in 2018 and 2020 less likely as investors debate the geopolitical, economic, inflation and earnings fallout of the Iran conflict. 5/5
Ed Clissold tweet media
English
1
2
20
1.9K
Ed Clissold
Ed Clissold@edclissold·
@NDR_Research The indicator that has gotten closest is the % stocks > their 10-day moving averages. It rose as highs as 85% but has fallen to 73%. To get to 90% almost all stocks have to participate. Energy zigging when most other sectors have zagged has prevented that from happening. 4/5
Ed Clissold tweet media
English
1
1
16
2.3K
Ed Clissold
Ed Clissold@edclissold·
The market goes through a 4 step process to transition from a downtrend to an uptrend. The process isn't always linear. Retests (step 3) can fail, resetting the process to step 1. In rare cases the market skips step 3, also known as a V-bottom. Where are we? A 🧵@NDR_Research 1/5
Ed Clissold tweet media
English
4
17
85
14.7K
Ed Clissold
Ed Clissold@edclissold·
Today's CPI report was in line, with the core better than expected. Our long-term CPI trend indicator doesn't care about economists' expectations or excluding short-term moves in volatile sectors. It simply compares the headline CPI to its 6-month average. It turned bullish for the S&P 500 on the Aug 2022 report, which came out a few weeks before the cyclical bear ended. It stayed bullish through some hot CPI reports in 2024 and 2025. This month's report pushed the CPI to 0.55% points above its 6-month average, so the indicator is still bullish. Another month like March or even Feb (+0.47% m/m) and the indicator will be telling a different story. @NDR_Research
Ed Clissold tweet media
English
2
5
48
18.6K
Ed Clissold
Ed Clissold@edclissold·
@MuggieFocker True. Much of the bearish Big 10 results can be attributed to Indiana. Guess we should thank the IU athletic director Scott Dolan for not firing Mike Woodson two years ago to hire Dusty May. @ByPatForde
Ed Clissold tweet media
English
0
0
1
183
k.balzer
k.balzer@MuggieFocker·
Following Michigan's title win on April 3, 1989, the S&P 500 continued a strong upward trend through the end of the year. S&P 500 Performance (Post-Championship to Year-End 1989) | Milestone | Date | S&P 500 Close | % Change from Title Date | **National Title** | **April 3, 1989** | **297.16** | | 3 Months After | July 3, 1989 | 317.98 | +7.01% | | 6 Months After | Oct 3, 1989 | 349.15 | +17.50% | | **Year-End** | **Dec 29, 1989** | **353.40** |**+18.93%** | Market Summary for Late 1989 1989 was a banner year for the stock market, with the S&P 500 posting a total annual return of 27.25% Following the tournament, the market climbed steadily as inflation fears cooled and the Fed began a series of interest rate cuts. There was a brief, sharp volatility spike on October 13, 1989, triggered by the failure of a leveraged buyout deal for United Airlines. However, the market recovered quickly to finish the year near all-time highs. The index gained nearly **19%** in just the nine months between Michigan's victory and the New Year’s Eve ball drop.
English
2
0
0
41
Ed Clissold
Ed Clissold@edclissold·
UCONN has won 6 championships. The SPX has risen 5/6 times by a median of 11.9%, the most of any team with at least 4 titles. For those of you who find Dan Hurley's antics hard to swallow, the S&P 500 jumped 28.2% in 1997, the one time Arizona won it all. 6/6
Ed Clissold tweet media
English
0
0
1
1.3K
Ed Clissold
Ed Clissold@edclissold·
Duke is the #1 overall seed. The S&P 500 has risen 4/5 times when the Blue Devils have won the natty but the median gain is a lackluster 5.9%. Feel free to root against Duke. Unless you went there, you probably will anyway. 5/6
Ed Clissold tweet media
English
1
1
2
1.5K
Ed Clissold
Ed Clissold@edclissold·
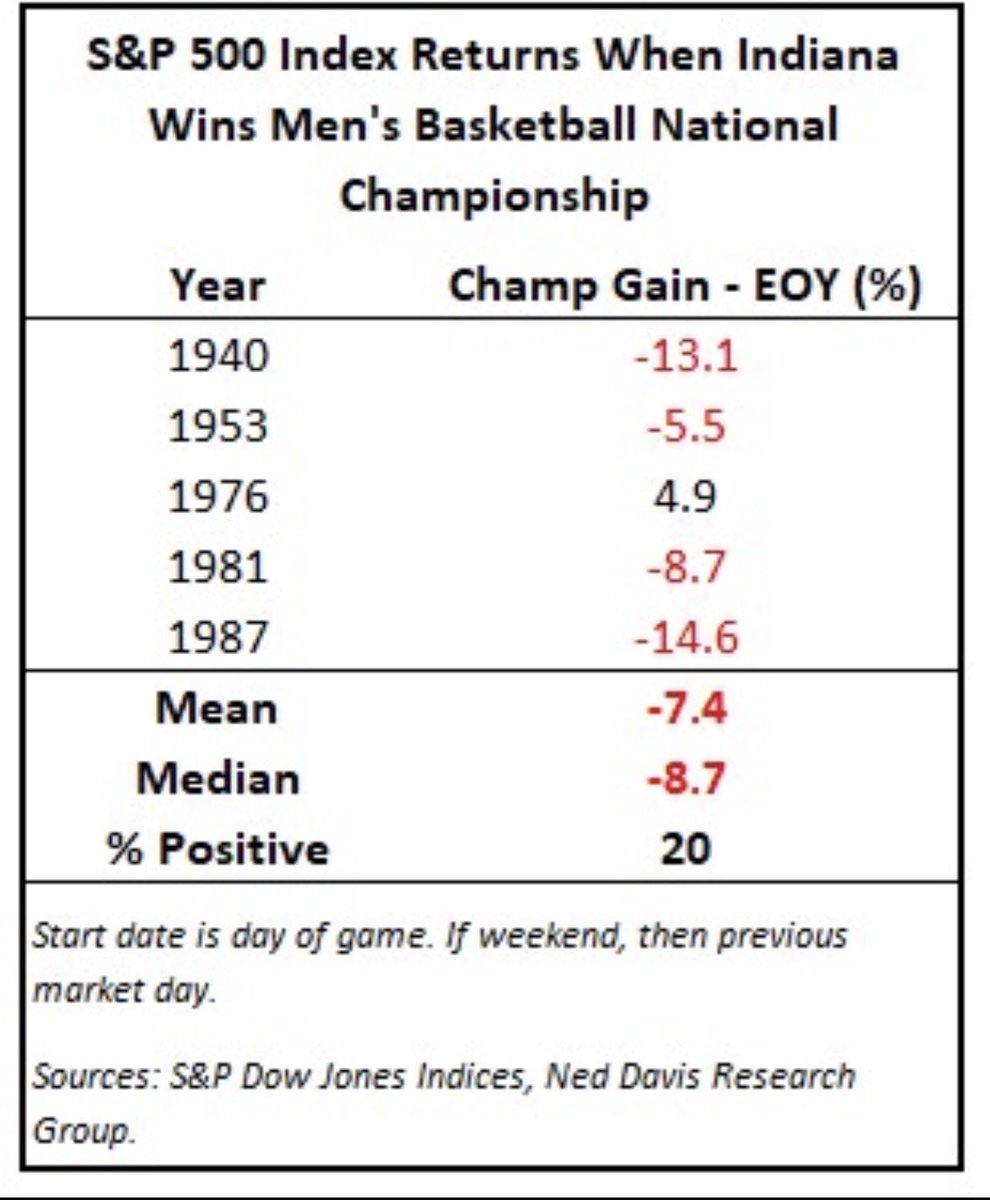
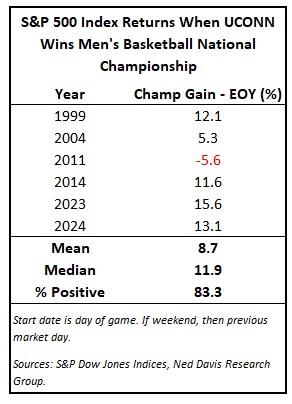
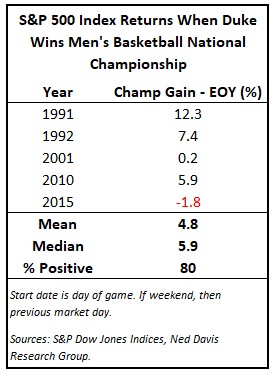
Heard of the Superbowl indicator? In honor of the NCAA basketball tournament, here is the March Madness Indicator. How has the S&P 500 performed the rest of the year based on which conference wins the national championship? Bad news for the bulls. The worst conference? The Big 10. Who has half of the Elite 8? The Big 10. Good news? The best are the Big East and the SEC, which each has 1 team left. @NDR_Research 1/6
Ed Clissold tweet media
English
2
1
10
6.5K
Ed Clissold
Ed Clissold@edclissold·
Both the S&P MidCap 400 and S&P 600 SmallCap hit record highs on Friday. S&P indices tend to be higher quality than Russell b/c they look at profitability. 6/6
Ed Clissold tweet media
English
0
1
22
1.9K
Ed Clissold
Ed Clissold@edclissold·
On an absolute basis, the Russell MidCap hit a new high on Friday. The Russell 2000 is still in an uptrend but is 1.8% below its Jan 22 record. Unlike last fall when the RUT raced to a record on the junk trade, this has been driven more by high quality stocks. 5/6
Ed Clissold tweet media
English
1
0
15
2.3K
Ed Clissold
Ed Clissold@edclissold·
Quite the week! A 🧵on the rotations and what they could mean going forward. Friday was a 5:1 up day using the @NDR_Research universe of common stocks, best since Oct 13 but modest considering SPX +1.8% & RUT +3.6%. Breadth thrusts are difficult in rotating markets. 1/6
Ed Clissold tweet media
English
1
4
42
20K