Ed Landon
393 posts


Get in loser, we’re making hardware fun again


The production of interesting X articles has now officially outpaced my ability to even bookmark them
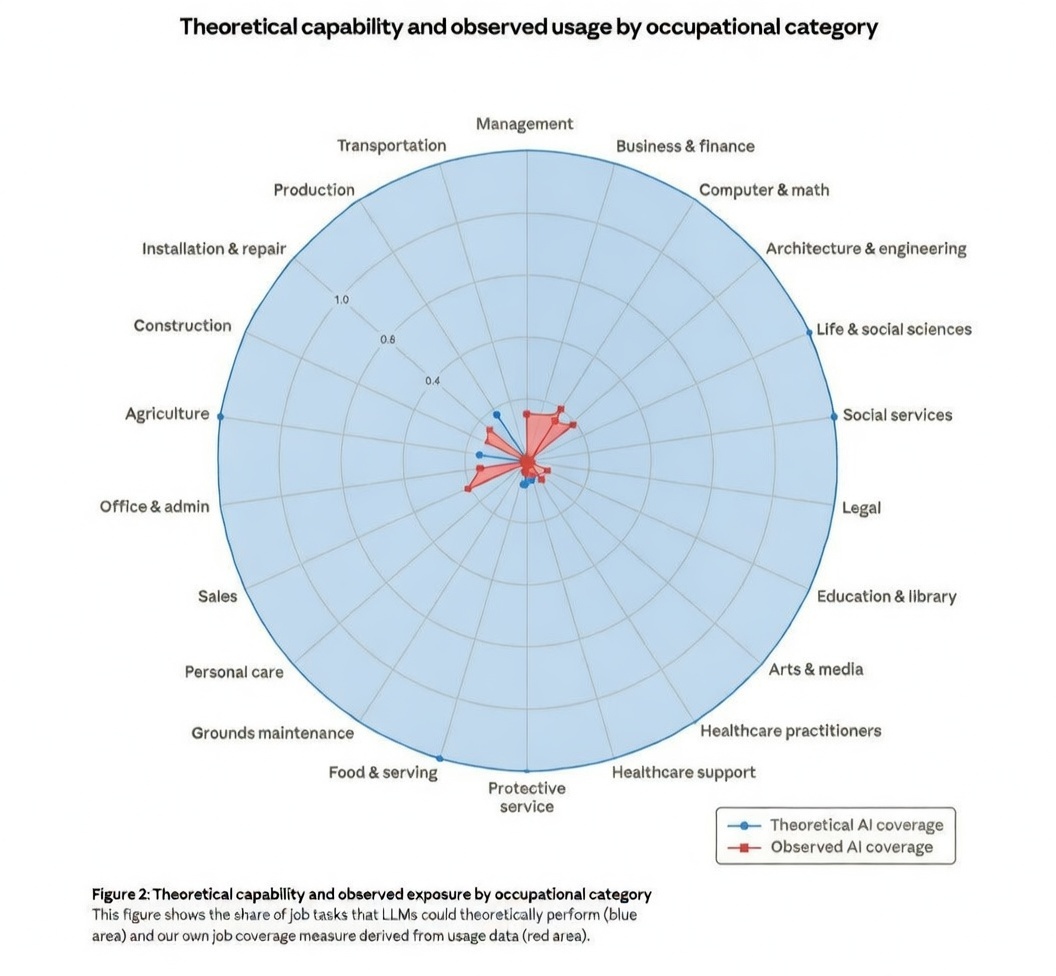
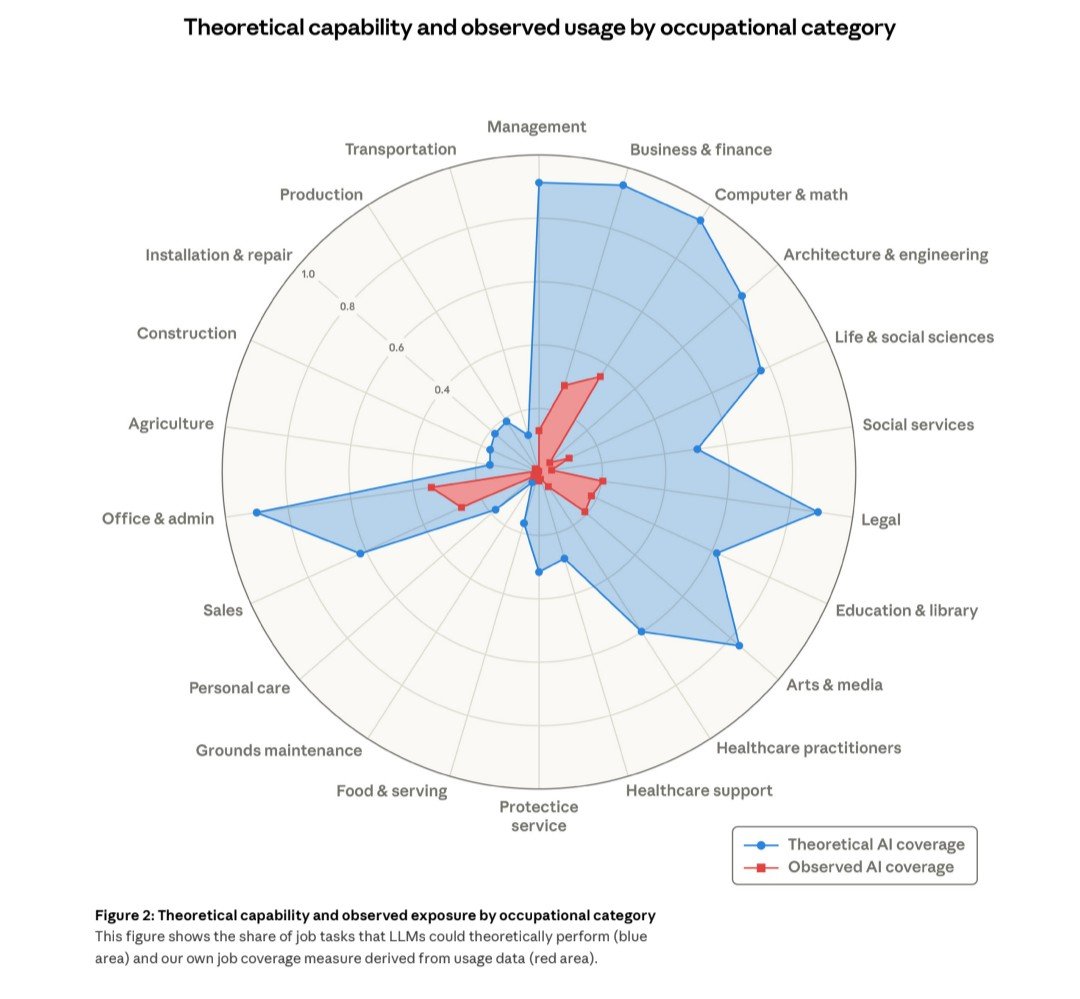
alright, 100 thoughts about this chart. let's go. 1. Your parents told you the blue zone was safe, they lied (don't blame them though, how were they supposed to know? 2. remote work really fucked us. that was the dress rehearsal. if you can do your job from home, it can be done by AI 3. your barber's job is safe. your barber's accountant's job is not. 4. the blue is what AI will take over. the red is what it's already taking over. the gap between them is borrowed time. 5. "computer & math" have the highest observed usage. it means programmers aren't in denial - they already know. 6. nobody in construction is worried about AI 7. lawyer's seem to have a massive theoretical exposure but little observed usage. i've seen takes on both sides of this....are they sleepwalking into it? 🤔 8. In 1995, the internet had a similar chart, theoretical exposure everywhere, but observed usage nowhere. that took ten years....how long will it take this time? 9. they should've called this "the map of commoditization" 10. the red area is also a spending chart. that's where the money is flowing right now (computer & math, a little bit of business & finance. everything else is pre-revenue.) 11. most dangerous positions right now are high blue but low red. 12. in 10+ years, the highest paid people won't be in any of these categories. they'll be in categories that don't exist. 13. once 'trust arrives', red catches the blue overnight. i don't think it'll be gradual. 14. "highest status jobs" of the last ten years happen to be the most exposed in 2026. Status is a lagging indicator. 15. we spent 50 years building an economy that rewards people who work with information. well...turns out ai eats information for breakfast. 16. when the output is free, the only thing left to charge for is taste, curation and trust. but if you're reading this, you already know that. 17. this chart measures tasks. it doesn't measure meaning. what are the jobs where the meaning is the task? maybe those are the ones to get into. 18. thinking is a commodity. presenece is a luxury. 19. job titles are becoming meaningless. two people called "designer" will have completely different exposure levels based on whether their work is reproducable. 20. adoption isn't slow because the tools are bad. i think adoption is slow because acceptance is painful (speaking from my own experience) 21. if you rotate the circle, the blue part looks like a crown. i never said these thoughts would be good. the crown is heavy. 22. thinking about law school as well. tuition is $200k. we're training people for the blue zone. that has to collapse somehow. applies to a lot of other fields too. 23. there's going to be a huge mental health crisis. not from ai taking jobs, but for the folks who made their identity all around the skills that will get commoditized. 24. "food and serving" is nearly untouched. someone asked me about those robots in restaurants that bring your food. pretty sure humans will always want ot be served by humans. that preference isn't going away. if anything, it's going to become a premium. 25. this chart is going to redraw the geography of wealth. cities full of knowledge workers are exposed, but the towns full of tradespeople are not. 26. SF is in the blue zone. 27. re: education; AI will replace the lecture. It will not replace the teacher who noticed a kid was struggling and pulled them aside. 28. you will tell your kids one day "i got paid six figures to organized information". Their kids will not understand. 29. turns out "learn to code" advice is like the "learn to type" advice of its era. useful for a window until that window closes. 30. i need to go back to this remote thing. the whole "work from home forever" now looks a lot like a trap. we optimized for comfort....we needed to optimize for irreplaceability. 31. rest assured, this chart does not show what comes after. there's a lot to be optimistic about, when the blue fills in the red, new categories will emerge. the automobile didn't create "car repair" as a category until cars existed (not the best example but you get it). 33. this chart says nothing about entrepreneurship because entrepreneurship isn't a job category. It's a bet. And the smart bet just moved from "I can think better" to "I can be present better." alright, didn't make it to 100 but i got to go. I may finish this later. this is the type of chart that can lead to a lot of anxiety, but I think it's important to start thinking about what comes after. more on that soon.

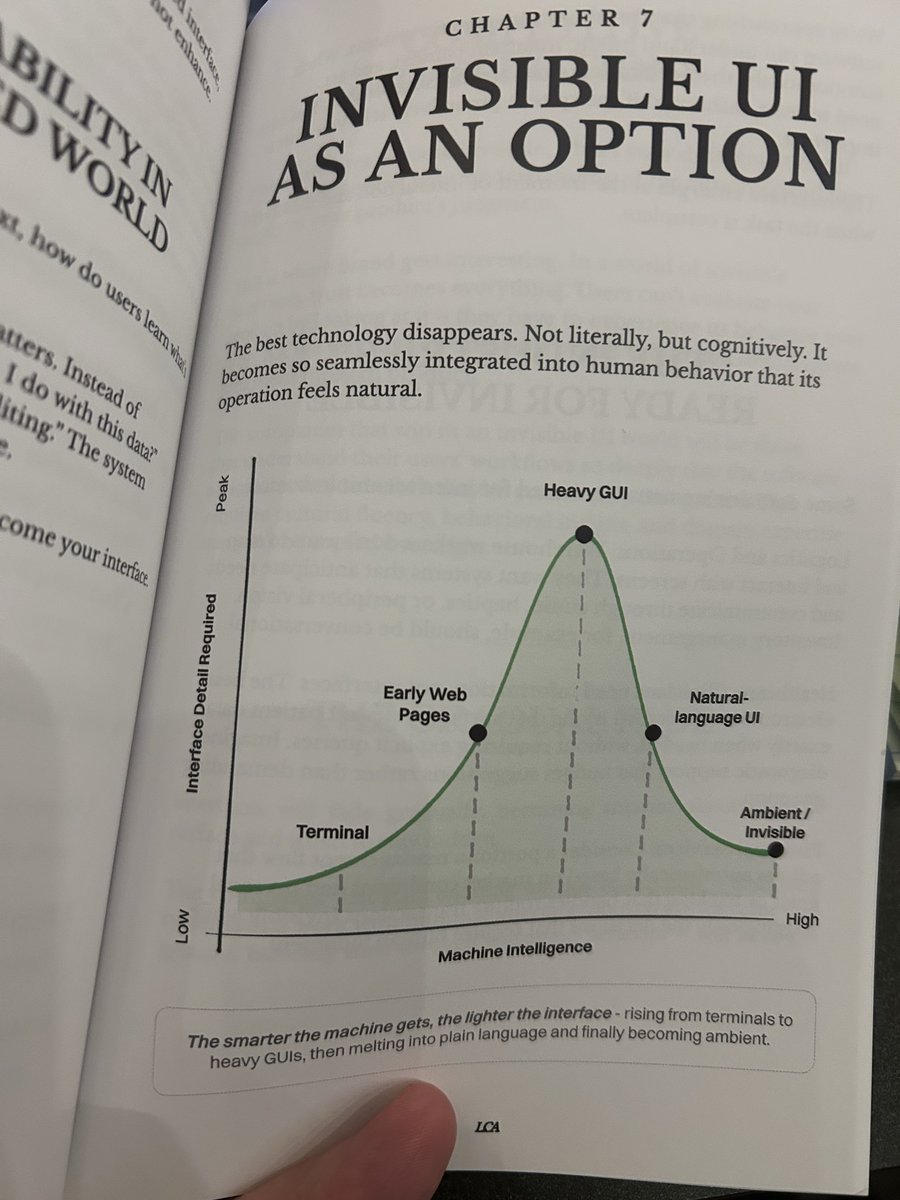


In a world of openclaw, codex, claude code/cowork, manus, and other agentic systems, it’s becoming clear that the future of software has to be API-first, but also enable human interaction for verification, collaboration with agents and people, and working on the output. It’s generally been the case that software was built for people first and foremost, and then APIs are exposed for other systems to connect into that tool or data. But if we imagine a world where AI agents are doing 10X or 100X more work with software than people, then this paradigm is flipped. Software becomes API-first, with ways of having humans be able to work effectively with the agent, either through a UI as relevant, or chat. If you’re not API-first, then you’re nearly DOA to agents.