Sabitlenmiş Tweet
Emelle
712 posts


Emelle
@emellesmith
I started a band! music coming soon... https://t.co/7gTzoqUaeN https://t.co/lqT3rBlQfZ
London, England Katılım Aralık 2009
553 Takip Edilen4.9K Takipçiler


@NorthstarCharts @WOLF_Bitcoin_ So first down to 3000-3650 and then up?
English


@Economic_Office It won't it reach the red line of around $5200 before coming back down?
English

#XAUUSD #GOLD | H4 Analysis Update
It continues to move below the red descending trend line.
The $5,000 level is a psychological level. Unless the $5,000 level is broken, a pullback toward $4,000 is expected.
The structure has completed the 3rd wave formation. We are currently in the 4th wave. The target of this wave is $4,000. After the completion of the 4th wave, an upward move will begin with the 5th wave.
The main target is $6,000.
Economic Office@Economic_Office
#XAUUSD #GOLD | H4 Analysis Update Gold is currently continuing its movement below the red descending trendline. The $5,000 level is a psychological level. If this level is broken, the move from $4,665 to $5,000 will be considered complete. As long as $5,000 is not broken, a pullback toward $4,000 is expected. Direction will be determined by the breakout of $5,000.
English
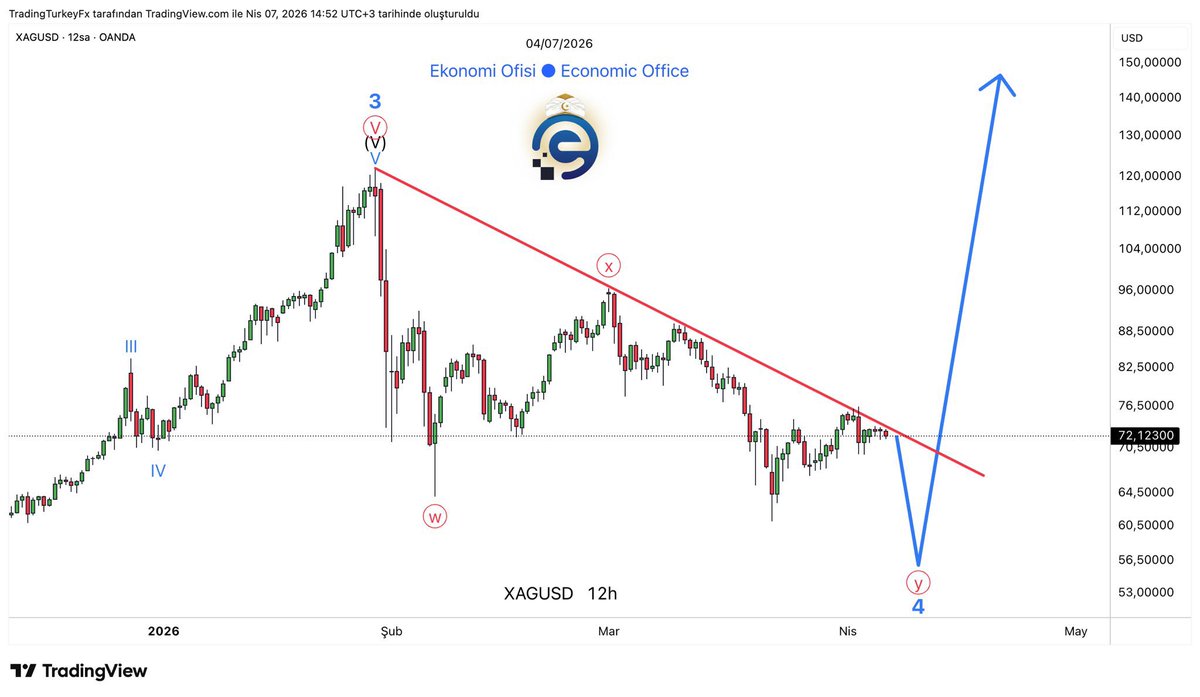
The descending trendline has been broken on the 12h chart of silver.
This breakout signals that the direction has turned upward in the current structure. In the Elliott wave count, if wave 4 has completed and wave 5 — the new upward phase — has begun, the 145–150 range stands out as the target.
At this point, the issue is no longer whether the breakout occurred, but how strongly price will sustain the upward move after the breakout.
#XAGUSD #SILVER

Economic Office@Economic_Office
The target in silver is still $150. The wave 4 correction that started after wave 3 is progressing in a W-X-Y format. W is completed, X made its reaction rise. Now we are inside the Y wave. The red descending trend on the chart is currently the most critical structure. Price is being suppressed below this trend. Therefore, it is early to say that the correction is completely over. When this trend is broken, it can be stated more clearly that wave 4 has ended and wave 5 has started. #XAGUSD #SILVER
English
The target in silver is still $150.
The wave 4 correction that started after wave 3 is progressing in a W-X-Y format.
W is completed, X made its reaction rise. Now we are inside the Y wave.
The red descending trend on the chart is currently the most critical structure. Price is being suppressed below this trend. Therefore, it is early to say that the correction is completely over.
When this trend is broken, it can be stated more clearly that wave 4 has ended and wave 5 has started.
#XAGUSD #SILVER
Economic Office@Economic_Office
Silver has reached the red descending trend. My first expectation: a pullback toward the $56–59 range. If this zone holds, wave 4 completes and the attempt for an upside breakout strengthens. Critical scenario: • Holding above the $56–59 range → $80 and then the $120+ zone. • Sustained move below $56 → the count extends, the rally is delayed. We are currently in the decision zone. Do you think we’ll see a liquidity sweep first, or a direct breakout? #XAGUSD #SILVER
English


@badcharts1 @Silver84x So does this mean you think it's going down to $31 before going back up?
English

Please be mindful of this historical silver chart when tempted to jump in a trade because of fomo.
Don't get hurt, stay safe using charts.

English

We are doing a scientific research right now and we need your honest answer (for males only): which coordinates do you piss in?

English


@Economic_Office But then it would be weird if gold continues to rise when you say silver has peaked for now?
English
@Economic_Office Going off this chart it looks like it will touch 5200 before dropping right?
English
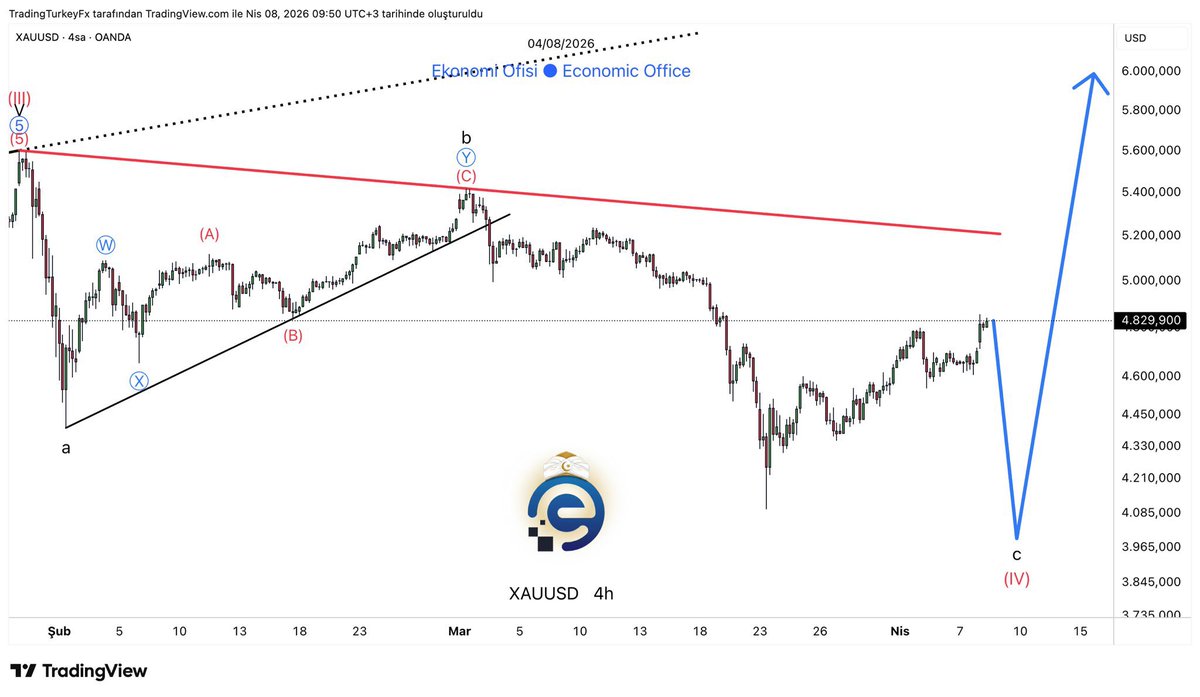
#XAUUSD #GOLD | H4 Analysis Update
Gold is at $4724. The c wave is nearing completion. Next target: $6000.
Simply put:
After completing phase 3, gold entered a correction in phase 4. This correction is unfolding in an a-b-c format. Wave a is complete. Wave b is complete. Wave c is in its final stage. Once c is completed, phase 4 ends and phase 5 begins.
The target for phase 5: $6000.

Economic Office@Economic_Office
#XAUUSD #GOLD | H4 Analysis Update Gold is at $4559. The c wave is about to be completed. Next target: $6000. Let’s explain it simply: After completing the 3rd phase, gold entered a correction in the 4th phase. This correction is progressing in an a-b-c format. a is completed. b is completed. The c wave is in its final stage. Once c is completed, the 4th phase ends. And the 5th phase begins. Target for the 5th phase: $6000.
English
@Economic_Office When are you expecting gold and silver to bottom? Any time frame? Wanting to get in as soon as they reach their lows.
English
Silver is at $71. Wave 3 ended at $121, and the correction has been continuing since then.
Wave W dropped to $55, wave X rose to $96. Now wave Y is in play. We expect a drop to the $55 range. That level is the bottom of wave 4.
The red trend line is sloping downward, and price hits this line and turns back on every rise. The uptrend will not begin unless this line is broken.
When wave Y completes at $55, wave 4 ends. Then the red trend line breaks and wave 5 begins.
Wave 5 target is $150.
A 23% drop from $71 to $55. A 173% rise from $55 to $150.
#XAGUSD #SILVER

Economic Office@Economic_Office
Silver target remains unchanged: $150. We explain simply: Silver has completed phase 3. Now it is making a correction in phase 4. This correction is progressing in a W-X-Y format: W is finished. X is finished. The Y wave is in its final part. When Y is completed, phase 4 will also be finished. What happens next? Phase 5 will begin. The target of phase 5: $150. #XAGUSD #SILVER
English

How to Budget Monthly an $90,000 Income (Married Couple with 1 Kid)
• Housing: $1,700
• Taxes (est.): $1,250
• Utilities: $500
• Groceries: $750
• Transportation: $550
• Medical: $600
• Child Expenses: $450
• Savings/Investing: $900
• Giving: $100
• Dining Out: $250
• Travel fund: $350
• Miscellaneous: $100
Monthly Total: $7,500
English
@Economic_Office Is it not going lower than that? I thought 3700 or even less
English
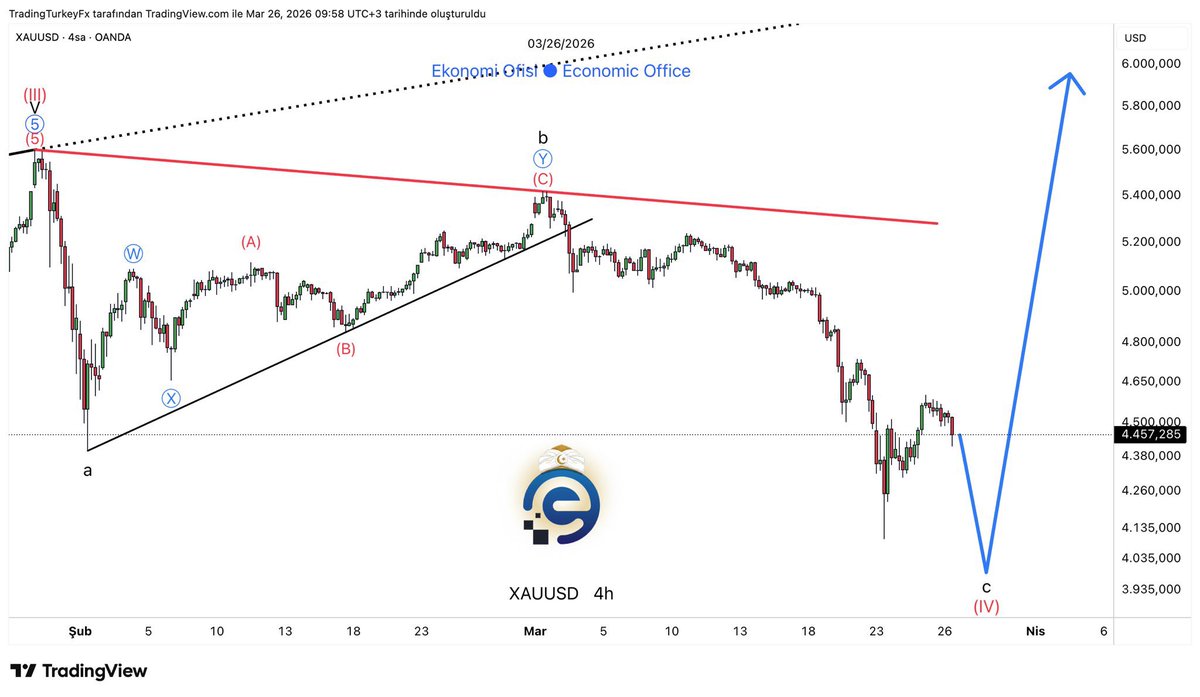
#XAUUSD #GOLD | H4 Analysis Update
Gold dropped from $5.415 to $4.100. A $1.300 loss and it’s not over yet.
We are in the final leg of the Wave IV correction. The c wave is in play, target is $4.000. That is the bottom point of the larger structure.
The decline from $5.415 occurred in three stages: first drop with (A), recovery with (B), now the final hit with (C).
Wave IV completes at $4.000. Then Wave V begins.
Wave V target is $6.000.
There is an 11% drop from $4.535 to $4.000. A 50% rise from $3.935 to $6.000.

Economic Office@Economic_Office
#XAUUSD #GOLD | H4 Analysis Update Has the decline in gold ended? After falling from $5,415 to $4,100, the price has recently recovered to $4,600. Is this a reaction or a reversal? The chart points to the final leg of the c wave. The $4,456 region is close to the wave (IV) bottom. From that level, wave (V) will begin. The target of wave (V) is $6,000. The current price is $4,456. Before the rise begins, another pullback may occur towards the $4,000 level. Then, from there, an upward move extending to $6,000 is expected to start.
English
@Economic_Office What do you see it dropping to? I've got around 57 for silver and maybe 3700 for gold but what are your thoughts?
English
#XAUUSD #GOLD | H4 Analysis Update
Gold is about to complete the c wave with one final drop. Then the target is: $6000.
a is complete. b is complete. Now the c wave is playing its final leg. Once the c wave is completed, the 4th phase ends. And the 5th phase begins.
The target of the 5th phase: $6000.
Economic Office@Economic_Office
#XAUUSD #GOLD | H4 Analysis Update Gold is about to complete the c wave. Then the target: $6000. Simply explained: Gold has been correcting since the top of the 3rd phase. This correction is progressing in an a-b-c format. a is completed. b is completed. Now the c wave is playing its final leg. Once the c wave is completed, the 4th phase ends. And the 5th phase begins. The target of the 5th phase: $6000. The structure is progressing according to the plan. The end of the correction is approaching.
English
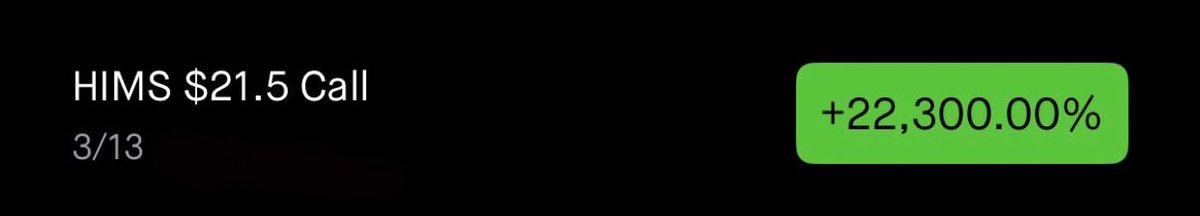
I’ve only seen this setup twice in 6 years. Rare setups age well…
The first time?
$1000→ $220,000 overnight.
The second? $5000 → $1,100,000 in less than a day. The third time is now.
Like + reply “$HIMS” and I’ll send it.
Clint Awana@clintoptions
$HIMS had an absolutely massive day! The stock is once again starting to show the early signs of life after a brutal downtrend. Here's my analysis going forward: 👇 Price has been basing around the 15 level for a bit now, and you can see volume starting to come in as buyers step up near that support. That spike in volume matters because it often shows accumulation rather than just random trading. Instead of continuing to make fresh lows, price is stabilizing and building a base. Its also the most volume we've had in a single day since late June of 2025. Momentum is also quietly improving. The MACD is curling higher and starting to flip up from deeply negative territory, which is usually one of the first signals that downside pressure is fading. The big thing to watch now is the descending trendline and the 50 EMA sitting around the 23 to 24 area. If price can push through that zone, it would be the first real breakout from the downtrend and could open the door for a move toward the 35 area where the 200 EMA sits. Right now the key story is simple. Support is holding, volume is showing up, and momentum is starting to turn. If that trendline finally breaks, this could turn into a pretty sharp move higher.
English