
Fang Wang
47 posts


6-18 stock watchlist
youtube.com/shorts/j2ZxloY…
Today is Thursday, June 18th — the final trading day of the week.
Market Overview – $QQQ
$QQQ is sitting right at yesterday’s high, a key decision level for the day.
Breaks above with strong volume: likely pushes to retest the previous high.
Rejects from yesterday’s high: momentum may fade, pulling price back toward $721.
$INTC
$INTC is approaching its all‑time high at $131.
Break & hold above $131: opens the path toward $150.
Reject from $131: expecting a pullback toward the $124 area.
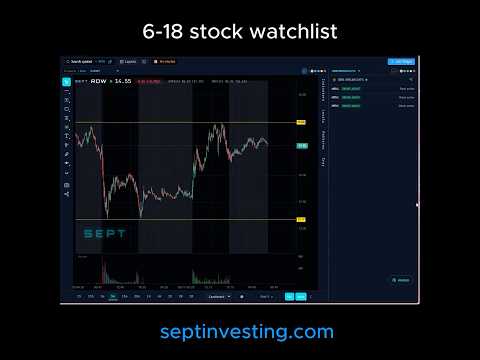
$RDW
$RDW is approaching key support around $13. I’ve set an alert so I won’t miss the move.
Break & hold above $15 (yesterday’s high): looking for upside continuation and a potential trend move.
Additional Opportunities
There are plenty of strong setups in the stock selection tools. For example, the OBR breakout section currently shows $MRVL near resistance — a clean breakout candidate if volume confirms.
Browse through these sections to find the highest‑quality setups that fit your structure‑based trading style.
YouTube
English
@septinvesting66 Agree, today's market is lack of momentum and just waiting for the news, so not too many good stocks to buy now
English
@fangfangwangUS yes. Agree. But Not too many good stocks to buy now.
English
$SOFI breakout at $17.73, if support $17.2 holds, watch for more upside movement, next resistance is $18.8, then $20, $22. Hopefully this is the end of its downtrend.

English
@Lilian11120981 @KotlinerBTC 是的,要么等 7 月 23 日的财报,要么中间可能突然爆出和某个大厂签了数据中心互联的合同,但近期走势可能比较无聊,像你说的,在等开盲盒
中文

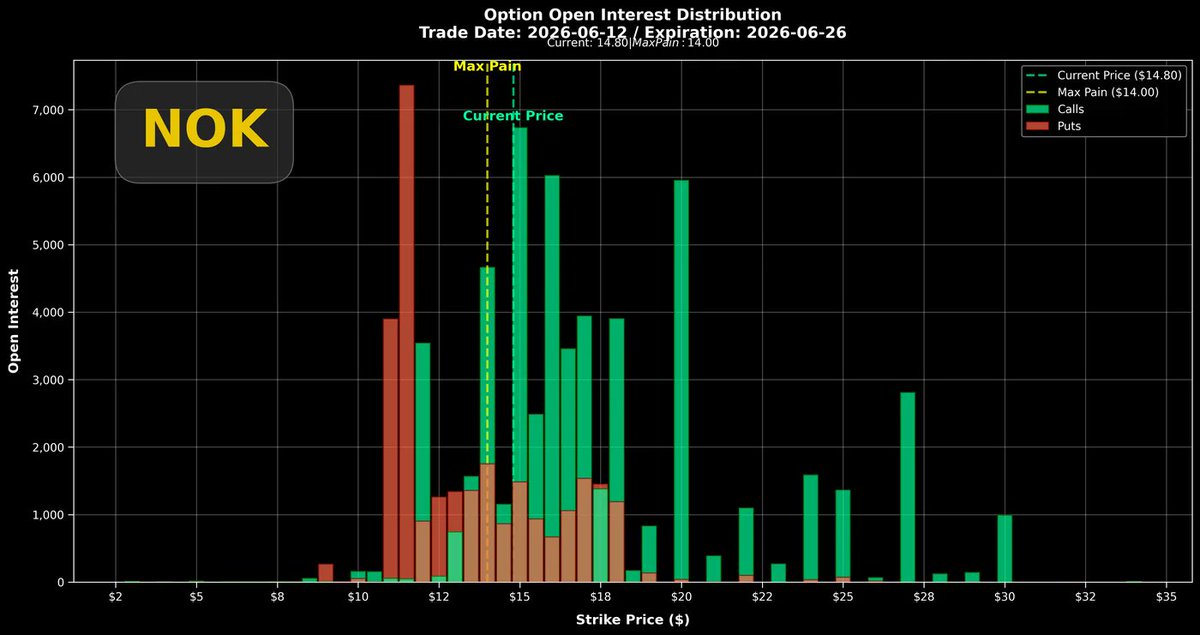
$NOK 引領期盼波動率能出現顯著反彈,以維持波動率上漲格局。
左上圖是近期的波動率走勢,從06/18到一個月後的07/10的期權,目前看來還是處在悲觀位置。昨天週五的交易中,$NOK的股價上漲5.04%,是相當不錯的單日上漲幅度,但是波動率依然沒有出現顯著反彈,意味著僅只是一天的5%上漲還未能夠吸引看漲期權的追價買盤。
右上圖是兩年來的隱含波動率,目前的位置依然接近上升通道的下邊緣。我上一篇分析文就指出,股價要維持強勢上漲,對這種量體比較小的個股,波動率不可能持續冷卻(大型權值股才有這種特性)。所以我的意見很清楚,股價要能重啟猛烈漲勢,波動率就必須在目前這個位置先出現一個清晰的反彈。
左下圖是股價報酬與波動率的相關性分析,由於$NOK稍早的數據受流動性因素干擾,我們僅針對近期的數據做判斷。今年五月之後,股價自13美元一度上漲到16美元。在這段上漲期間相關係數的位置處在相當高的正值,有意思的是紅色線(Put)的相關係數比綠色線(Call)高出不少。強的正相關係數意味著,每當股價出現顯著上漲,反而是看跌期權的追價買盤較積極。這種現象說明了,股價來到13美元以上後,怕跌的悲觀氣氛比追漲的樂觀氣氛強。
市場參與者,很可能對股價上漲不具信心,寧可在每一次上漲追價買看跌期權,以保護手中的利潤。
右下圖是06/26到期期權的倉位累積分佈圖,現在的股價14.80美元已經非常逼近上漲方向的第一個累積看漲峰(行權價15美元)。雖然說累積量接近7000口,對$NOK的上漲未必能起到阻礙,但是我們若看下跌方向,必須要到11美元位置才有顯著的看跌期權累積倉位。
總結: 仍未見到隱含波動率自低點振作,雖然最大痛點價格已經接近股價,但是如果能看到波動率回溫才能保住交易熱度,另外一個靜待的訊號就是相關係數回落。這兩條件具備了,我認為一個好的盈虧比投資機會才算到來。。


Curry_TW@KotlinerBTC
$NOK 右上圖是兩年來的隱含波動率,從大約三月底開始可以看到期權交易流動性正常的形態,從三月下旬開始 $NOK出現一個穩定的波動率上升通道,雖然振幅相當大但基本型態是穩定上升。 直到最近幾個交易日,波動率似乎要跌破這個通道了。 再看左上圖,這是近期 $NOK的隱含波動率,從這張圖最深紅色的曲線可以看到波動率依然保持震盪上升,但是06/18之後到7月初的期權似乎都有波動率做頭的跡象。 波動率持續衰退,往往伴隨著股價的動能也衰退,如果隱含波動率一直都沒有起色,那麼短期內股價難創新高。最近這兩三個交易日注意06/18期權的波動率非常關鍵,因為此刻的波動率就在上升通道的下邊緣,只要出現反彈那麼就能維持波動率上升通道一陣子。不過如果跌破這個上升通道,那就是宣告近期交易邏輯出現轉變,股價動能喪失,股價將持續整理甚至進入一定時間長度的緩跌走勢。 要讓隱含波動率上升,未必是需要多頭回來押注看漲,如果有大量的追價買盤建立看跌期權部位,對交易熱度的維持也是一種好事。 右下圖是本週五到期期權的波動率走勢圖,圖中的紅色虛線是看跌期權的波動率趨勢,自5月中到現在,$NOK看跌期權呈現一個穩定上升的趨勢,看漲期權雖然較早創下120%的近期新高,但$NOK看漲期權(Call)已經隱隱約約出現頭部型態。 我們期待下周(06/18)的期權,最起碼要能夠在看跌期權呈現更強烈的追價買盤,讓隱含波動率產生反彈效果。 左下圖是週四的單交易日中,期權倉位變動圖。原則上還是以看漲期權的交投比較熱絡,但是看漲期權的追價已經不明顯了,所以這些看漲期權的交易者買賣盤勢均力敵。我們可以在看跌期權看到異常的大量新增倉位,行權價設定在11美元與10美元。這兩個價位應該會是股價中期的關鍵支撐所在。 總結:沒有顯著的方向性,但是隱含波動率如果在最近兩個交易日內沒有出現明顯反彈,那麼股價將會進入整理期。
中文
@Fibonacci_TA They seem to be intentionally suppressing and accumulating right now. The play is to run it up right before the June 26 rebalancing, forcing passive Russell 2000 index funds to chase and buy their shares at peak prices
English

$ONDS (2W) — People have been losing their minds it seems with $ONDS, as the comments below my post got increasingly irritated towards the company.
But if you look at the chart we are just stuck in a range.
A volatile one? Hell yes. But a range nonetheless.
This can whipsaw you straight to the mental ward — but it helps knowing the boundaries and understanding that as long as we stay between $8 and $12.50, we are within that range, we are not breaking out, and we are moving sideways.
Things only change when we break out — either sub $8 or above $12.50.
> know those boundaries to keep your sanity.

Fibby.@Fibonacci_TA
$ONDS (2W) — The momentum bar below is telling us this is still a very bullish chart with lots of momentum. Meaning the range-bound action we are seeing right now has a higher probability of being a precursor to a larger breakout that is pending. Resistance is clear, support is known. Now it's just about your ability to see it through and muster up some patience. Breaking the $12 resistance unlocks $18 — and that's already a 100% move.
English
@KotlinerBTC 谢谢你非常及时的,剥开现象看本质的分析。我很赞同。看近期一个月的话,似乎买盘根本没有解放上方的远大抱负,大家只是挤在平值期权里做日内快进快出的投机。15 目前是个厚重的call wall,下周甚至继续下移,周五的反弹并不是一次break out。估计未来几周内都是箱体震荡。
中文
@Fibonacci_TA Yes, that dramatic change sounds very interesting! Thank you for highlighting that and Please do kindly share if you have any findings : )
English
@fangfangwangUS Yeah that looks healthier indeed! I’m trying to figure out how the flow switched up so quickly on $ONDS in just a day..
English
🌊 $ONDS (Algo Flow) — Bounced today, but flow didn't buy it.
Yesterday's read was: flow stayed calm during the -14% drop, recovery likely.
But the options market spent today selling into that bounce. Flow went from its peak of +300,000 mid-window all the way back to -175,000 by close — finishing more negative than it was at yesterday's low.
> price recovered some, but thetape didn't.
When options flow fades a price bounce in real time, it usually means the bounce is being used as an exit, not an entry.
The new level to watch: $11.06. That's today's low, and flow says it may get tested again.

Fibby.@Fibonacci_TA
🌊 $ONDS — Down -14% today and the options market already priced in the recovery. $ONDS had an almost identical crash mid-window — same size drop, same price level. Flow collapsed to zero alongside it. Then, flow recovered first, price followed. Today, price dropped the same amount. But flow never left ~750,000. It didn't collapse and recover — it just stayed there the entire time. That's the difference. Last time, the options market had to work its way back to 750,000 before the bounce happened. This time, it never left. The market is already positioned where it was right before the last recovery — without going through the panic first. Same destination. The tape skipped the panic.
English
@vax_chat @aleabitoreddit Yes, finally not about Sive any more... great to see more diverse topics
English

Just some random notes about $AVGO earnings transcript
- Revenue target reiterated ($100B+ 2027, pretty sure markets wanted that to be raised this earning, hence the drop)
Remember $NVDA Jensen comments about $MRVL $1T company around networking/connectivity/interconnects?
- “So as the TPUs continue to accelerate, there’ll be pressure overall on margins.
But the connectivity side, the AI networking side of the business has very rich margins”
“Demand for … networking is simply insatiable”
Also very positive read through as well for the $LITE and the other players. But for TPU margins it goes down at scale, which is understandable.
- “they are placing orders in fairly huge demand, which basically gives us a lot more visibility.. runs all the way to 2028 right now”
positive read through on overall AI demand since it’s 2026 now… and orders are out in 2028
- The initial order for 1 gigawatt, which includes XPUs and our networking has been received and will start Delivery in the second half of 2027. for our other two customers, we expect shipments to begin late 2026 and accelerate into 2027.
$META custom AI program h2 2027 timelines
- “Our revenue, our content per gigawatt will increase. you start putting a lot, you start putting embedding CPU cores into the same XPUs and making those chips basically multi die with lots of hvm.”
Just for the GW modelers.
- “For OpenAI we have delivered silicon and we are on track for production late 2026”
OpenAI custom program timeline
- “If you ask about 27 or 28 that will continue to grow. We expect in fact 28 to be a substantial growth from what we are forecasting in 27.”
More about the demand ramp, go brrr
- “Google, that we expect a diversity of sources from them”
Mediatek (2454) primary beneficary, maybe $MRVL. Already expected though Google doesn’t sole source so they don’t get bottlenecked.
There’s quite a lot of AI demand visibility way until 2028, which is bullish on the AI sector as a whole. Regardless, Broadcom ends the week +0% lol.
TLDR: Strongly bullish AI demand, especially networking. Stocks don’t move in a straight line up, but demand curves 2026-> 2027 -> 2028.


English

@fangfangwangUS @wave3trades Just research “borrow against appreciated assets” or more commonly known as “Buy Borrow Die”.
English

$ONDS BLOODY RED
Are you taking advantage?
Or freaking out and selling everything

English
@bjohnson2112 @wave3trades how to borrow against gains, could you share more insights on this, please?
English
@wave3trades Never sell your position. Borrow against your gains and don’t pay any income tax.
English
@Alpha_Cat 昨天Anthropic 也有好消息,奇怪DXYZ 为什么没有反应。I will be patient, still long on it
中文


@TheRealWolfff There was $90M+ in net premiums betting on the $100 strike calls for June/July/Aug. They did this because they knew holding the rights to buy $ASTS at $100 by that time would become extremely valuable. You know what that implies...
English

$ASTS less than 2 weeks before Space X IPO….
Personally, I dont see the company PR about BO and having 10+ launches booked with F9.
I do however, foresee us getting a PR on BB11-13 being ready to ship.
This us what will get $ASTS back to ATH and further towards during this mad month.
🐺
English
現股的資金流向?
現股沒有增發的前提下,流通總量是固定的。總量固定,但股價下跌要怎麼稱做是資金流入?
必須用tick級別的數據,判斷每一筆成交靠近買盤或是賣盤。前者被稱為流入,後者被稱為流出。
這和我們每天分析期權數據,分析波動率有點類似,但波動率的分析不是只有看現股成交價,從價內到價外是一個寬廣的價格帶都討論到,並且期權的波動率上升必須是新的資金買在靠近買盤價,持續推升價格才成立。
股價雖然多屬買在靠近買盤價,但是最終總體股價是下跌的,這種情況依然被定義為資金流入........
我還是偏好看期權的波動率來判斷,最起碼在期權市場是流入還是流出,因為那是真的資金跑進來和跑出去。
你有你對現股數據的觀察,而我這邊做的僅只有期權數據,我肯定有不足之處,但長期下來我認為自己這套還算管用。我沒有否定你的方法,我只不過對你的方法並不熟機而已。謝謝你提供的資訊。
中文
$ASTS 押注SpaceX IPO的多頭正在撤退。
Deutsche Bank分析師因此將 $ASTS從「Buy」降至「Hold」,目標價從$117下修至$106,因為「沒有New Glenn,ASTS很難在2026年達到衛星部署目標,可能延後半年左右」。
左上圖是近期隱含波動率趨勢,在這張圖中,我們可以看到第三個峰才是股價的主升段,但是第三峰的高度沒有強過第一個峰。這不是好現象,代表市場參與者的情緒正在疲乏。
有意思的是,在上週五的交易中,近期期權隱含波動率陡降,但是其他更遠期的期權波動率反而微升。火箭事件的影響,很可能被定調為僅限於短期。
右上圖是短期Put/Call波動率差值趨勢圖,從波動率差值更可以看到市場參與者的看漲氛圍持續降溫,最激烈的看漲訊號發生在05/18,當時股價正在上漲波段的前半場,之後股價繼續上揚,但押注做多的追價買盤持續降溫。
左下圖讓我頗感震驚,雖然藍色起源的火箭爆炸確實對整個產業都有不利影響,但是我以為押注SpaceX IPO議題的籌碼應該還是能夠相對穩固。但是從左下這張單日期權倉位變動圖來看,總數數千口的06/18看漲期權在上週五平倉出場。
我們必須密切注意下週一、二的交易,這些多頭有沒有回補,如果沒有甚至進一步平倉出場,那party就結束了。
右下圖是自四月初以來, $ASTS的看漲期權的每日倉位變動。這張圖讓我們挖到更細的資訊,其實不能全怪藍色起源的火箭爆炸事件,因為自05/22這個交易日開始已經有看漲期權在撤退。
對比05/11~05/21這十天,「價外看漲期權」全面湧入,每日開倉都很積極。直到05/22,行權價130/140的看漲期權最先開始出現撤退。
05/27開始平倉規模更加擴大。這些都發生在火箭爆炸案之前,火箭爆炸案發生後的第一個交易日(05/29),多頭持續平倉,甚至沒有再出現任何一個行權價有白熱化的看漲期權建倉。
總結, $ASTS的多頭氣勢消退,發生在火箭爆炸事件之前而且已經持續數日。
我可以給出一個清楚的結論,如果此時你想押注SpaceX IPO這個議題,那麼$ASTS不是一個好的押注標的,因為它的多頭已經提早獲利了結出場。


Curry_TW@KotlinerBTC
$ASTS 我們在連續兩個股價大漲的交易數據中,看到大量的多頭在期權市場中撤退,昨天是連續第三個交易日大漲(單日大漲13.075、盤後再漲2.87%)。 連三日大漲,多頭是不是認錯回補? 昨上圖是兩年來的隱含波動率,原本已經下降並且震盪的隱含波動率,在昨天的交易日中跳升,跳出了震盪的上邊界。 右下圖是zoom-in版的隱含波動率。綠色虛線代表看漲期權波動率,目前的波動率離上一次的極端值150%還有段距離,如果後續股價要持續上漲,我們需要看到波動率也跟著來到這個極端值。 右上圖則是Put/Call波動率差值,過去第一個和第二個股價大漲,因為多頭持續撤退導致Put/Call波動率差值與股價背道而馳,堅持要回到零線附近,直到昨天第三個大漲,終於將Put/Call波動率差值再一次朝負值摜壓,目前SpaceX IPO後的期權(06/18)具有最極端的負值,看漲期權波動率遠大於看跌,多頭的追價買盤回來了。 左下圖是期權最大痛點價格趨勢,這項資訊恐怕已經失效了。落入價內發生虧損的期權,賣家若早買入現股進行虧損鎖定,沒有平倉出場的必要,那麼期權的最大痛點價格就無法移動,很有可能保持這麼大的差距直到到期日。
中文


