FINX Analyst

48 posts

FINX Analyst

FINX Analyst

@finxanalysts

Katılım Mart 2026
24 Takip Edilen12 Takipçiler
FINX Analyst
FINX Analyst@finxanalysts·
@alphaticaio Thx that confirms the acceleration. Is the underlying series the percentage of stocks in your universe trading above session VWAP, meaning +4.5 is a 4.5 percentage-point breadth increase rather than SPY’s VWAP rising 4.5 index points? And what universe do you measure?
English
0
0
0
14
Alphatica
Alphatica@alphaticaio·
Good breakdown. Your math is right. The 30-minute measures total change over 30 minutes. The 15-minute measures the most recent 15. So yes: +4.5 over 30 minutes, +2.9 in the latest 15, means the prior 15 added +1.6. The recent window is moving faster than the earlier window. Accelerating. $SPY
English
2
0
3
184
Alphatica
Alphatica@alphaticaio·
Uptick is coming. VWAP VELOCITY ALERT: VWAP Vel: 15m:+2.9pts 30m:+4.5pts $SPY $QQQ
Alphatica tweet media
HT
9
0
27
3.7K
MikshuAlpha
MikshuAlpha@MikshuAlpha·
@zerohedge I flagged this in my 6 July pre-market note: “The leverage in Korean memory exposure remains the tail-risk.” The Korean AI/memory thesis wasn’t necessarily broken. The financing structure was fragile. Margin calls turned retail dip-buying into forced supply.
MikshuAlpha tweet media
English
2
1
15
4.1K
zerohedge
zerohedge@zerohedge·
As of July 13, 1.2 million Korean leveraged retail accounts triggered margin calls; of these, 320,000–360,000 accounts were fully forcibly liquidated by brokers (some had partial negative balances owed to brokers).
zerohedge@zerohedge

Retail Kospi investors bought everything foreign investors had to sell. But the retail party is ending: retail Margin Calls are soaring, hit 5% last Friday and on Monday will be far higher. Finally, retail brokerage deposits plunge by 30trn won to lowest level since feb 20

English
87
579
2.8K
1.5M
Alphatica
Alphatica@alphaticaio·
Fireworks into the close? 🎆🎇 The realistic range into the close: $742-$747. Green is the top end of that range. More likely is a partial recovery from the $741 low toward $743-$745 as the put decay kicks in, with the post-strip improvement showing up in Monday's morning scan rather than today's close. We are moving higher for now: VWAP Velocity: 15m:+5.1pts 30m:+5.9pts $SPY $QQQ
Alphatica tweet media
English
5
2
26
4.8K
Alphatica
Alphatica@alphaticaio·
🚨🚨 SPY ALERT | Thursday July 2, 12:10 PM $744.18. Down 0.21%. SPY reversed from $751.15 this morning to $744 by noon. A $7 intraday swing. Here's what happened and whether the regime changed. THE REVERSAL: 10 AM: $751.15, +0.72%. GEX +$657M. Falling wedge 0.35% from breakout. 12 PM: $744.18, -0.21%. GEX -$335M. Falling wedge 1.3% from breakout. A $991M GEX swing and a $7 price drop in two hours. The morning's approach to the $753 breakout reversed into a test of the $742 flip. WHAT HAPPENED: Two forces hit simultaneously. First: the July 2 OpEx strip. $599M of positive gamma was concentrated in today's expiring contracts. As those contracts approach expiration, the gamma drains. The morning's +$657M GEX included gamma that was always going to disappear today. The strip accounts for roughly $600M of the $991M swing. Expected mechanics. Second: pre-holiday thinning. Many desks are closed for the July 3-4 holiday. Volume is light. The -82.7M bearish flow and 2.96M new put positions that opened arrived into a thin order book. Same size flow on a normal session moves price $2-3. In holiday thinning, it moved price $7. IS THIS A REGIME CHANGE? NO. Five checks: Engine: +56.5M. Still positive. Not reversed. During the rebalancing week, the engine hit -29M. Today it faded from +84M to +56M. Weakened but not flipped. The forced-buying loop is still running. IV skew: -0.70% bullish. Calls still more expensive than puts. The institutions aren't panicking. They're hedging into a long weekend. Different behavior. GEX flip: $742. 0.2% below price. Tight but price is ABOVE the flip. During rebalancing, the flip was consistently above price. Today price sits on the edge but hasn't broken below. Magnets: 6 of 10. $750 (+$181M), $755 (+$106M), $760 (+$115M) still pulling from above. During rebalancing: zero magnets. Today: six. The upside architecture is intact. Premium: -$177M put-heavy at 45%. First put-heavy session since the recovery. But $1.05B of the put premium is concentrated in today's expiring contracts. The hedging is short-dated and expires at 4 PM. THE HOLIDAY LENS: The last full trading day before a three-day weekend amplifies everything. Institutions buy downside protection into long weekends as standard practice. The Iran MOU deadline is approaching in August. The Korean volatility headline added semiconductor hedging demand. These are rational pre-holiday hedges, not structural repositioning. The test: does the morning session Monday July 6 recover the way Monday June 29 recovered after the $716 flash crash Friday? If it does, today was holiday noise. If the selling persists into Monday, flag it. THE LEVELS: $750: magnet (+$181M, 0.8% above) $747: magnet (+$90M, 0.4% above) $745: accelerator (-$195M, AT PRICE) $742: GEX flip (0.2% below) $740: accelerator (-$138M, 0.6% below) $735: accelerator (-$122M, 1.2% below) The $742 flip is the line. Above it: suppression. Below it: amplification. Price at $744.18 has $2.18 of cushion. If $742 holds into the close, the structure enters the holiday weekend intact. If it breaks, the accelerators at $740 and $735 catch. The bottom line: holiday thinning amplified a normal OpEx strip and pre-weekend hedging into a $7 intraday reversal. The regime indicators (engine positive, skew bullish, magnets present, flip below price) say thinning, not transition. The structure weakened but didn't break. Monitor Monday. $744 is at price. $742 is the flip. $750 is the magnet. Monday is the test. $SPY $QQQ $IWM
Alphatica tweet media
English
4
3
37
5.9K
FINX Analyst retweetledi
MikshuAlpha
MikshuAlpha@MikshuAlpha·
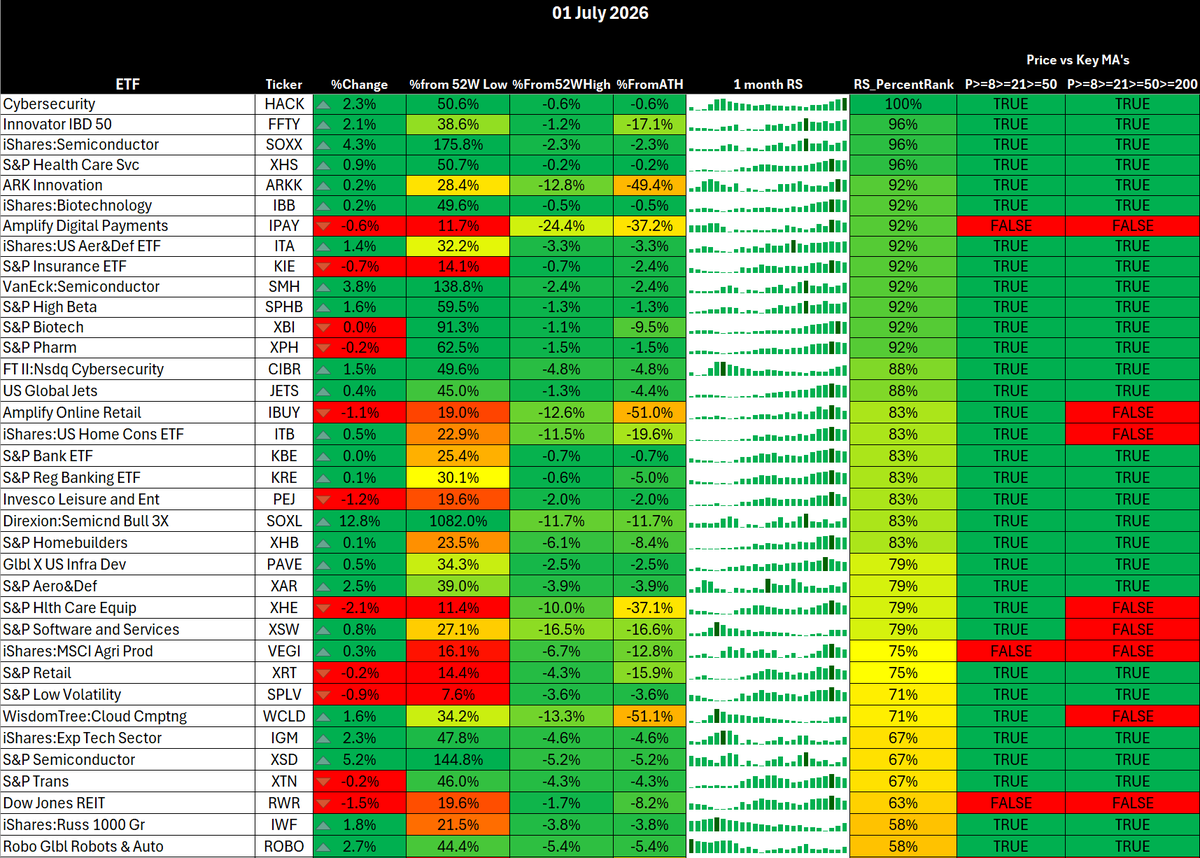
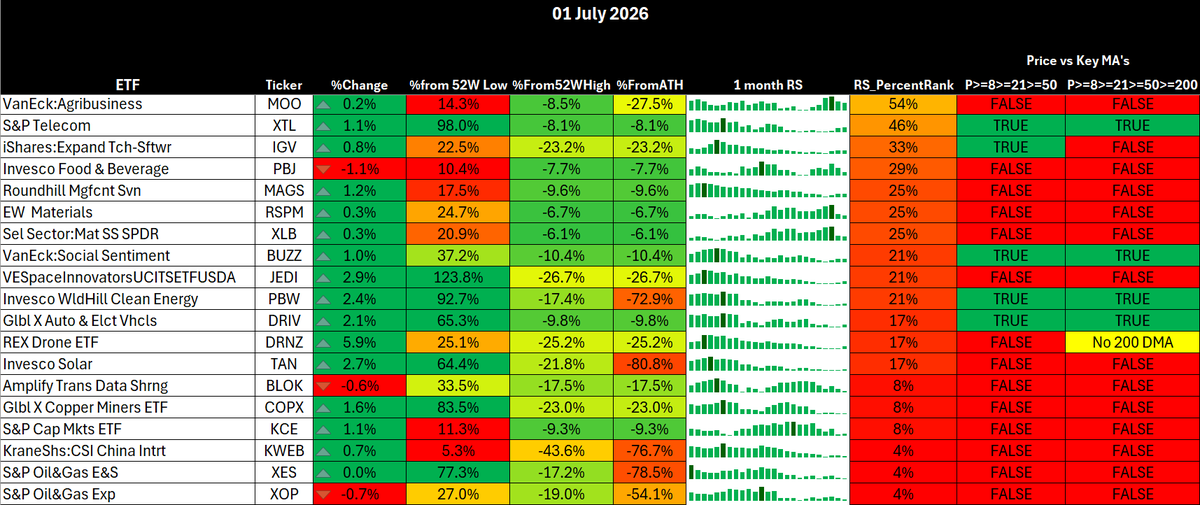
Pre-market analysis, Wednesday 1st July, 2026 1. Market Summary Yesterday was the confirmation session. I have been pressing the vanna-based upside setup since last Wednesday with $SPX roughly 150 points lower, and yesterday the mechanics fully played out: $SPX traded through 7,500, $SPY opened at 741.29, ground higher to 748.02, $VIX hit the 16-handle, and my $SPX call spreads ran roughly 600%. The point is not just that the market went up. The point is that the move followed the exact framework: put skew, gamma rebuild, quarter-end flows, megacap technical repair, and vol compression. Today starts Q3 with a constructive risk-on bias, but the entry quality is less clean after a 2-day squeeze. I still favour upside while $SPX holds the 7,450 to 7,415 zone, but I do not want to chase extended opens. Base case: 7,500 acts as the magnet, 7,550 is the first upside test, and 7,600 is live if semis lead and vol continues to compress. 2. Macro analysis US: the labour market is still not giving bears enough. May JOLTS came in at 7.594m, effectively 7.6m rounded, with Consumer Confidence at 91.2, up from 90.6 but with softer current labour-market perceptions. That keeps tomorrow’s NFP as the key event, especially wages. Strong payrolls with firm wages keeps the hawkish Fed repricing alive. Softer jobs or softer wages would add fuel to the vanna and vol-compression setup. Eurozone: manufacturing remains expansionary, with the June PMI at 51.4 versus 51.6 in May, still marking the strongest quarter since early 2022. The key macro read is that growth is holding while cost pressure is easing as oil comes off, which is supportive for global risk unless ECB/Fed rhetoric pushes rates back up. China: the private manufacturing PMI printed 51.7, only slightly down from 51.8, with Q2 the strongest quarter since late 2020. Output and new orders remain constructive, but export orders are still weak, so China is supportive for industrial and AI-linked demand, not yet a clean global demand boom. Japan: the BOJ Tankan showed large manufacturers at an 8-year high, with inflation expectations above target and capital expenditure strong. That keeps BOJ hike risk alive and makes USDJPY intervention risk relevant, especially with USDJPY so heavily bid at key resistance levels around 162 3. Momentum and breadth Breadth is supportive, not euphoric. Nasdaq stocks above the 5-day average are around 69, S&P tech breadth is around 72, Russell 2000 20-day and 50-day breadth are both in the high 60s, and $IWM is still flirting with all-time highs. That says the move has broadened beyond just one megacap pocket. The one caveat is that after two very strong sessions, risk-reward on fresh longs is less attractive. I want pullbacks into leadership, not random chasing. Best long setups should come from controlled dips in semis, cyber, industrials, AI infrastructure and selected healthcare, rather than buying every green candle at the open. 4. Volatility This is still the core of the trade. $SPX closed a tick under 7500 with GEX very positive, IV at 13.7%, and the gamma flip around 7,415. That is not just bullish, it is a fully restored positive gamma regime. The biggest institutional message was the large 7500 straddles sold right at spot which makes this level a heavily defended equilibrium, and the market is incentivised to mean revert unless spot breaks the gamma structure. My vol dashboard backs this up: $VIX is around 16.45, $VVIX near 89, $VIX1D around 11.6, and $VX2/$VX1 near 1.055. That is calm, not stress. The JPM collar roll also supplied large Sep upside vega around the 7,800 to 8,000 zone, which should keep a lid on implied vol unless tomorrow’s NFP shocks the market. Vol playbook: I still like short-vol expressions via $VXX puts on event-driven vol pops, not after a straight-line vol crush. A Warsh or NFP volatility spike that does not break 7,415 would be a gift. 5. Credit and liquidity Credit is confirming risk-on. $HYG has stabilised, HYG/TLT has bounced hard from the June lows, LQD/HYG is not showing stress, and $KRE remains in a strong uptrend. SOFR-IORB is sitting around flat to slightly negative, so there is no visible funding stress from the repo dashboard. The curve remains important. 2s10s has steepened back towards roughly -29.5 bps. That is not yet an equity problem, but if yields rise because labour data is too strong rather than growth expectations improving, the duration-heavy tech trade can wobble. For now, credit says buy dips rather than fade the tape. 6. ETF and Sector rotation ETF snapshot is constructive but selective. Top 5 by RS bucket: $QQQE +0.88%, $HACK +2.34%, $SOXX +4.30%, $FFTY +2.09%, $XHS +0.95%. Bottom 5 by RS bucket: $XLC -0.70%, $XLE -0.88%, $RSPC -1.20%, $RSPG -0.41%, $KWEB +0.70%. Energy and communication services remain the clearest laggard groups, with oil and China internet still not confirming broad leadership. Growth and cyclicals are leading. $SMH +3.78% and $SOXX +4.30% are high RS pockets with full MA confluence, which is exactly what I wanted to see if the AI/semis rotation was going to resume. $XLK +2.76% is also above key moving averages, while $XLI +1.35% remains one of the cleaner cyclical leaders. Defensives are split. $XLV is a genuine leader despite a red day and remains above key MAs. $XLU, $XLP and $XLRE are weaker, with staples and real estate below key MA stacks. That is a risk-on tell: the market is not hiding in defensives. Key watch: $SMH strong and above key MA's $XLK above key MA's $XLV strong and above key, $IWM continuing leader status and testing regularly testing ATHs - that is never the sign of a bearish market $IGV improving but still not a leader I note that $NVDA has recently sold off but the options surface stayed calm, put skew did not blow out, and vol was not aggressively bid. That usually points to seller exhaustion rather than a fresh downside impulse so I want to watch for rotation back into semis if $SMH holds yesterday’s breakout. 7. Summary Risk-on with a 7,500 pin. I favour long exposure above $SPX 7,450 and especially above the 7,415 gamma flip. The best expression is not chasing the open, it is buying controlled weakness in semis, AI infrastructure, cyber, industrials and the strongest healthcare names while vol remains compressed. Trade plan: long $QQQ or $SMH on pullbacks if $VIX stays below 17.5 and breadth holds. Add $VXX puts on any pre-july 4th volatility pop that fails to break the gamma structure. The short side only becomes attractive if $SPX loses 7,415, $VIX reclaims 18 to 19, and breadth rolls over. The cleanest read: yesterday proved my vanna mechanics thesis. Today tests whether the market can hold without quarter-end mechanical flow. If it can then 7,600 is the path. If it cannot, 7,415 is the line where the regime changes.
MikshuAlpha tweet mediaMikshuAlpha tweet mediaMikshuAlpha tweet media
English
1
3
8
1.4K
FINX Analyst
FINX Analyst@finxanalysts·
@alphaticaio 89% accuracy on any signal is a huge edge. Casinos thrive because they only need a 51:49 edge
English
0
0
0
21
Alphatica
Alphatica@alphaticaio·
@finxanalysts And remember we are using our own classification algorithm to detect the dark pool side. The hit rate is 89% accurate. That means 11% is not accurate. $SPY
English
1
0
2
301
Alphatica
Alphatica@alphaticaio·
UNUSUAL DARK POOL ALERT: | SPY SELL $125,203,213 NASDAQ Carte │ $125M $SPY sell. NASDAQ Carteret. The $SPY dark pool sell continues. Three of the last four sessions the dark pool sold $SPY. Yesterday: -$3.18B, the largest single-session $SPY dark pool sell of the series. Last day of Q2. Watching the tape. $SPY $QQQ
Alphatica tweet media
English
6
2
36
7.4K
Alphatica
Alphatica@alphaticaio·
$SPY Dark Pool flow has been bearish recently. We are thinking its profit taking or short covering. Time will tell.
English
3
0
15
2.8K
FINX Analyst
FINX Analyst@finxanalysts·
@alphaticaio For us dumb kids at the back of the class.... can you explain what that means please? What is VWAP velocity and what is it telling us that is useful in a practical way?
English
0
0
0
91
Alphatica
Alphatica@alphaticaio·
Bullish VWAP velocity reading. The mechanics underneath have to play out unfortunately. VWAP Velocity: 15m:+14.9pts 30m:+7.1pts $SPY $QQQ
Alphatica tweet media
English
3
0
20
4.2K
FINX Analyst
FINX Analyst@finxanalysts·
@TheBronxViking So they were buying the dip ahead of seasonal (pre-July 4th) bullishness which typically starts on 6/26 ?
English
0
0
0
118
FINX Analyst
FINX Analyst@finxanalysts·
@alphaticaio How does that translate into something pragmatic? $IWM selling on both tapes yesterday and it printed ATH's today for the 3rd time in 4 sessions. Today it's printing selling in the dark pool while printing ATHs and...... ????
English
0
0
0
43
Alphatica
Alphatica@alphaticaio·
🚨🚨 DARK POOL UNUSUAL PRINT ALERT 12:21 PM. | 12:21:06 IWM SELL $150,810,919 NASDAQ Carte | $150.8M $IWM sell just crossed off-exchange. NASDAQ Carteret. Small caps are the weakest exchange on the board. AMEX breadth 0.68x. Fifth consecutive session below 1.0x. VWAP at 34.2% in distribution. The dark pool $SPY pattern broke yesterday. Today a $150.8M small-cap sell crosses while breadth deteriorates. Yesterday both tapes agreed on $IWM sell (-$370M lit, -$130M dark). Today the dark pool is selling $IWM again. Watching the tape. $IWM $SPY $QQQ
Alphatica tweet media
English
6
2
18
4.4K
FINX Analyst
FINX Analyst@finxanalysts·
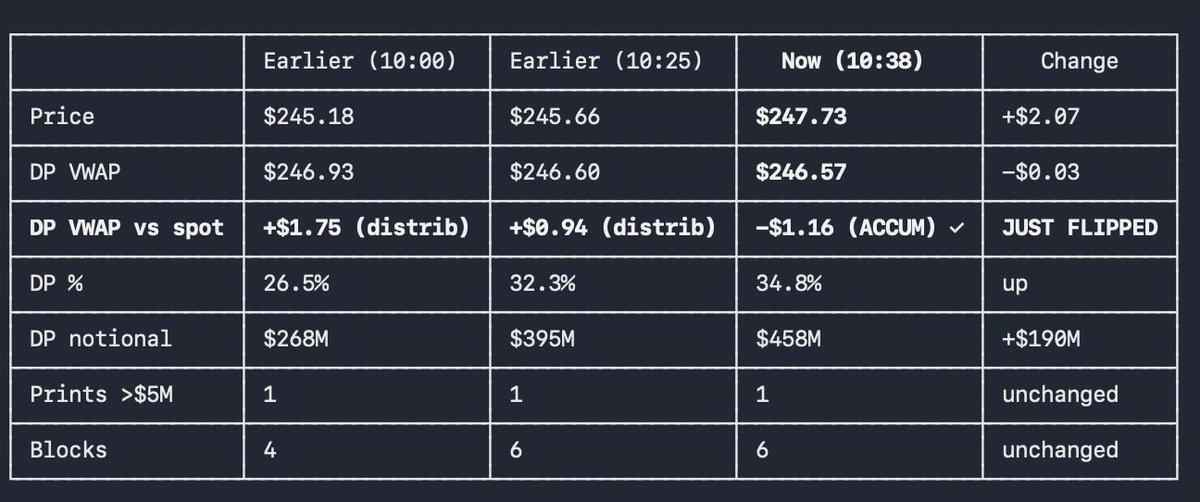
@alphaticaio Fair point. I didn't look into the OI concentrations... but the overall NCP vs NPP does not exemplify "under-the-hood" buying
FINX Analyst tweet media
English
0
0
0
13
Alphatica
Alphatica@alphaticaio·
Yes and no. Depends on WHERE the puts are being bought. Look at the put OI concentration: $550 (591K), $520 (535K), $600 (431K), $630 (368K). The heaviest put positioning is 15-30% below price. Those puts have delta near zero. A $550 put on a $736 stock barely moves the dealer's hedge book. The dealer sells maybe 5 shares per contract, not 50. You're right that negative GEX plus put buying equals downward dealer pressure. But the magnitude depends on the strike distance and the open vs close ratio. Today the puts are far OTM and partially closing. The delta math nets bullish despite the headline put volume. $SPY
English
1
1
2
251
FINX Analyst
FINX Analyst@finxanalysts·
@alphaticaio True, but if we're in negative GEX and there's a MUCH higher number of puts being bought then surely there's downward pressure on price from dealer delta hedging?
English
1
0
1
49
Alphatica
Alphatica@alphaticaio·
What's happening: put VOLUME increased (more contracts trading, more total dollars). But put PRICES fell relative to call prices (skew flipped). More puts are trading at cheaper relative prices while fewer calls are trading at more expensive relative prices. The market is buying more puts but paying a premium for the calls it does buy. Think of it as: the volume went to puts, the conviction went to calls. Lots of put activity at wider strikes for cheaper premiums (institutional hedging, rolling, quarter-end protection). Concentrated call activity near the money at higher relative IV (directional positioning). The delta flow confirms the skew read over the premium read. +15.7M shares of long delta added means the NET directional positioning shifted bullish even as total put dollars grew. Directional intent favored calls. Hedging volume favored puts. Both happened in the same session. $SPY
English
1
1
1
257
Alphatica
Alphatica@alphaticaio·
SPY UPDATE | Tuesday June 23, 2:10 PM $736.04. Down 1.12%. The price is falling. The positioning underneath is going the other direction. Here's the divergence. THE SURFACE: Price: $736.04. Down 1.12%. Third consecutive session of selling since the quarter-end rebalancing started. GEX: -$1,730M. The most negative reading since the June 10 cold CPI selloff (-$2,021M). Zero magnets in the top 10. $735 accelerator at -$250M, the single largest accelerator we've ever published. Max pain at $735, 0.1% below. Price is sitting on it. THE POSITIONING: Flow: +15.7M bullish. Was -2.8M bearish this morning. Flipped. $1.31B in call premium. 3.63M new call positions opened. The institutions are buying the dip while the price falls. IV skew: -1.18% bullish. Was +0.78% bearish this morning. Flipped. Calls more expensive than puts on a -1.12% down day. The options market is paying for upside, not downside. Dealer delta: -3.3M. Was -19.0M this morning. Approaching zero. One session of positive positioning flips the engine back to buying dips. Composite: -13.1 Neutral. Was -52.3 Strong Bearish this morning. A 39-point improvement while price fell another 0.26%. The structural read is diverging from the price action. THE PATTERN: June 9: -203M record bearish flow. Composite -51.9. Price at $724.83. June 10: Flow still bearish. CPI cold. Market sold off on good news. June 11: Flow flipped bullish. Composite improved. Price still weak. Then: Trump called off attacks. Recovery was violent because positioning was already in place. June 22: -54.9M bearish flow. Composite -7.1. GEX flipped negative. June 23 AM: -2.8M flow. Composite -52.3. Engine reversed. June 23 PM: +15.7M flow. Composite -13.1. IV skew flipped bullish. Engine approaching zero. The same sequence. Price deteriorating while positioning quietly improves underneath. The June recovery needed a catalyst (geopolitical de-escalation). This setup needs one too. MU EARNINGS TOMORROW: MU reports after the close Wednesday. The first major semiconductor earnings since the selloff. The AI capex thesis on trial. If MU beats and guides higher, the semiconductor demand narrative holds. The positioning that's building underneath meets a fundamental catalyst. The recovery setup is loaded. If MU misses, the structural weakness compounds with a broken demand narrative. The positioning unwinds. The accelerator chain from $735 to $700 fires. THE LEVELS: $746 is the flip. Above it: positive gamma, suppression returns. $736 is at price. Sitting on max pain. $735 is the largest accelerator at -$250M. $730: -$121M (0.8% below) $725: -$109M (1.5% below) $720: -$120M (2.2% below) $600M of accelerators within 2.2% below. The downside chain is loaded if $735 breaks. The counterforce: +15.7M bullish flow, bullish IV skew, engine approaching zero, vanna at +116.7K loaded for IV compression. The recovery infrastructure is building beneath the bearish surface. Price is falling. Positioning is building. The catalyst determines which one wins. MU tomorrow after the close. $746 is the flip. $736 is at price. $735 is the accelerator. $720 is the wall. MU tomorrow. $SPY $QQQ $IWM
Alphatica tweet media
English
5
2
25
4.7K
Alphatica
Alphatica@alphaticaio·
We will wait till this afternoon for any short-term bearish reading. Dark Pool is net green. They are buying both $SPY and $QQQ in the dark pool right now.
Alphatica tweet media
FINX Analyst@finxanalysts

@alphaticaio So is this indicating near-term bearishness, or has a signal not yet fired?

English
4
1
48
5K
FINX Analyst
FINX Analyst@finxanalysts·
@alphaticaio So is this indicating near-term bearishness, or has a signal not yet fired?
English
0
0
1
3.5K
Alphatica
Alphatica@alphaticaio·
SPY OPEN | Tuesday June 23 $737.97. Down 0.86%. The dealer engine reversed. Four of five topping conditions are now active. The most bearish structural reading since the June 9 selloff. THE ENGINE REVERSED: Net dealer delta: -19.0M. Was +45.8M yesterday afternoon. Was +73.2M yesterday morning. The engine that buys dips flipped to selling dips overnight. Dealers are now long shares, selling into weakness. The same regime as June 9 when SPY hit $724.83. THE FIVE CONDITIONS: 1. Floor narrows: YES. Flip at $746, 1.0% above price. Price is below the flip. 2. Fuel thins: YES. Engine reversed from +73M to -19M in 24 hours. 3. Correlations spike: NO. Scanner read 1.0-1.5/10 green yesterday. 4. Rebuilds fail: YES. Monday's bounce from $749 faded to $744, now $738. 5. Magnets disappear: YES. Zero near-term magnets. Nine of ten top levels are accelerators. 4 of 5. The highest reading of the entire cycle. During the Iran selloff this peaked at 2.5/5. The quarter-end rebalancing pushed it past that in two sessions. The one condition holding: correlations. The cross-sector scanner says the selling is dispersed, not systemic. Different sectors are selling for different reasons (pension rebalancing, duration repricing, forced mechanical flows). Until correlations spike, this is mechanical deterioration, not market structure breaking. THE STRUCTURE: GEX: -$1,604M. Nearly doubled from -$818M yesterday. Approaching the FOMC-day record of -$969M and the June 9 record of -$2,021M. Composite: -52.3 Strong Bearish. The most extreme reading since the June 9 selloff. Zero magnets in the near-term top 10. The entire chain is accelerators: $740: -$139M (0.3% above) $735: -$209M (0.4% below, largest, at price) $730: -$117M (1.1% below) $729: -$55M (1.2% below) $725: -$116M (1.8% below) $720: -$132M (2.4% below) $715: -$50M (3.1% below) $710: -$92M (3.8% below) $700: -$81M (5.1% below) $991M of accelerators within 5% below. One magnet in the entire top 10 at $800 (+$66M, 8.4% above). The structure is almost entirely downside amplification. Max pain: $735. 0.4% below price. Approaching. The expiration gravity that's pulled toward $735 all cycle is now within striking distance. IV: 18.1%. Spiked from 15.9% yesterday. The vanna at +151.6K is the largest supportive loading since the FOMC recovery. When IV compresses, this fires and dealers buy. But IV needs to stop rising first. THE ONE POSITIVE: Puts are closing, not opening. 494.9K put closing volume vs 279.8K opening. The institutions are taking profits on puts from the last two weeks, not adding new ones. Premium is still 63% call-heavy. The flow is bearish but the money is still favoring calls. This is the same split we saw June 11 before the Trump de-escalation recovery. Structural bearish, flow mixed, puts unwinding. The catalyst is missing. The Iran recovery had Trump calling off attacks. This rebalancing has no catalyst to reverse it. The selling is calendar-driven through June 30. GOOD NEWS CAN'T LIFT IT: Flash PMIs just printed. Manufacturing 55.7 vs 54.2 consensus. Highest since May 2022. Services 51.3 vs 51.2. Both beat. Both accelerating. The economy is expanding. SPY is down 0.86%. Same dynamic as June 10 when cold CPI produced a 1.21% selloff. Good economic data can't lift a market absorbing $165B of forced institutional selling. The mechanics override fundamentals until the mechanical flow exhausts. The PMI internals are mixed underneath the beats. Employment fell for the second straight month. Selling-price inflation at an 11-month high. Supply chains worsening from Middle East disruptions and tariffs. The headline says expansion. The details say growth accelerating while employment contracts and inflation stays elevated. THE MECHANICAL READ: The earnings picture hasn't changed. No major misses. No guidance cuts. The AI capex thesis is intact. Nothing fundamental justified a move from +$1.15B GEX to -$1,604M in eight sessions. What changed: the quarterly OpEx stripped the cushion. The dot plot elimination repriced rate uncertainty. $165B of pension selling started flowing through a structure with zero buffer. Three mechanical forces. Zero fundamental catalysts. The selloff is plumbing, not earnings. QUARTER-END DAY TWO: 7 trading days remain. The structural deterioration from day one to day two: GEX -$50M → -$818M → -$1,604M. Two days of rebalancing flow doubled the negative gamma each session. MU earnings tomorrow is the mid-week catalyst. $746 is the flip. $738 is at price. $735 is max pain. $720 is the accelerator wall. 7 days to June 30. $SPY $QQQ $IWM
Alphatica tweet media
English
4
0
21
4.7K
FINX Analyst
FINX Analyst@finxanalysts·
@alphaticaio Do you take requests? What do you think of $ARM? Very bullish options flow, vol surface skewed for upside, great technicals, news/earnings narratives hugely positive....
English
0
0
1
204
Alphatica
Alphatica@alphaticaio·
$IBM Update (3) Accumulation just emerged. We might do something like this if it was us: #1: Bull Call Spread $250/$260 (6/26 expiry, 8 days) BEST R/R │ Leg │ Action │ Strike │ Price │ │ Buy │ Call │ $250 │ $4.58 │ │ Sell │ Call │ $260 │ −$1.70 │ │ │ │ Net debit │ $2.88 │ - Max profit: $10.00 − $2.88 = $7.12 per share - Max loss: $2.88 per share - Breakeven: $252.88 - R/R: 2.47:1 - Required move: +3.5% just to break even, +5.8% to max profit Best for: Quick mean-reversion bounce captured in next 8 days. Defined risk. Captures recovery to the pre-ACN gap area. ****NOT INVESTMENT ADVICE********
Alphatica tweet media
English
4
1
21
2.2K
FINX Analyst
FINX Analyst@finxanalysts·
@alphaticaio Trying to understand this in context: $IWM , $QQQE, $RSP are all positive, so how can today's gains be purely megacap-driven?
English
1
0
1
109
Alphatica
Alphatica@alphaticaio·
MORNING INTERNALS | 11:05 AM ET Nasdaq +1.38%. Volume 0.29x. The most extreme sell-volume skew of the series. Quarterly OPEX. The index lies. Quarterly OPEX day. The day after hawkish Warsh. VWAP hit 18.3% yesterday. The lowest in fifteen weeks. Today the volume ratio hits 0.29x. The lowest in fifteen weeks. Back-to-back record lows on back-to-back catalysts. Nasdaq +1.38%. S&P +1.02%. Dow +0.46%. Oil -3.4% to $74.15. A/D ratio: 0.82x. 2,602 declining vs 2,125 advancing. Volume ratio: 0.29x. Down volume $7.32B vs up $2.09B. 48.3% above session VWAP. NYSE: 1.12x | Nasdaq: 0.69x | AMEX: 0.65x Volume at 0.29x. For every dollar buying, $3.50 is selling. The previous lows were 0.43x (June 5 chip selloff and June 9). Today obliterates both. The most extreme volume skew the engine has recorded. The indexes are green. The volume says sell. $7.32B in down volume vs $2.09B in up volume. The money behind the sellers dwarfs the money behind the buyers. But the indexes are up 1-1.4%. The entire advance is mega-cap names being repositioned for quarterly OPEX. The gamma cliff concentrates volume in the names with the largest open interest. The mega-caps surge while everything else sells. Nasdaq +1.38% while Nasdaq breadth 0.69x. 59.2% of Nasdaq-listed stocks are declining. The index surges because the handful of trillion-dollar names that dominate the weighting are moving. The average Nasdaq stock is selling. AMEX 0.65x. Small caps selling harder than the tech exchange. NYSE 1.12x. The old economy barely holds positive. Two of three exchanges are negative while all three indexes are green. VWAP at 48.3%. Below neutral. Yesterday ended at 18.3%. Today recovering to 48.3% but still below the 50% line. The VWAP velocity at +1.0pts (15 min) and +3.1pts (30 min) shows slow recovery, not accumulation. Oil at $74.15. Below $75. WTI from $96 to $74 in thirteen sessions. A 23% decline. The Iran peace trade continues to push oil lower. Earlier today we flagged $2.19B in $SPY dark pool buys in the first 18 minutes of the session. The dark pool is buying the indexes while sell volume runs 3.5:1 against. The same pattern. The dark pool on one side. The volume on the other. Quarterly OPEX. The gamma cliff. The indexes tell you one thing. The internals tell you another. Fifteen weeks. The divergence thesis in its most extreme volume form. Watching the tape. $QQQ $SPY
Alphatica tweet media
English
3
1
20
2.4K
FINX Analyst
FINX Analyst@finxanalysts·
@alphaticaio This is ENORMOUSLY helpful, thank you for taking the time to respond in detail!
English
0
0
1
47
Alphatica
Alphatica@alphaticaio·
To answer your question it's bullish. Here's the simple version. When the lit tape (public market) is selling and the dark pool (off-exchange, institutional size) is buying the same name at the same time, the large institutions are accumulating while the public sells. In fifteen weeks of data (we have tracked on this platform), the dark pool has been on the correct side of the move more often than the lit tape when the two disagree. Last week (post below) our algorithm tracked 9 individual name signals. 7 were correct. The sell signals were 3 for 3. When the dark pool buys into a sell, it's not a guarantee. But it's the side of the trade that's been right 78% of the time in our data. The short answer: follow the size, not the noise. $SPY $QQQ x.com/alphaticaio/st…
Alphatica@alphaticaio

WEEKLY DARK POOL RECAP | June 8-12, 2026 "You can't classify direction in dark pools." We heard it (many times). Here are the receipts. Our direction classification algorithm produced 9 individual name signals this week across 1,809 off-exchange prints ≥$5M. We measured every signal against the actual return for the week ending June 12. Signal accuracy: 7 out of 9 correct direction (78%). Sell signal accuracy: 3 out of 3 (100%). Buy signal accuracy: 4 out of 6 (67%). ALPHATICA BUY SIGNALS vs ACTUAL RETURNS $INTC Signal: BUY Net: +$518M Return: +25.6% ✓ $MU Signal: BUY Net: +$230M Return: +13.6% ✓ $TSLA Signal: BUY Net: +$213M Return: +3.9% ✓ $NVDA Signal: BUY Net: +$712M Return: +0.04% ✓ $GLD Signal: BUY Net: +$634M Return: -2.4% ✗ $AAPL Signal: BUY Net: +$525M Return: -5.3% ✗ $INTC: our algorithm classified +$518M in cumulative dark pool flow as institutional buying. The stock returned +25.6%. By Friday, $INTC had +$743M in dark pool buys with zero sells and +$1.97B on the lit tape with $8M in sells. Both venues. Zero opposition. The algorithm identified the accumulation. The return confirmed it. $AAPL: our algorithm classified +$525M as institutional buying. The stock declined -5.3%. The signal missed. We show it. The reason for the selloff WWDC. We expect $AAPL to move higher from here. $GLD: +$634M classified as buying. A new position being built across two sessions. Gold declined -2.4%. Whether the dark pool was early or wrong is a question for this upcoming week. ALPHATICA SELL SIGNALS vs ACTUAL RETURNS $META Signal: SELL Net: -$700M Return: -4.4% ✓ $GOOGL Signal: SELL Net: -$424M Return: -2.4% ✓ $NFLX Signal: SELL Net: -$250M Return: -2.2% ✓ 3 out of 3. Every name our algorithm classified as institutional selling declined. $META: -$700M across three appearances, all classified as sell. Down -4.4%. $GOOGL: -$424M, mostly sell. Down -2.4%. $NFLX: -$250M in a single session with zero dark pool buys. Down -2.2%. The sell signals were perfect. When the algorithm flags persistent selling with zero or near-zero buyer interest, the name declined every time this week. INDEX SIGNALS: STRUCTURAL HEDGING $SPY Signal: HEDGE Net: -$2.76B Return: +0.57% $QQQ Signal: HEDGE Net: -$1.47B Return: +2.31% $IWM Signal: HEDGE Net: -$2.36B Return: +4.01% The algorithm detected institutional hedging at the index level. The dark pool sold all three indexes for the week while all three rose. This is not a miss. This is risk management. The institutions bought individual names ($INTC +25.6%, $MU +13.6%) and hedged broad market exposure off-exchange. The index selling funds the individual name buying. Different function. Different interpretation. WEEKLY SCORECARD Signal accuracy: 7/9 (78%) Sell signals: 3/3 (100%) Buy signals: 4/6 (67%) Biggest hit: $INTC +25.6% on buy signal Biggest miss: $AAPL -5.3% on buy signal We publish every signal in real time. We validate every signal against the actual return. We show the $INTC hit and the $AAPL miss. We show the $META sell that worked and the $GLD buy that didn't. "You can't classify direction in dark pools." 78% says otherwise. 100% on sells says otherwise. The receipts are on the timeline. Every day. Every week. The algorithm works. The tape doesn't have an opinion. It has a receipt.

English
2
0
5
553
Alphatica
Alphatica@alphaticaio·
Quick note. The indexes are selling this morning. The dark pool is buying $SPY. You've seen this pattern before. The dark pool bought indexes on five of the last eight sell sessions. The lit tape sells. The dark pool accumulates. FOMC decision tomorrow. We'll have the full internals, rotation, and flow data in normal sequence. For now: the dark pool is active on the buy side of $SPY while the surface sells. Watching the tape. $SPY $QQQ
Alphatica tweet media
English
4
2
63
7.3K