Goldfish Trader

83 posts

Goldfish Trader banner
Goldfish Trader

Goldfish Trader

@goldfishtrader

Swing trader, aka 'The Goldfish’. I move fast past wins & losses, focusing only on what's next. Sharing market insights (NOT FINANCIAL ADVICE).

Katılım Haziran 2021
5 Takip Edilen3 Takipçiler
Goldfish Trader
Goldfish Trader@goldfishtrader·
@elteslaengineer @MarketMike Saying its flat after earnings came out already when price is flat is not a call. Thats just stating exactly whats currently going on. Hahahahhah this guy is not real
English
1
0
1
62
El Tesla
El Tesla@elteslaengineer·
@MarketMike I called flat. NVDA went flat. You’re now mad that I explained why the EM doesn’t contradict that. Backtracking from what, exactly?
English
2
0
0
65
Mike
Mike@MarketMike·
This is the LARGEST company's earnings event in history. $NVDA rocking a 5.4T Market Cap. The expected move is about +-13.55 (white lines). Other levels of interest are the orange lines, which are the weekly expected moves.
Mike tweet media
English
8
3
54
8.7K
TT3
TT3@TradingThomas3·
Investors are flooding out of cash to buy stocks. That bull capitulation is a sell signal, according to BofA’s Hartnett.
English
16
17
319
19.5K
El Tesla
El Tesla@elteslaengineer·
@MarketMike An expected move is a ±1σ band, not a forecast. NVDA AH is sitting between your own white lines, that IS the EM being respected. You posted the proof and called it a counterargument. Impressive work.
English
2
0
0
74
J.C. Parets
J.C. Parets@JC_ParetsX·
As a trader or investor of any time frame, do you think now is a time to do more or do less?
English
37
0
47
10.7K
JLoc
JLoc@JohnLoc18·
$SPY potential rising wedge is forming on hourly chart, nfa.
JLoc tweet media
English
51
13
119
23.2K
Goldfish Trader
Goldfish Trader@goldfishtrader·
@TotemMacro @MarketMike He didn't say it was the most extreme ever... What are you talking about? You picked a fight with the wrong person about the wrong post for no reason. Smmmmaaaaarrrttttt
English
0
0
1
11
Whitney Baker
Whitney Baker@TotemMacro·
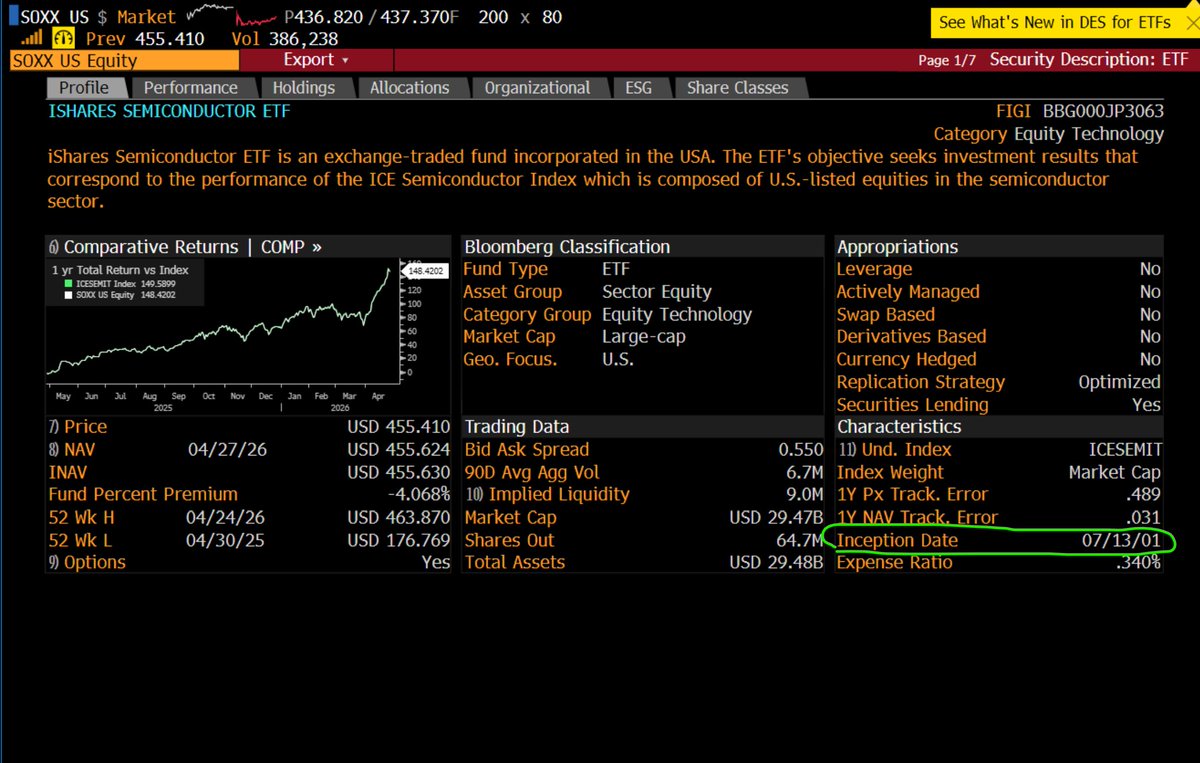
@MarketMike In fact the index you chose (for some reason b/c no one uses it) wasn't even incepted until 2001. Looks to me like it's spliced back with SOX, but regardless your point that it's the most extreme divergence ever is simply not true, and the chart conveniently omits the bigger one.
Whitney Baker tweet media
English
2
0
4
544
Mike
Mike@MarketMike·
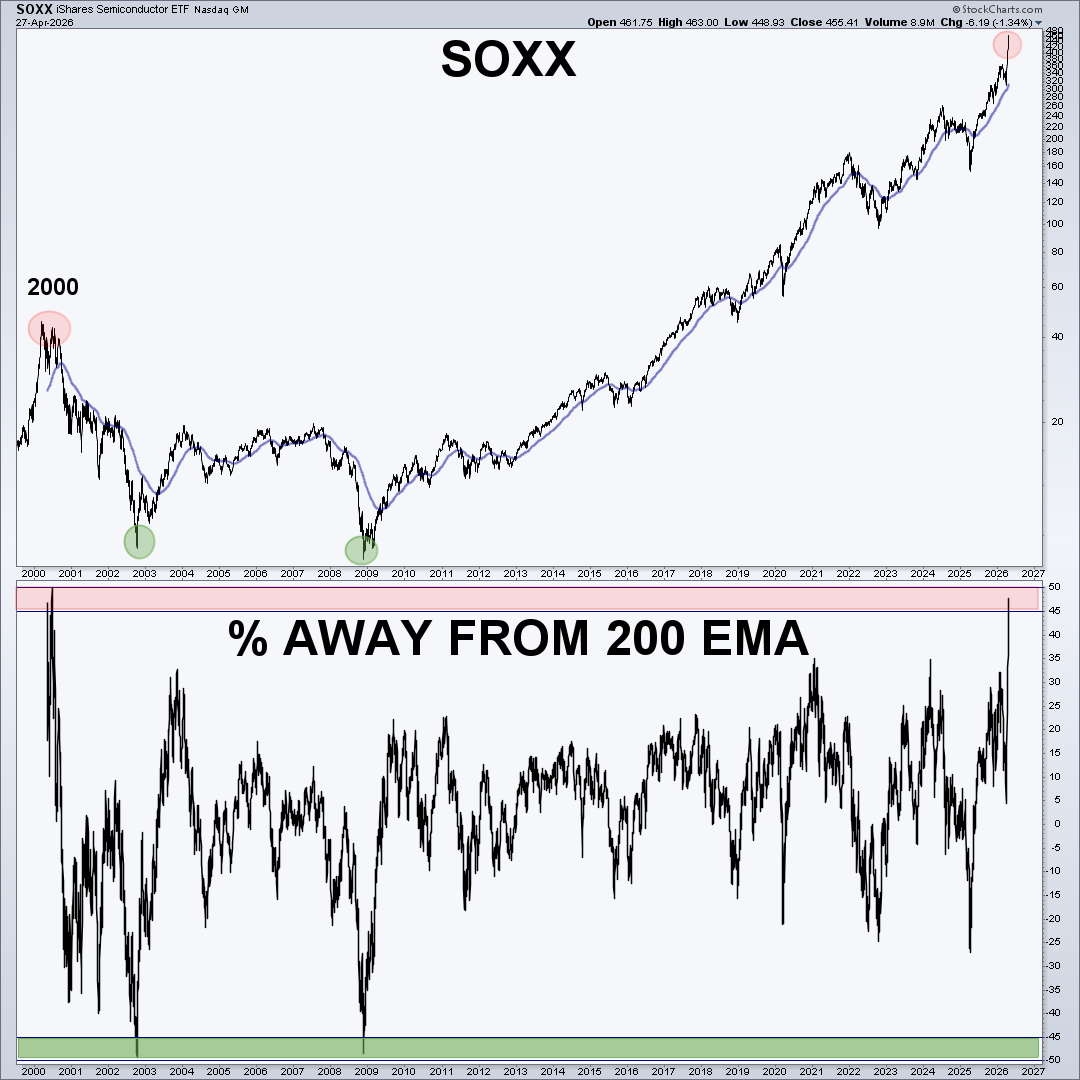
Everyone is in shock of the recent run in semiconductors. Rightfully so. Take a look at just one way to measure how extended it's gotten. The only other time $SOXX was this far from its 200 EMA was 2000. Markets don't stay disconnected forever. They catch up through time, or through price.
Mike tweet media
English
39
77
405
33.5K
Goldfish Trader
Goldfish Trader@goldfishtrader·
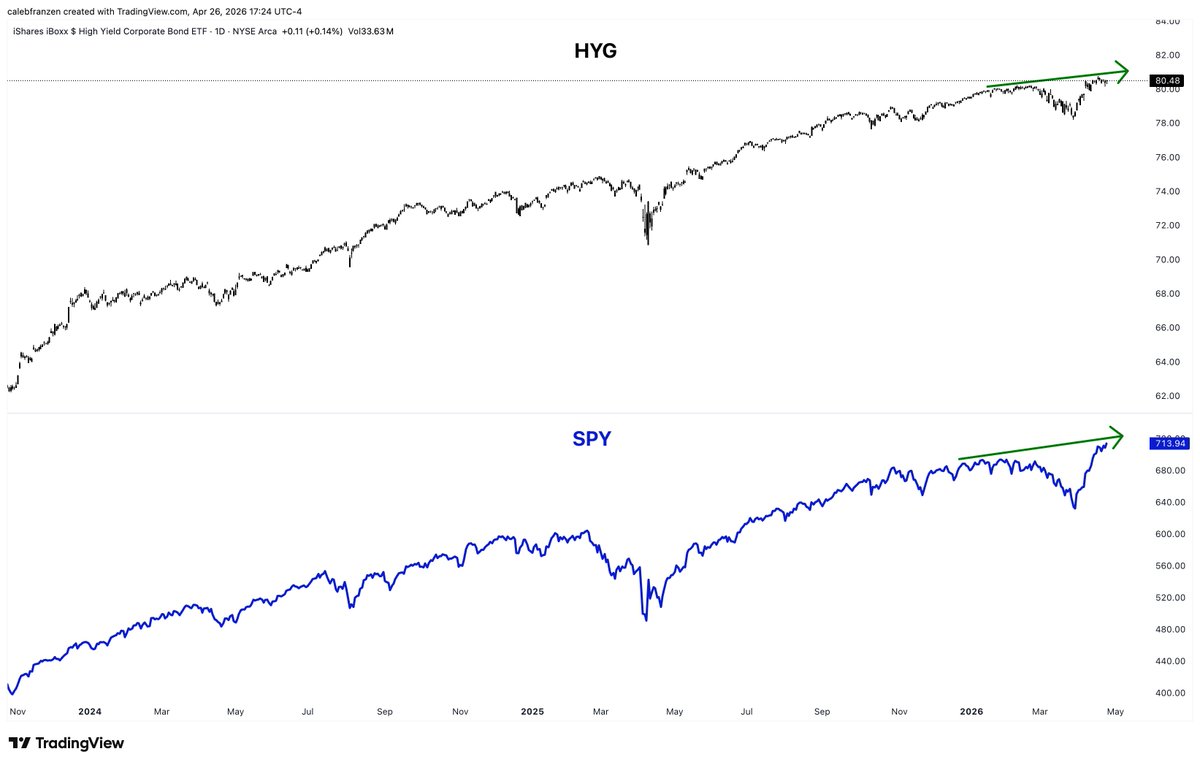
@CalebFranzen @MarketMike His chart is adjusted for dividends. If it was unadjusted there would be an underscore infront of the ticker for Stockcharts like this _HYG. Ur chart is the same as his but you are highlighting a different period in time and using a different timeframe. You look like an asshat
English
0
0
1
84
Caleb Franzen
Caleb Franzen@CalebFranzen·
@MarketMike Hey rookie, adjust $HYG for the dividend distribution. Otherwise your "analysis" is 100% pointless. You're welcome.
Caleb Franzen tweet media
English
8
1
24
29.1K
Mike
Mike@MarketMike·
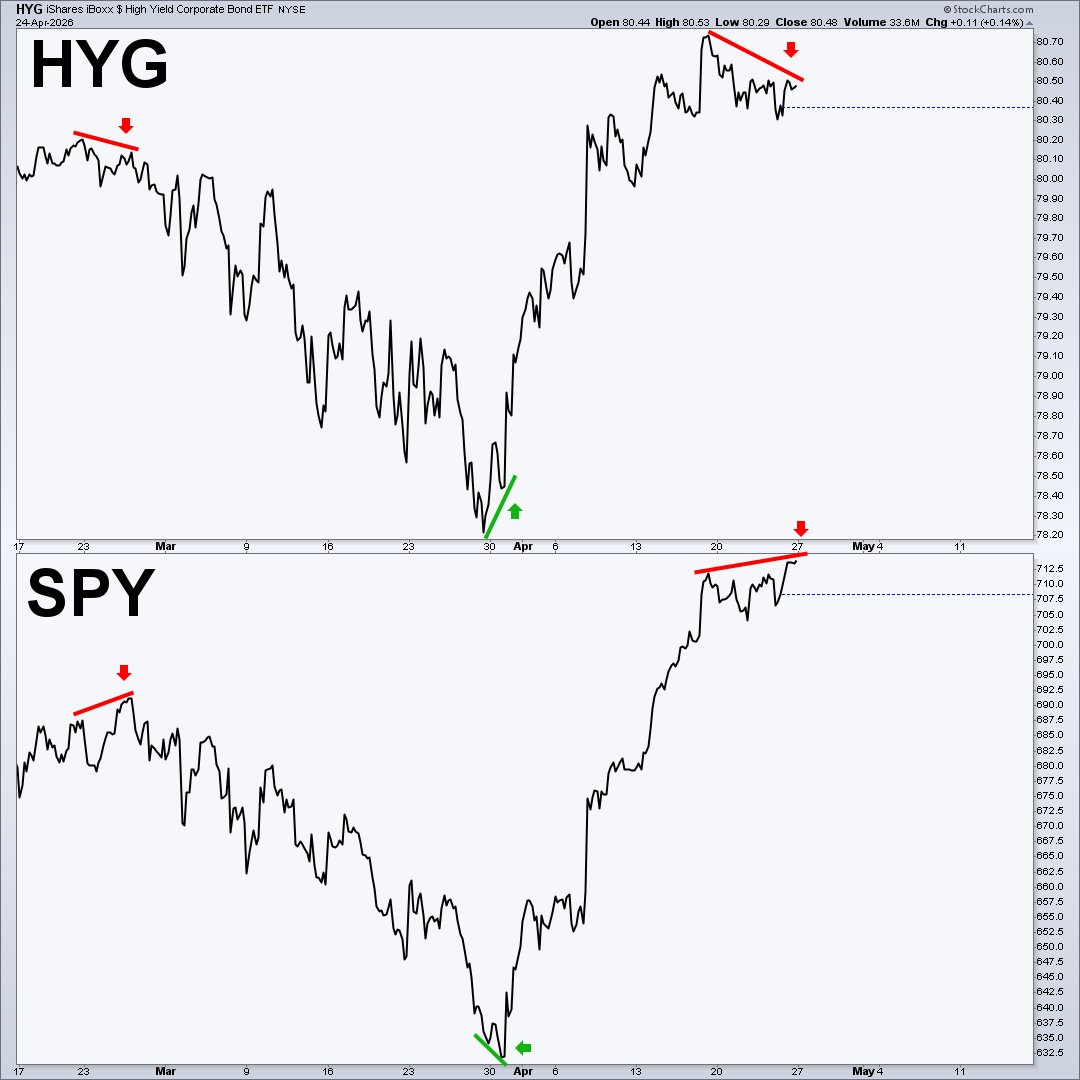
Almost nobody looks at this chart… but it’s one of my favorite ways to spot when a move may be running on fumes. This is a simple 60‑minute line chart of high yield vs SPY. I use it to track divergences between “smart money” (bonds) and “dumb money” (equities). The last major signal was at the bottom, high yield quietly started putting in a higher low while stocks were still puking. That helped flag the turn. Fast‑forward to now: $JNK and $HYG are not confirming this latest push in SPY. Stocks are pressing higher, high yield is stalling out. That doesn’t guarantee a top, but when "Smart Money" refuses to play along, I take note.
Mike tweet media
English
119
431
2.5K
308.7K
Mike
Mike@MarketMike·
He thought he cooked me with this post, then the market rips +2.91% the next day hahah
English
7
2
107
12.4K
Ryan
Ryan@DodgysDD·
If you don’t take this you might want to consider quitting trading
Ryan tweet media
English
223
34
1.4K
385.9K
J.C. Parets
J.C. Parets@JC_ParetsX·
Simple moving averages are just invisible lines. There's no price memory there. It's just an average.
English
18
5
113
16.8K
Usman Ashraf
Usman Ashraf@usmanashraff·
You bought calls. Stock went up. You lost money. Sounds impossible. Happens every single day to thousands of traders. Here's the brutal reason why. 🧵
English
14
8
84
29.9K
Definelegit
Definelegit@DefineLegit·
Pay close attention everyone how this guys is a charlatan and just down right lacks common sense. Look at see how easily it was to go chart the 1 day of spxw and prove this dumb shit wrong. @MarketMike See how it’s deep red?
English
1
0
0
837
Goldfish Trader
Goldfish Trader@goldfishtrader·
@DefineLegit @MarketMike Still goinnnngggg hahahah. Also there was no threat. It was the opposite. Pretty sure he said he doesnt see the need to take action but documented your dumbass behavior just incase. Hahahah L.O.S.E.R
English
0
0
0
7
Definelegit
Definelegit@DefineLegit·
“Just like he said” he got called out for being a weird bitch who threatens legal action whe someone says something he doesn’t like. Just like you both weird pussys, not a single legal action will take place, you two are fucking clowns. And anyone who reads this will see the same.
GIF
English
1
0
0
12