
Jack Lin
296 posts


2月3日发的剧本,目前准确度100%,阶段2的反弹已经接近尾声,即将进入最后的逼空环节,反弹高点不会高于84k,切记不要fomo追涨,拉黑所有突破80k牛回的KOL!2个月后你会感谢我的!
0x机器猫@0xBitDora
2月3日发的剧本,刚过3天,阶段1就按剧本走完了,并开始了阶段2的演绎,准确度100% 阶段1️⃣: 下跌到71k,有小幅抵抗,更多是横盘,但基本不会出现较大幅度的反弹 ✅ 阶段2️⃣: 继续下跌到60k,这是大部分人预测的本轮熊市底部的极限位置,换句话说,会有大部分人在60k抄底,所以这里会出现本轮熊市的第二次死猫跳,反弹高点不会超过84k ⏩⏩⏩ 进行中 ⏩⏩⏩ ‼️注意‼️ 阶段2的反弹力度可能很大,但谨慎做多,胜率最高的方式是逢高做空,顺势而为!
中文

春江水暖鸭先知~
大盘将崩V镰吃~
信V镰赚大钱,
可不是我自封的~
V镰这个称号,
也不负追随者所托~
交易不是为了征求他人同意和认可。
相反,这是一个非常私人化的事情。
对错其实都与他人无关。
但是如果认可了一个人的逻辑,
那么,就请去相信他,
因为,
这一定是从他多少次从炼狱里爬出来的经验所得。
#信V镰赚大钱

williamyuan@moonstone1986
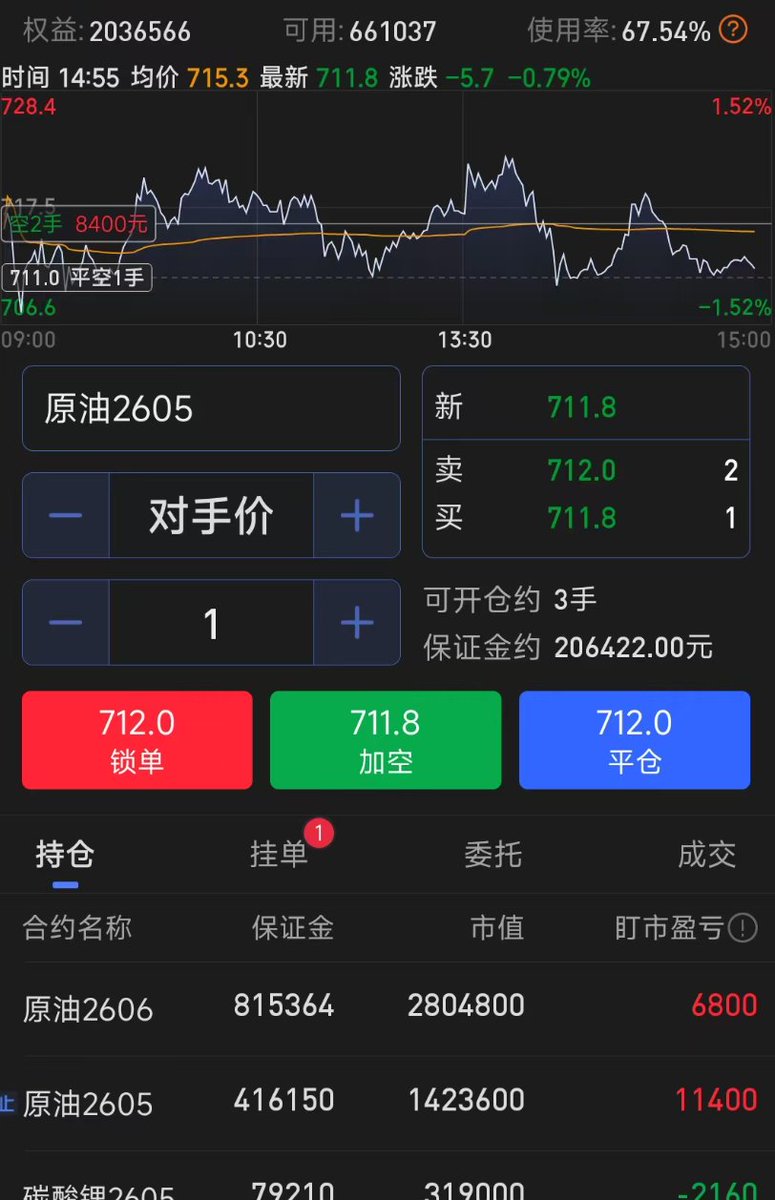
刚才有不明真相的吃瓜小白,来挑战我的空单逻辑。 作为圈里老人, 有必要给新人科普一下, 宏观经济对周期和风险资产的影响。 1、原油的价格高涨,直接会推高企业的生成成本,利润下降是必然的。届时会直接影响纳斯达克的走势。两者此消彼长,负相关。 如原油居高不下,则会带崩全球经济,我看多到150附近并横盘。 2、日元的高涨,对美股资产的流动性产生巨大的影响,如果日本加息,会导致市场流动性抽离,去平债。 (美股高涨实际上吃的就是无成本借日元 卖成美元 再去买美股资产 这波红利) 历史上每次日本加息都会产生20%+的跌幅。 3、BTC作为美股中的高风险正相关科技股(大部分机构参与持仓,如果美股走弱,则直接导致BTC被FUD。) 4、潜在风险:美联储FED的每次换任都会影响全球的货币政策。不确定性会对市场产生巨大的影响。历史每次更换美联储主席都会产生50%左右的下跌。(主要原因来自于资金避险观望) 5、美债收益率目前高达5%,如居高不下,资金在这种避险的情况下首选美债(国家背书的债券,利润不存在违约),躺着吃利息。 综上所述。 逻辑1:原油涨-成本高-企业利润下降-股票跌。 逻辑2:日本加息-流动性差-风险资产撤离-市场跌。 逻辑3:美债涨-资金避险进入-间接抽走市场流动性。 这也就解释了,为什么在此刻盘面会高涨的原因: 流动性太差了,一点钱几千个BTC就能拉起来! 去看看现货的净流入就知道了。根本没有超10亿的资金进入市场。 当前市场处于分歧阶段,场内互砍,底牌已经很清晰了,就看谁血厚! 小白们,你们看懂了吗? #V镰宏观分析 #BTC行情分析 $btc $UKOUSD $USDJPY $NAS100
中文

$BTC
If the weekly candle closes above 81.2k, we’re going straight to 83.3k–84.2k.

BANG@BangXBT
$BTC I already analyzed this for you a long time ago. Now go check it.
English


$BTC
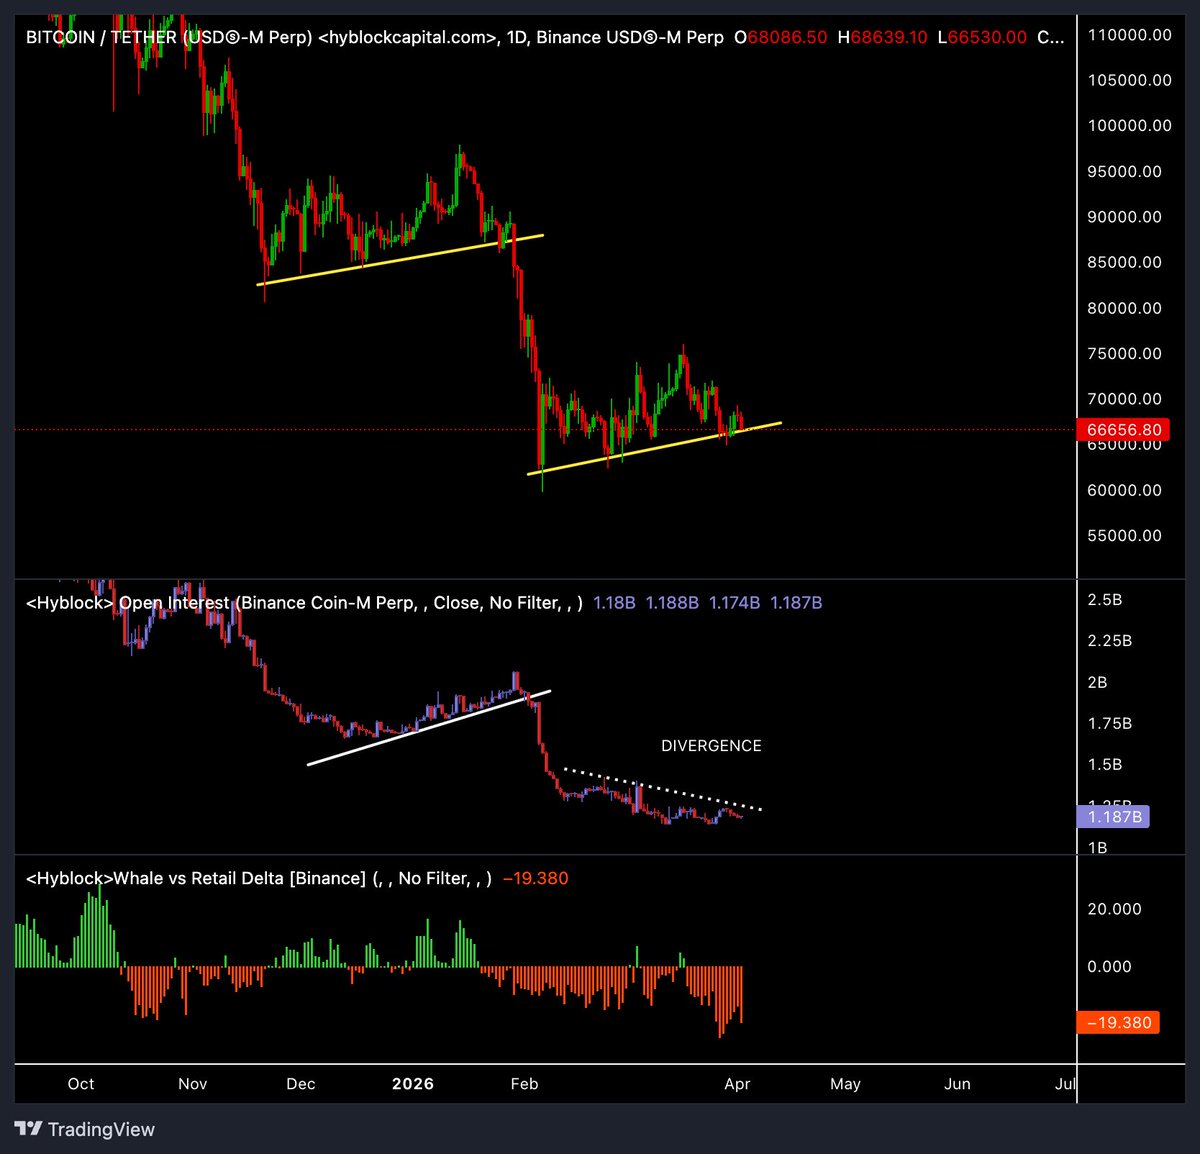
I've been pointing at this range divergence for weeks.
When price grinds higher and Open Interest drops during an intermediate range, no meaningful new money is entering the market to sustain a rally.
The moves in this range are shorts covering their squeeze. Not fresh longs being built. It's what we call "mechanical pressure". Their forced buying is doing the heavy lifting.
Whale Delta has also been persistently red since December. Large players are not on the buy side of this move. They have been heavy on the sell side for 95% of this range.
Both of these things are true at the same time. Yet price is still up when neither metric supports it.
Unfortunately for bulls, short covering has a limit. Once the last trapped short closes, that fuel is gone. Price then has to answer a simple question.
Are there real buyers here or not?
Right now the chart is telling me there aren't.
Until OI harmonically expands with price, this range is destined for another move down.
Ardi@ArdiNSC
$BTC First time this bear market that price and OI have diverged on an intermediate timeframe. Six weeks of price climbing. Six weeks of OI declining. What that tells you is that this rally wasn't built on new buyers entering. A big part of it was shorts closing their positions. Traders who shorted the top saw $60K and decided that was good enough. They locked profit. They exited. That exit pressure pushed price up. But it's not the same as fresh demand sufficient for a reversal. In a rally with real strength behind it, OI rises. Shorts close and longs open to replace them. New capital enters = foundation behind the movement. None of that has happened yet in this range. One-sided the entire way up. The problem is short covering has a ceiling. Once the last short has closed, that source of upward pressure is gone with no one to take over.
English


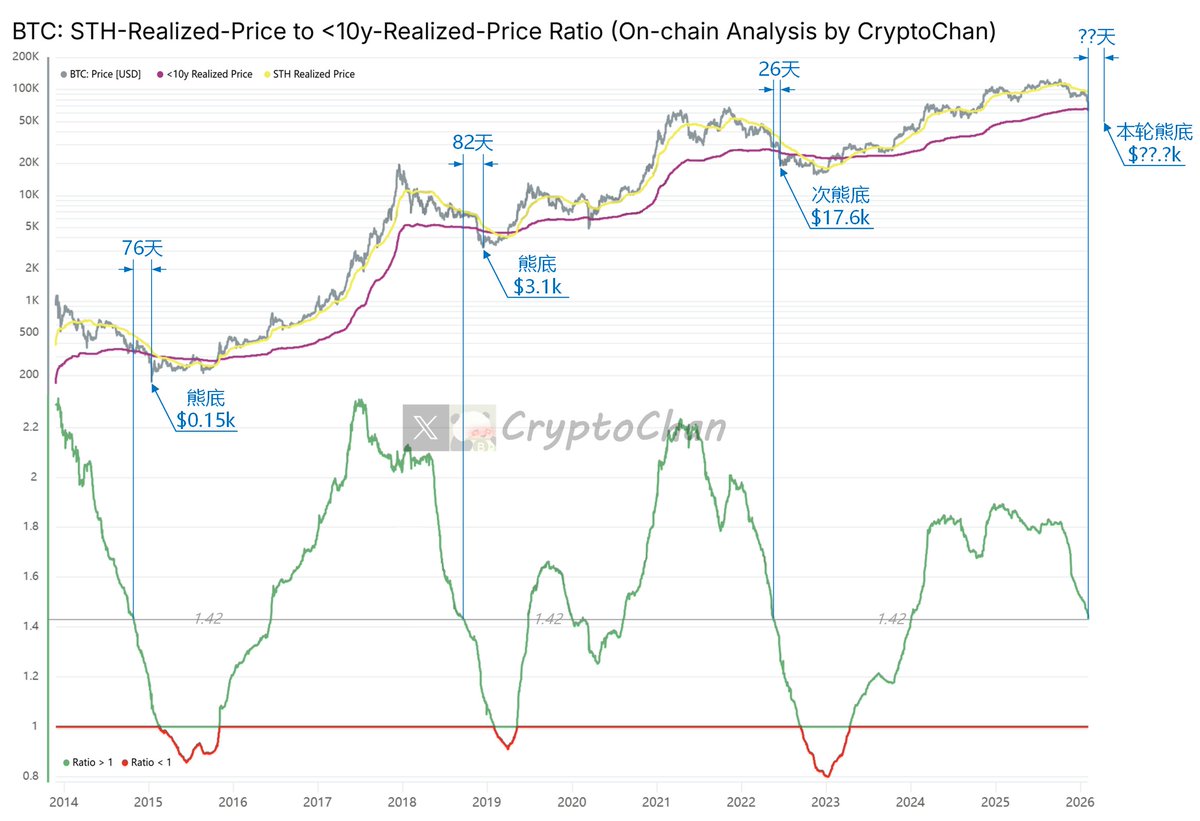
【四年周期总刻系列(18)】当前图中指标跌至 1.42
14年该指标跌至 1.42 后 76天 到熊底 ($0.15k)
18年该指标跌至 1.42 后 82天 到熊底 ($3.1k)
22年该指标跌至 1.42 后 26天 到次熊底 ($17.6k)
图中上方灰线为 #BTC 价格;黄线为 BTC 短期持有者成本均价;玫红线为 BTC 长期持有者成本均价(剔除持币>10年的筹码)
图中下方指标为“BTC 短期持有者成本均价”跟“BTC 长期持有者成本均价(剔除>10y筹码版)”之比(即:黄线 / 玫红线)
BTC短期持有者成本均价定义:持有比特币<155天的投资者的平均成本。含义:反映近期买家的成本基础,他们对价格波动敏感,易在下跌时卖出。常作为短期市场情绪指标——牛市中价格高于此均价,熊市中跌破可能加剧抛售
BTC长期持有者成本均价定义:持有比特币>155天的投资者的平均成本,但排除>10年的筹码(这些可能丢失或永不动,如中本聪的币)。含义:聚焦“活跃”长期持有者,提供更现实的成本基础。常作为市场支撑水平参考——熊市中可能成为价格底部
两者比率(短期均价 / 长期均价)含义:反映市场周期阶段和参与者行为:
比率 >1:短期买家成本高(新资金高价入场),情绪乐观但可能过热
比率 <1:熊市或底部信号,短期买家成本低(低价入场),弱手出清,市场或将复苏
总体趋势:比率上升=牛市延续;下降=熊市或分发阶段。排除>10年筹码使比率更准确捕捉周期转折,历史上 <1 时常为长期买入机会
CryptoChan@0xCryptoChan
【四年周期总刻系列(17)】 15年6月该指标峰值跟19年3月该指标峰值相差 1385天 19年3月该指标峰值跟23年1月该指标峰值相差 1380天 23年1月该指标峰值距今已过去1068天 图中上方指标为 #BTC 价格;下方指标为“链上长期持币者买币均价”跟“链上短期持币者买币均价”之比
中文
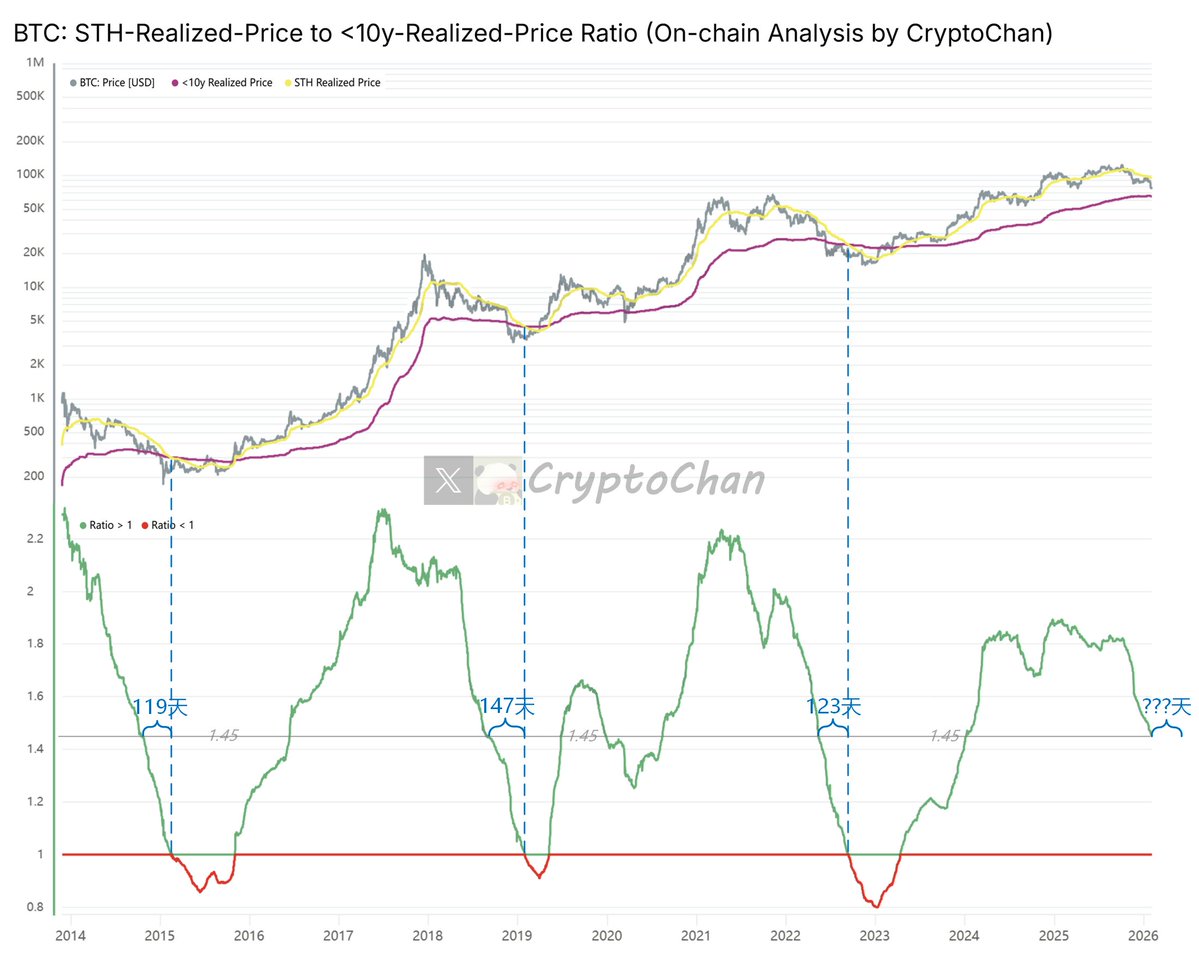
当前图中指标跌至 1.45
2014年该指标从 1.45 到 1,花费 119天
2018年该指标从 1.45 到 1,花费 147天
2022年该指标从 1.45 到 1,花费 123天
注:指标到 1,基本熊底
图中上方灰线为 #BTC 价格;黄线为 BTC 短期持有者成本均价;玫红线为 BTC 长期持有者成本均价(剔除持币>10年的筹码)
图中下方指标为“BTC 短期持有者成本均价”跟“BTC 长期持有者成本均价(剔除>10y筹码版)”之比(即:黄线 / 玫红线)
BTC短期持有者成本均价定义为持有比特币时间少于155天的投资者或实体。该指标反映了近期市场进入者的成本基础,这些参与者往往对价格波动更敏感,更容易在市场波动或下跌时出售持仓。它常被视为市场短期情绪和动量的晴雨表:在牛市中,价格通常高于该成本均价;在熊市中,价格跌破该水平可能引发更多抛售压力
BTC长期持有者成本均价定义为持有比特币时间超过155天的投资者或实体。该指标剔除了持有超过10年的筹码(已丢失或极长期不动产,如本聪的币),以聚焦于更“活跃”的长期持有者群体。这些极长期筹码的成本极低,且几乎不会移动,因此排除它们能提供一个更现实的LTH成本基础,反映那些可能在市场周期中实际参与买卖的长期投资者的平均持仓价。该指标常被视为市场基础支撑水平的参考:在熊市中,它可能作为潜在的价格底部
两者之比(BTC短期持有者成本均价 / BTC长期持有者成本均价)反映了比特币市场周期的阶段和参与者行为动态:
比率 > 1:表示短期持有者的平均成本高于调整后长期持有者。这通常发生在牛市中,近期进入者以较高价格买入,而长期持有者的成本基础较低(即使排除极长期筹码)。这暗示市场情绪乐观、新资金流入强劲,但也可能预示投机过热或潜在回调
比率 < 1:表示短期持有者的平均成本低于调整后长期持有者。这常见于熊市或市场底部,近期进入者以较低价格买入,而长期持有者的成本基础较高(反映他们持有穿越周期)。这往往是投降的信号,暗示弱手已出清,市场可能转向复苏或牛市起点
总体含义:比率的上升趋势显示短期持有者成本相对于长期持有者在增加,标志“数字上涨”阶段或牛市延续;下降趋势则显示长期持有者成本相对于短期持有者在增加,标志熊市或分发阶段。排除>10年筹码使LTH成本更贴近活跃市场参与者,避免低成本失落币扭曲比率,从而更准确捕捉周期转折(如从熊市向牛市过渡)。历史上,当比率跌破1时,常是长期买入机会
中文
时光荏苒
周期永恒
CryptoChan@0xCryptoChan
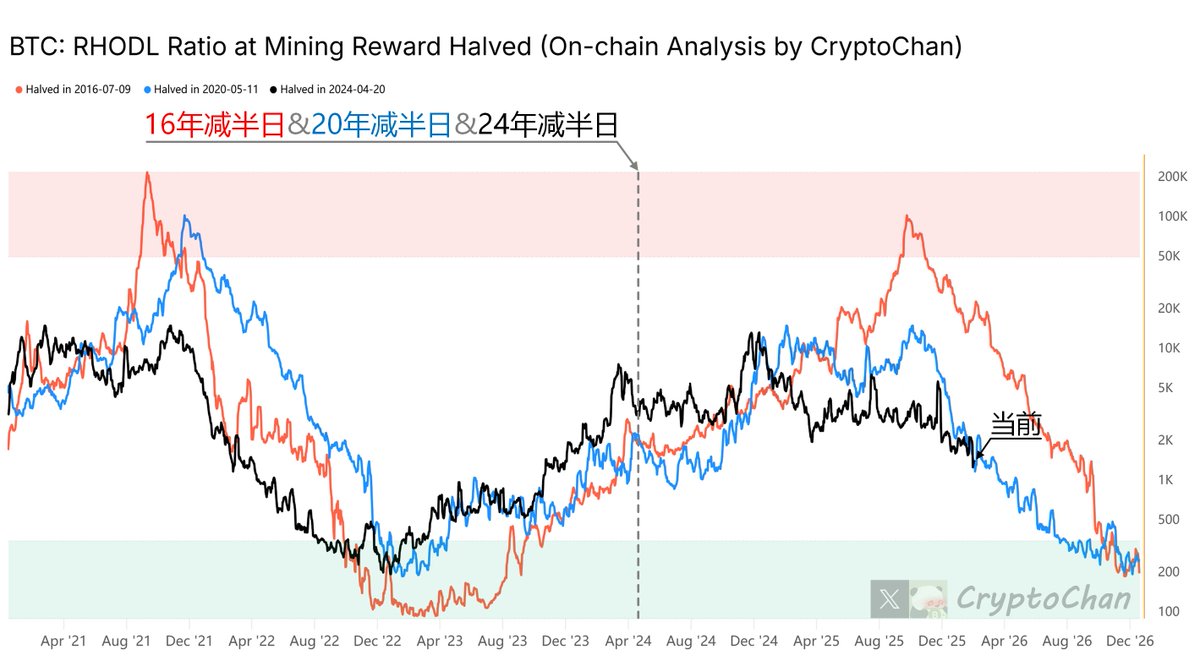
16年BTC挖矿产量减半522天后,比特币RHODL指标达到牛市峰值(2017年12月14日,币价$16.7k,非K线牛顶); 20年BTC挖矿产量减半533天后,比特币RHODL指标达到牛市峰值(2021年10月26日,币价$62.7k,非K线牛顶); 当前,24年BTC挖矿产量减半已过去114天。 图中指标为比特币RHODL (Realized HODL Ratio),即链上未移动时长小于1周的BTC数量跟未移动时长在1-2年之间的BTC数量之比(不同年龄段的BTC数量需根据其年龄段所有BTC的买入成本总市值进行加权计算)。 其中红线为该指标的⟨13-17年⟩段;蓝线为该指标的⟨17-21年⟩段;黑线为该指标的⟨21年-至今⟩段。三段线将各自周期的BTC挖矿产量减半日对齐。 本文由 #Bitget|@Bitget_zh 赞助
日本語
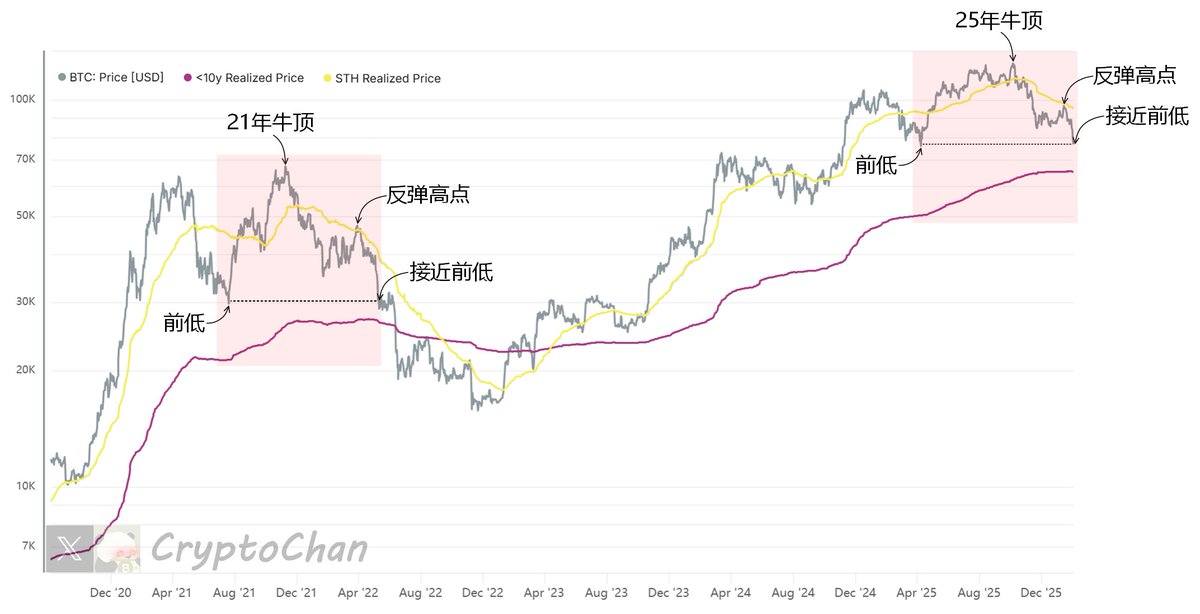
刻下上轮牛末熊初
图中灰线为 BTC 价格;黄线为 BTC 短期持有者成本均价;玫红线为 BTC 长期持有者成本均价(剔除持币>10年的筹码)
指标简介——
#BTC 短期持有者成本均价指标:短期持有者(持币<155天)的平均入场成本(最后转移时的价格)。反映:短期群体盈利/亏损状态;价格高于均价时盈利,易持仓上涨;低于时亏损,易抛售形成下行压力或支撑位,识别中短线市场底部
#BTC 长期持有者成本均价(剔除持币>10年的筹码)指标:长期持有者(持币>155天,排除>10年)的平均入场成本,聚焦活跃长期群体,避免僵尸币扭曲。反映:长期群体盈利/亏损状态;价格高于均价时盈利,易获利了结形成上行阻力;低于时亏损,但提供下行支撑,判断熊市底部或周期转折
中文

Why the dollar collapse is nonsense:
1. No real alternative. There is no other deep, liquid, rule‑of‑law market like U.S. Treasuries for global capital.
2. U.S. market depth. NYSE + Nasdaq are over 60% of world market cap; NYSE alone is larger than all European exchanges combined.
3. No valid replacement. Euro, BRICS, gold or crypto all lack the scale, liquidity, and legal infrastructure to take over the dollar’s role
English
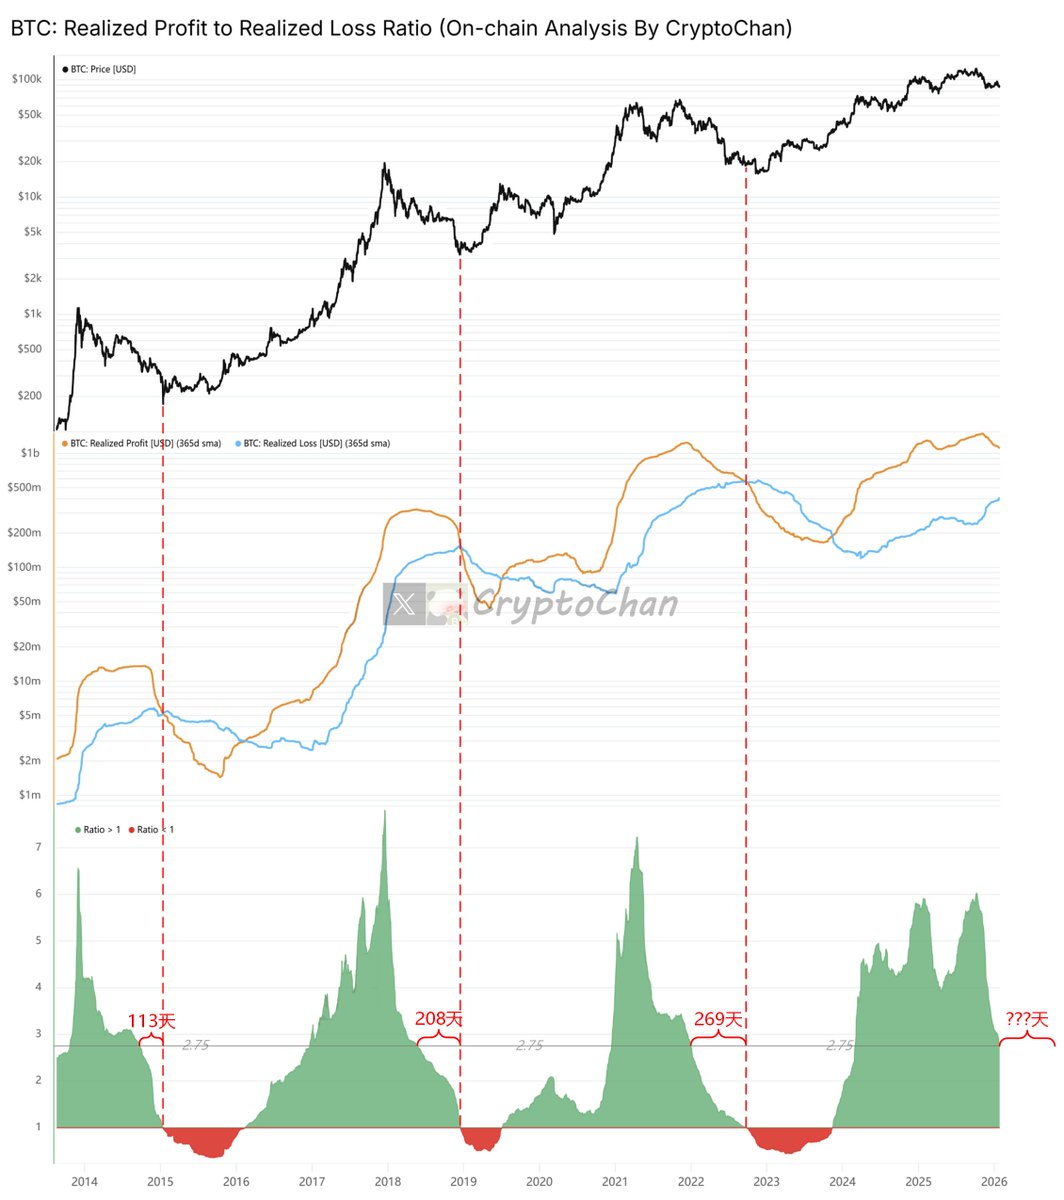
【#BTC 链上指标更新】当前图中指标跌至 2.75
2014年该指标从 2.75 到 1,花费 113天
2018年该指标从 2.75 到 1,花费 208天
2022年该指标从 2.75 到 1,花费 269天
注:指标到 1,基本熊底
CryptoChan@0xCryptoChan
当前图中指标跌至 3.16 2014年该指标从 3.16 跌到 1,花了 285天 2018年该指标从 3.16 跌至 1,花了 274天 2022年该指标从 3.16 跌至 1,花了 296天 图中上部指标为 #BTC 价格; 图中中部指标为比特币已实现盈利(365日MA)和比特币已实现损失(365日MA); 图中下部指标为比特币已实现盈利(365日MA)跟比特币已实现损失(365日MA)之比,也即“已实现盈亏比(365日MA)” 该比率通过比较过去365天内投资者实现的盈利(卖出价格高于买入价格的部分)与亏损(卖出价格低于买入价格的部分)的移动平均值,反映了市场参与者的整体盈亏状态 在牛市,盈利亏损比通常较高,因为投资者倾向于在价格高位获利了结 在熊市,该比率通常较低,因为投资者可能在亏损状态下卖出,反映市场恐慌或投降行为 使用365日移动平均线平滑了短期波动,突出了长期趋势。这个指标适合用来判断市场是否处于过热(过高比率)或过度恐慌(过低比率)的状态,是判断市场周期和趋势的有力工具
中文
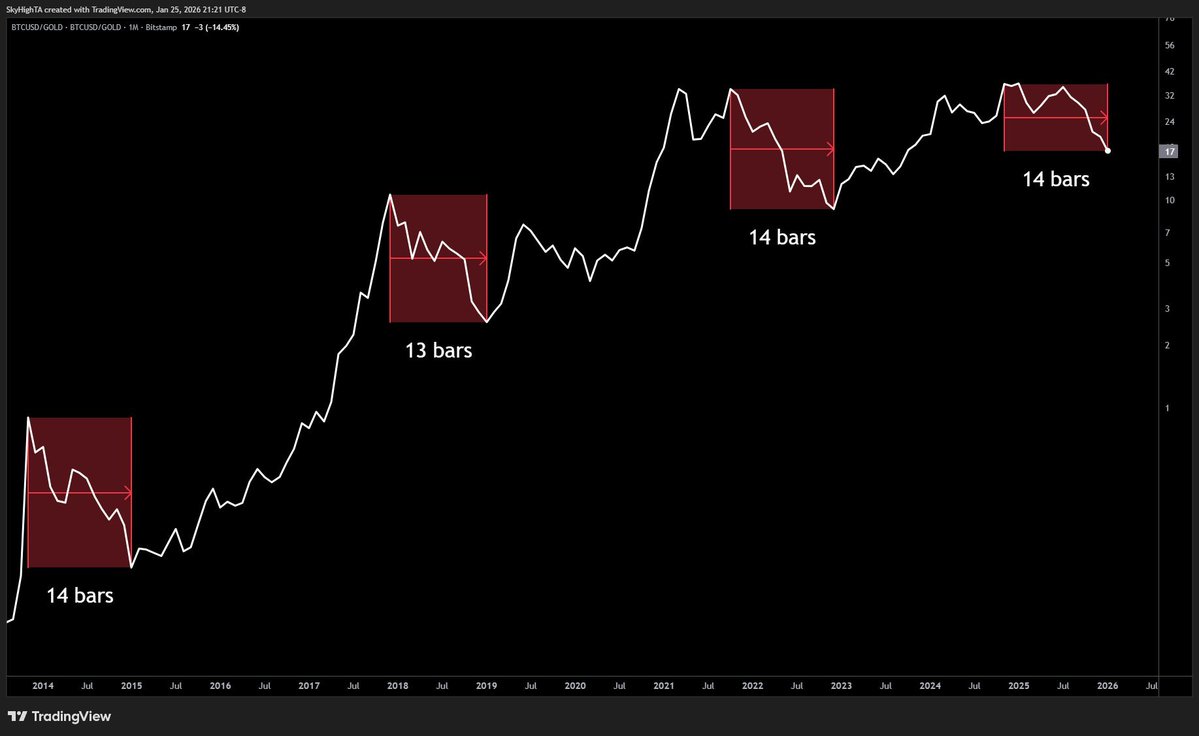
@Andre_Dragosch @SuperBitcoinBro FYI
BTCXAU monthly chart actually topped at April 2021 at 37 and never closed the monthly candle above ever since
English

Interesting::
The average duration of a BTC/Gold bear market is around 14 months.
We are already
*checks notes*
14 months in.
English

DEV UPDATE
✦ New, cleaner design for PnL share cards
✦ Trades, orders, and market data now load faster and more reliably
✦ Better handling of failed transactions so things recover more smoothly
✦ Improved backend reliability to reduce data issues
✦ Added WebSockets to reduce polling and improve data speed
Have feedback or suggestions? Drop them in the comments.

English
@shayne_coplan @X US did invade Venezuela on 1/3. All bets before January 31 should get paid. If the outcome resolved as “no,” you will lose trust in millions of users worldwide. Some decentralized alternatives will replace you. Think twice, act smart.
English
