SeeJay
116 posts


SeeJay
@jay4_see
I'm just here reading Fintwit... Don't mind me. -Champagne Room- Join for Education, Show up ready to learn.
Champagne University Katılım Ocak 2021
219 Takip Edilen205 Takipçiler

@GekkoXTrader @MandoTrading He doesn't have "adjust for contract changes" on (B-ADJ) That is why you are getting a different number
English

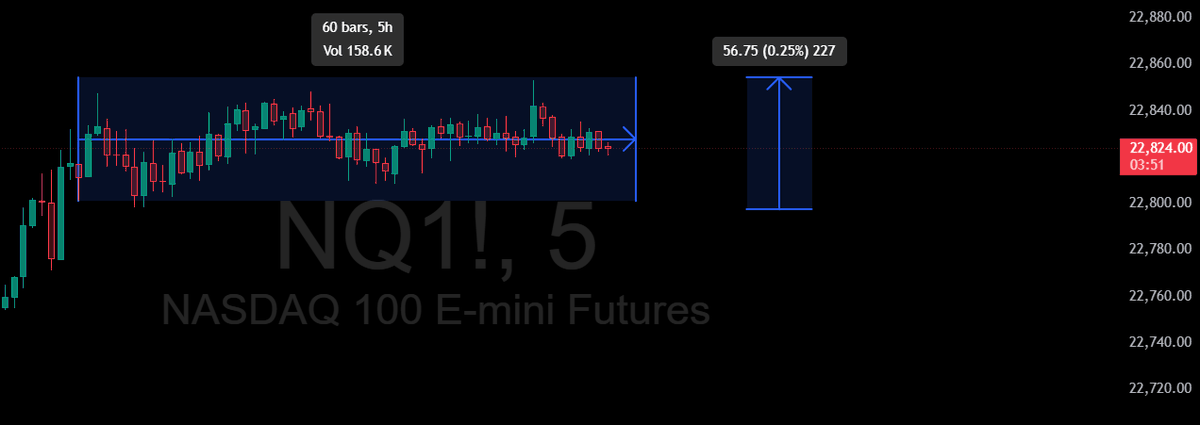
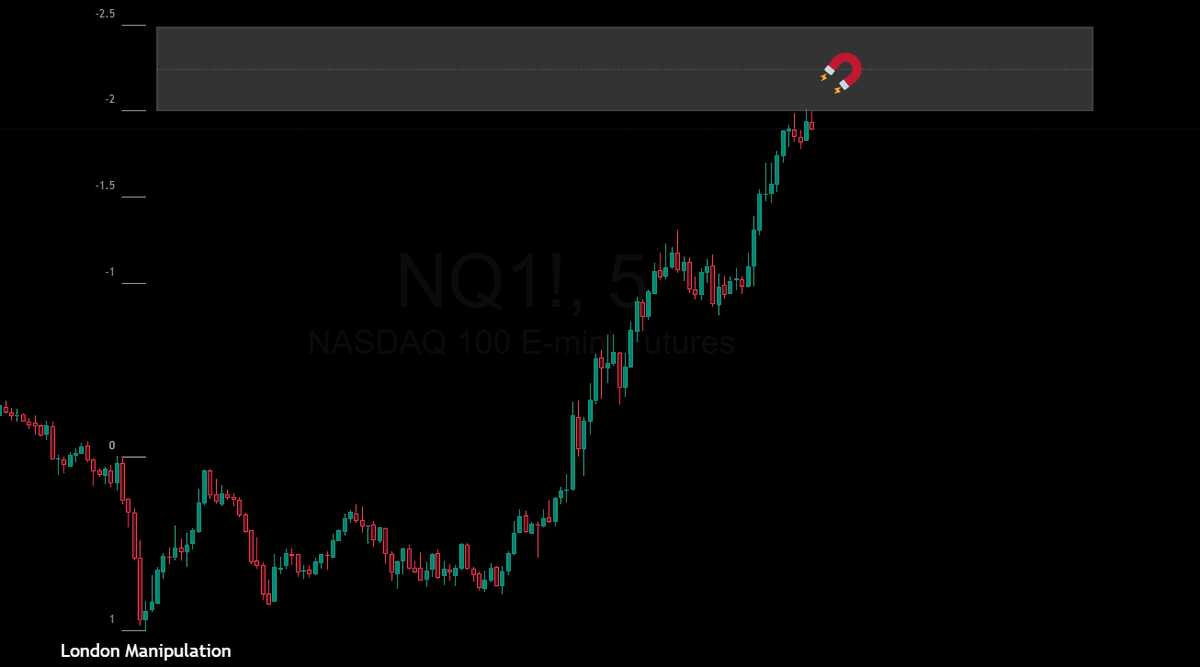
The quarterly imbalance on $NQ at 23904 is coming.
$SPY to follow.
Bookmark this
English
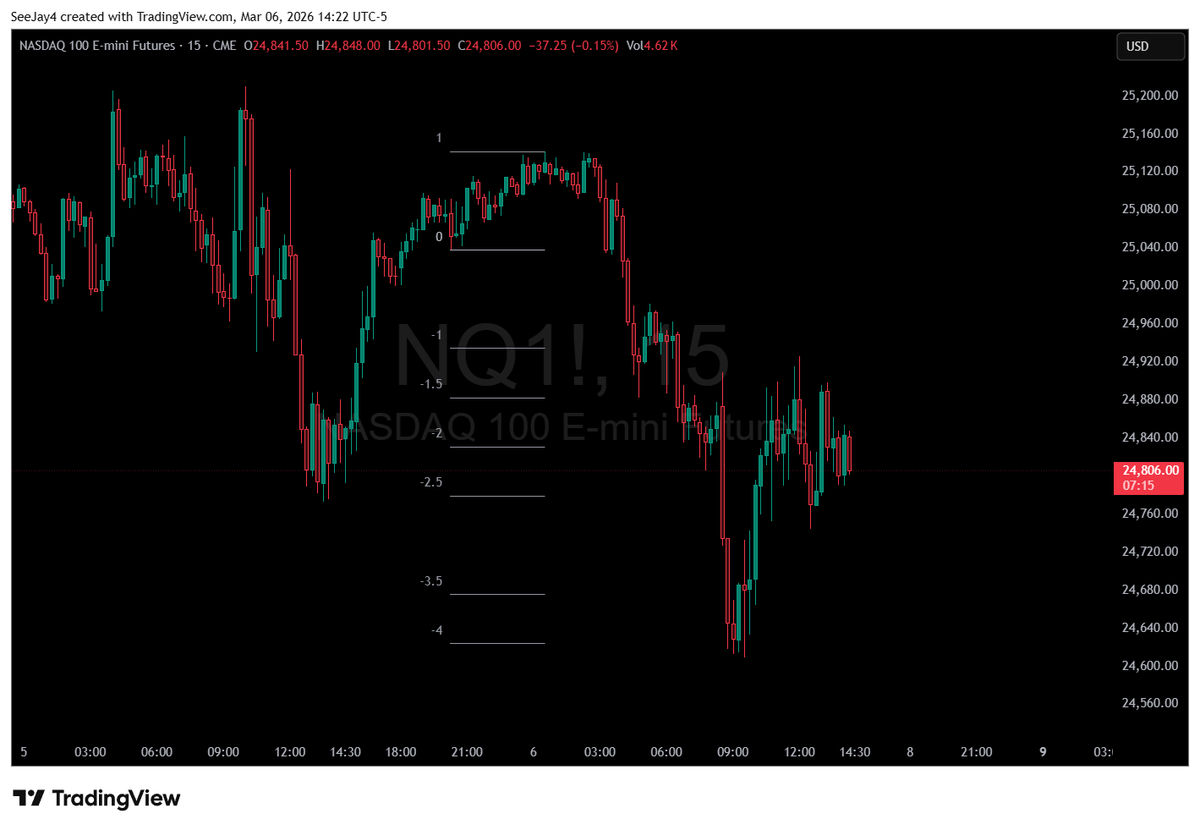

Assume you use the Asian Range for your setups...
How would you use this range?
English

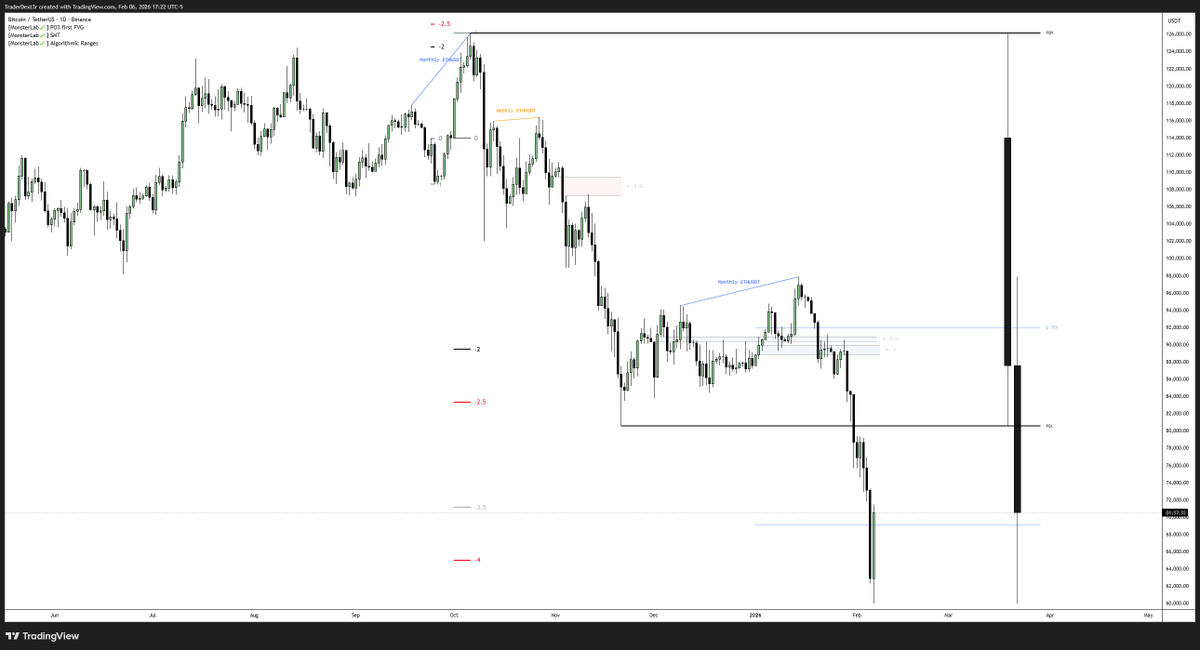
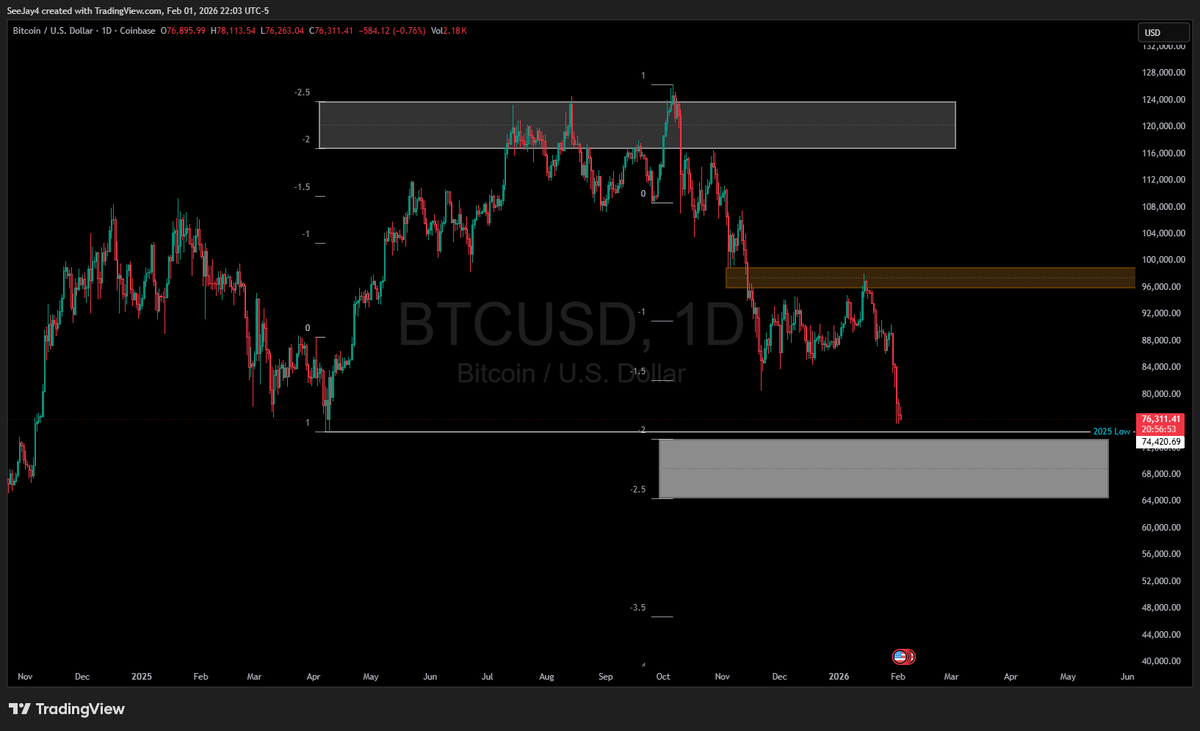
All the ingredients for a Crypto crash were in place.
Opportunities are visible only to those prepared to see them.
Comment “SMT” to enter the MonsterLab SMT Indicator giveaway.
Winner announced in 48 hours.
DexterLab@TraderDext3r
Bitcoin Crash + STDV • IPDA: 3M lookback • Daily 2.0–2.5 STDV (Oct) • Monthly SMT BTC/ETH The framework was already in play— it only needed high-impact news. The catalyst was “TRUMP.” Powell could’ve done the same, same direction. Wake up, Neo.
English

I don't do this, but here's some free alpha for you robots.
Anyone that has called a bottom on BTC (or ETH, they are highly correlated assets) since October should be immediately unfollowed. Yes, I called that bottom to the left as well, there are receipts for that one too. GG
Options King Of The Sea@SeaKingOptions
$BTC $BTCUSD Almost there 4 months later @jay4_see Champagne Room membership cheaper than blowing up $250M in leveraged perps attempting to long with everyone on X, know this
English

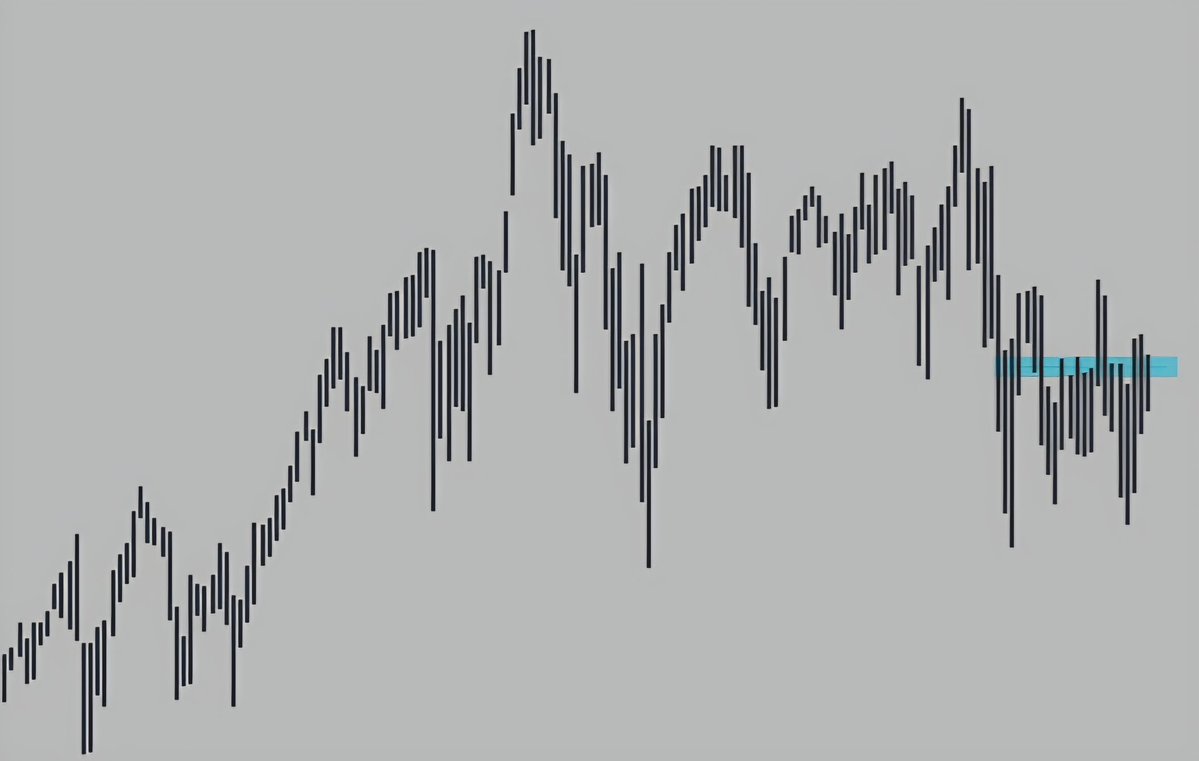
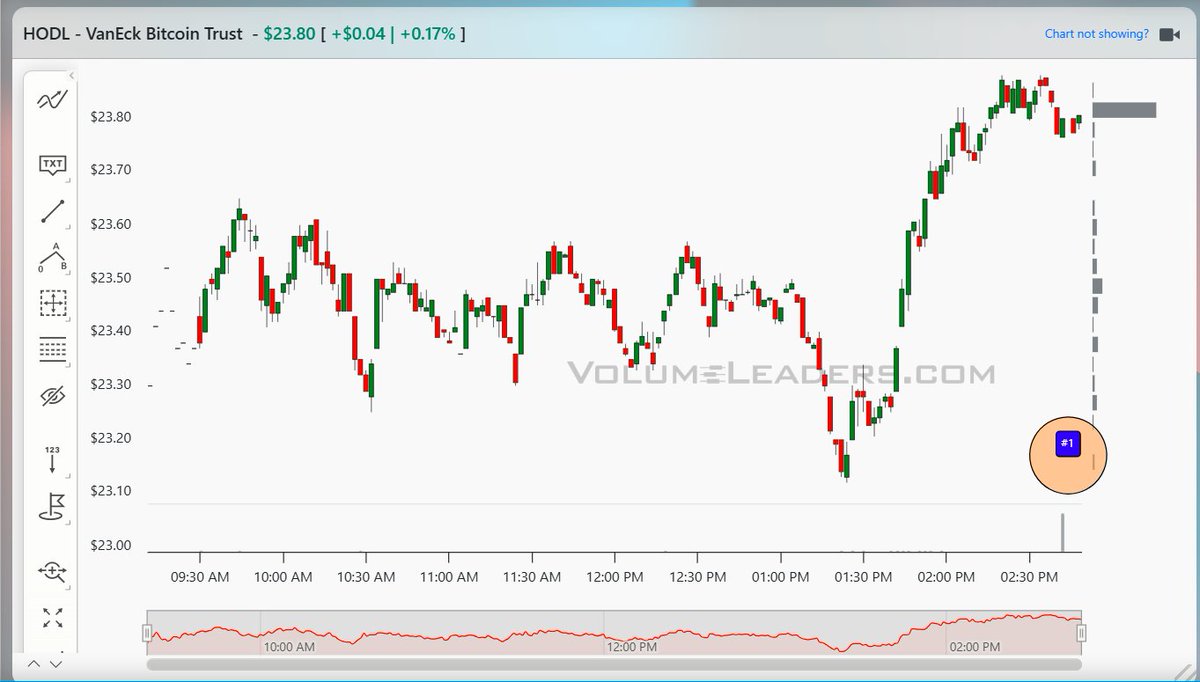
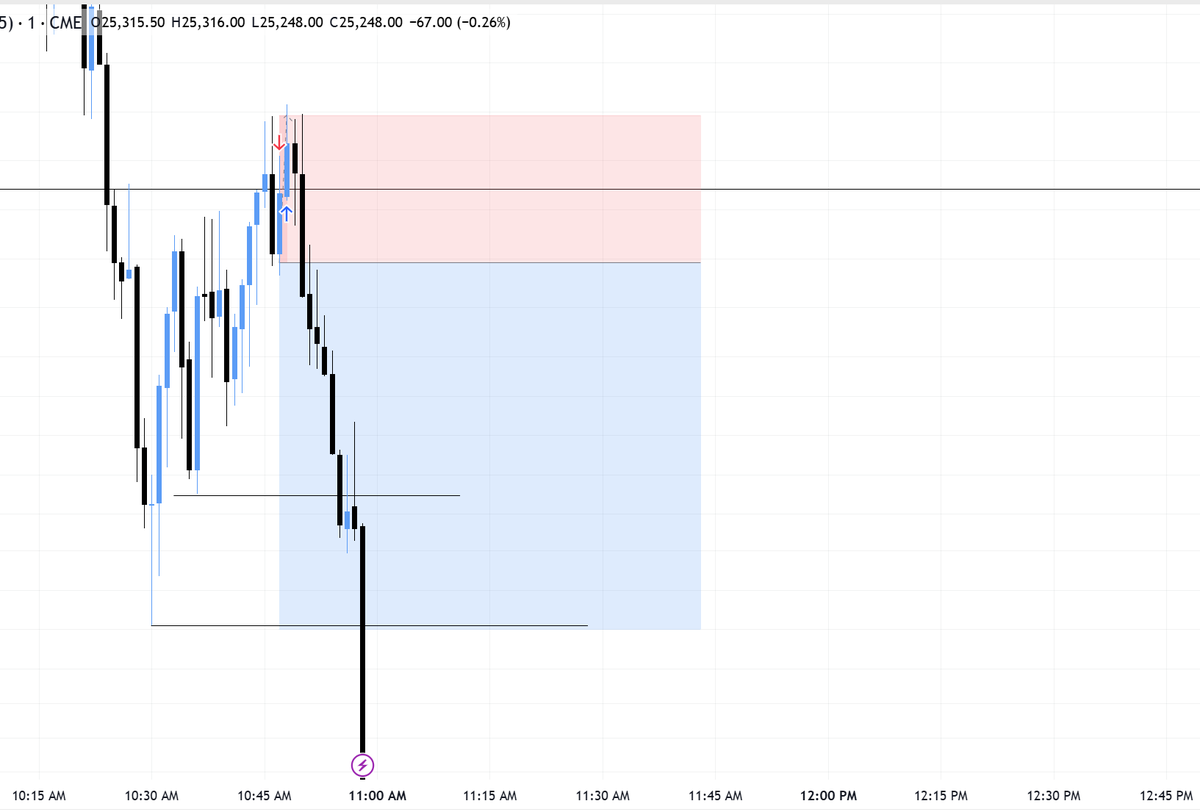
$HODL ( $BTC ) - Largest trade since inception. This dark pool trade was reported late, hence its disconnection from price (image 3).
Presents best as a new long position.


English

Yo @grok in 18 hours pick someone random from my comments to win this Rolex Day-Date (~$11,600)
Rules: like, reply with 'done' and make sure you followed @nolimitgains
Good luck everyone!

English


someone actually end my misery please I genuinely cant do this shit anymore
English
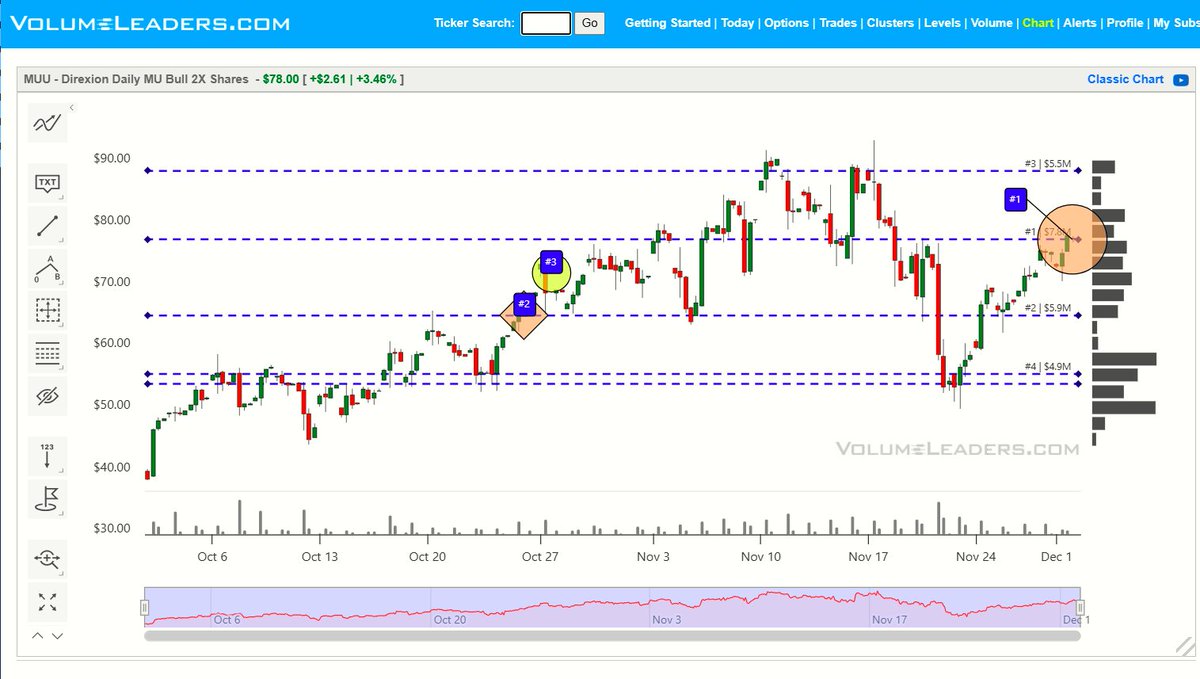
$MUU (2x $MU) - Institutions snuck in a new #1 just two hours after the close today.
Devilishly clever. That's what Dad would say if he knew what the heck any of this meant. But if I tried to explain it to him, he'd just pivot the conversation to whatever the Dow did today. I digress.
Some of you will see this, combine it with other 'stuff' and piece together a motive or a thesis of some kind. Maybe even take a trade. Good for you.
Some of you will discover this tweet with a firm predisposition about how you expect this ticker to behave, and just conclude that this position is more evidence to support your bias - whatever that may be.
Some of you will go straight to the comments and insist that I tell you whether it's a buy or a sell (spoiler - it's always both). The nuance of it all is determining what side of the trade institutions are on, and then determining how you expect price to react within a particular timeframe. If you can get that far, the next step is deciding how best to play it within the parameters of your own risk tolerance, timeframe, trade goals, etc. with the understanding that just because "they" did something it does not compel you to do something too.
There's no one-size-fits-all answer. It's rarely as simple as "they bought, so I'll buy a jillion shares and retire in a week" or "they sold, so I'll drop half my account into puts that expire before I finish reading this tweet."
It's entirely possible this trade was a sell, and price opens higher tomorrow. Overshoot is common - particularly with leveraged tickers. It's also entirely possible this trade was a sell, and price will trade flat for the next 158 sessions. Exiting a long does not mean price has to instantly, or aggressively, trade lower. It doesn't even have to reverse at all. Sometimes long exits are just that - exits. And price continues on perhaps with less conviction than it had prior to the trade, or chops for a while.
It's also entirely possible this trade was a buy and price continues upward for some period of time, even as some (including myself) might openly wonder what in the wide wide world of sports this institution was thinking letting price move up 50% in a week only to decide "now's a great time to buy, boys!"
It's a game of probabilities, and these trades are one data point among many. Often the best thing to do when seeing them print after a steep move in either direction is not to attempt a counter trend trade with the expectation of immediate reversal, but to position oneself more defensively with the understanding that the likelihood of a reversal is higher right now than it was the day before, though still not a lock to begin imminently (if at all). Then let price demonstrate some willingness to trade in the opposite direction before considering a counter-trend trade.
The point is not to draw conclusions about future price movements solely by the presence of large trades, but to use these large trades as starting points whereby further analysis can be done.
Sometimes you'll look at these trades, throw up your arms, and conclude that you haven't a darn clue what's in store. That's perfectly normal. Common even.
Other times you'll look at a trade, combine it with all of your other data points and arrive at a higher-confidence conclusion about what to expect. Perhaps a trade will corroborate an existing thesis, so you size up a little or reconsider your target. Perhaps a trade will draw your eye towards a ticker or sector you hadn't been watching. Perhaps a trade will dissuade you from entering a shitty trade that you previously thought was wise. Lots of things *might* happen, but what shouldn't ever happen is that you see a trade, watch price for a couple minutes, and decide "that's a buy" or "that's a sell" and then jump into a trade of your own.
VL is not a stand-alone trade signal generator. It's just a way to visualize and contextualize the trades institutions are making so that you can be better informed about your own.
If you're a moving average trader, overlay the trades with your MAs and look for confluence between positioning and your entry/exit triggers. Size has an impact on how price moves.
If you're a mean reversion trader, look for large trades as indications of trend exhaustion after price has extended beyond your parameters for what is considered "normal."
If you're a buy and hold, long-only swing trader, look for areas of ongoing elevated activity over several sessions at/near support levels. Let price demonstrate some willingness to start a new trend.
If you're an EW or Wyckoff trader, look for large trades that appear at/near important fibs, or at key points during accumulation/distribution phases. Let them help confirm you're following the right pattern.
If you have a super top secret edge that nobody knows but you, use the context provided within the trade data to make that edge even edgier.
But no matter what you do, at least you know where they are (or were), so you can better define your entries and exits, stop losses, and better frame your general expectations about how price could behave going forward.
volumeleaders.com/register


English
@SeaKingOptions The amount of robots in here taking the Bait is absolute peak fintwit
English

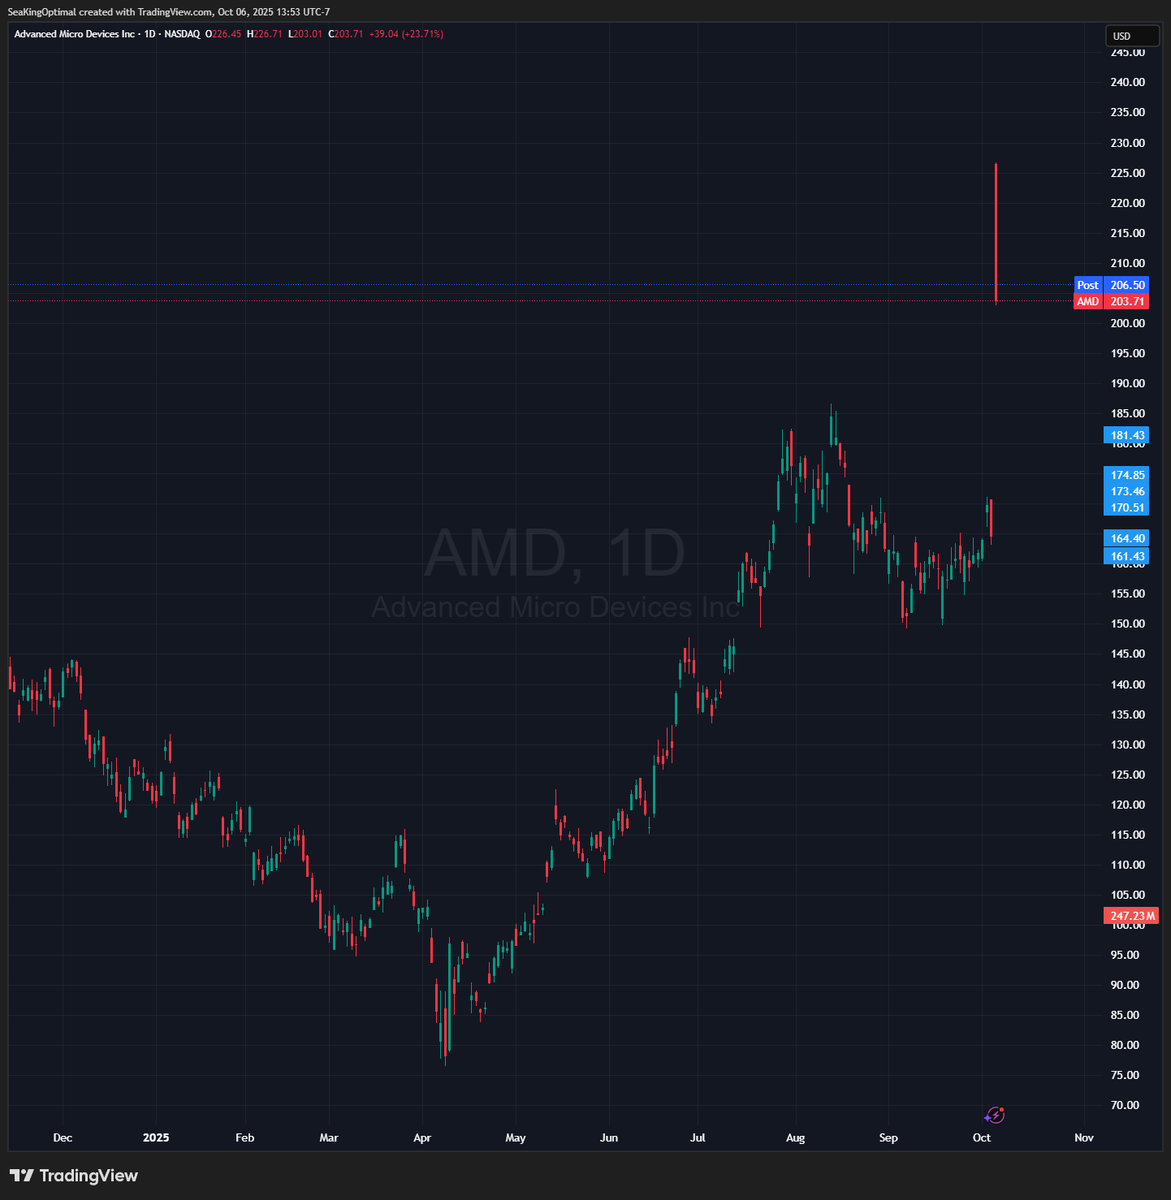
The "Covered Calls are free money" folks aren't posting today bc they're too busy handling their margin calls $AMD
English
@StockMomo No, people just used to get punched in the face if they said something outside of socially acceptable
English
Social media is a cancer, but the problem is if you try to regulate it, you’ll just get smaller niched platforms- this is far worse
English
Tell me more about how they were STO @spotgamma
Trade is only up $10M so far
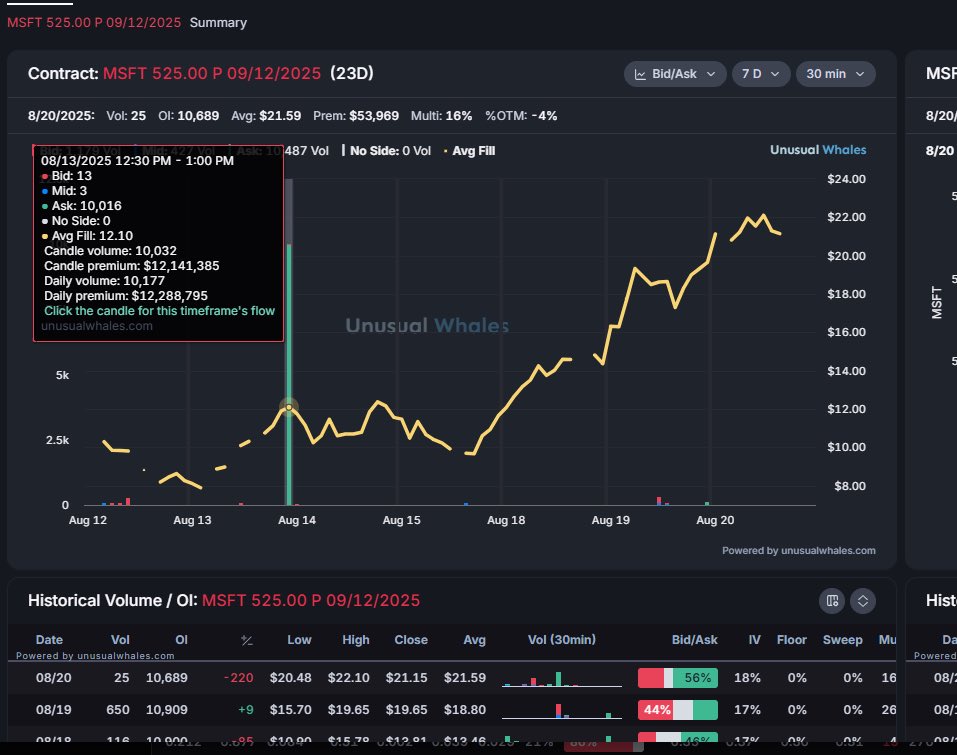
SpotGamma@spotgamma
You don't want to hear this because it lacks doom...but looks like those puts were sold.
English

🚨 FLASH SALE LIVE – Ends July 31st at 11:59 PM! 🚨
We’ve just slashed list prices on our Lightning Funded accounts — and with the existing 35% off code, it gets even better 💥
Here’s what you’re looking at:
💼 New List Prices
🔹 25K Account: $270
🔹 50K Account: $385
🔹 100K Account: $540
🎯 After 35% Off
🔹 25K Account: $176
🔹 50K Account: $250
🔹 100K Account: $351
🔥 Use code: JULY to get the 35% off at checkout.
This is one of the best deals we’ve ever run — don’t miss it.
*** Prices will update when you get to checkout
➡️ Get funded instantly. Get paid in 7 days.
🕛 Ends July 31st at 11:59 PM sharp. Get in while it lasts!
tradeify.co

English

@SeaKingOptions If you're bullish, you're wrong. He will actually be right this week.
English


80% of the people you follow on this app are clowns
English