jay

473 posts

jay banner
jay

jay

@jay555b

Numberphile. Loyalty over everything. Allergic to being average.
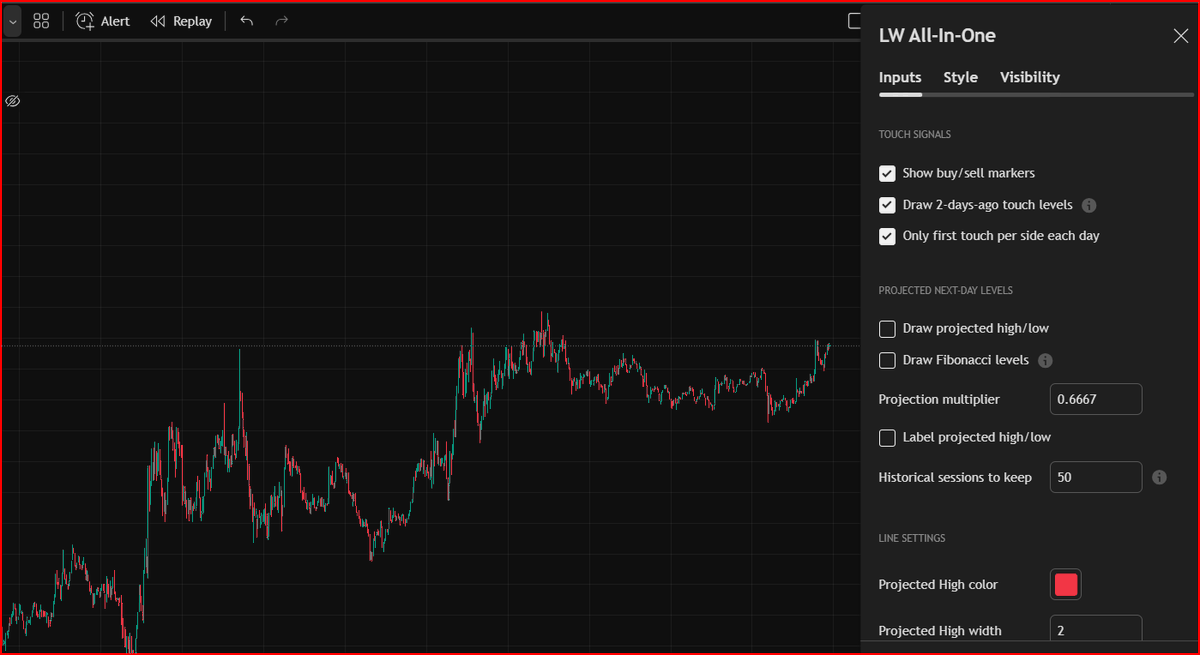
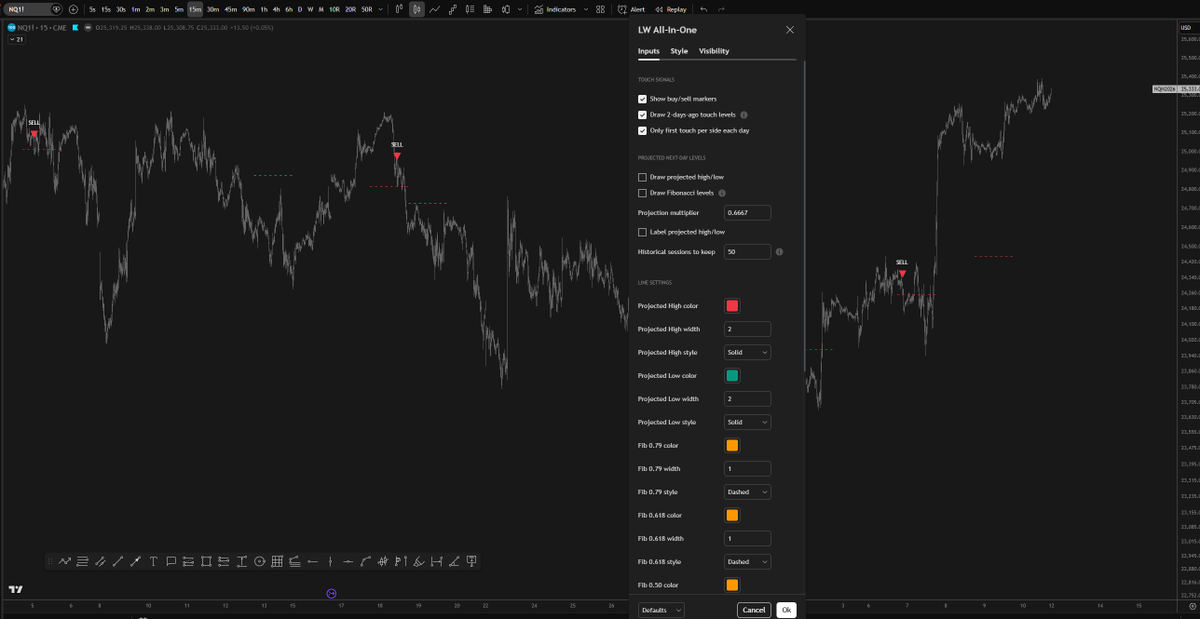
Katılım Ağustos 2023
108 Takip Edilen2.1K Takipçiler
FTMO.com
FTMO.com@FTMO_com·
40,000+ reviews on Trustpilot Excellent rating 4.8/5
English
13
3
77
6.7K
jay
jay@jay555b·
@TheRealDrip2Rip @grok tell this guy this type of indicator doesn't exist because it is not possible to access options data in pine script. Roast him because he is idiot who know how to use Claude to build things that is not real
English
1
0
0
333
Drip2Rip 🫵
Drip2Rip 🫵@TheRealDrip2Rip·
NEW FREE INDICATOR RELEASE! 🔻They're drawing lines on old price action. 🔻You're seeing the board before the game starts. ✅GEX FlowMap plots the exact zones where dealer hedging creates support, resistance, and breakout conditions automatically. Every morning. Before the bell. 7 levels. Real-time reads. Session-aware intelligence. Zero guessing. This doesn't exist anywhere else on Tradingview. I checked. tradingview.com/script/g86QwHh…
English
25
26
170
45.9K
Ray
Ray@jerkyray·
@jay555b Which indi is this bro
English
1
0
0
224
jay
jay@jay555b·
just probabilities, eh? 🎲📈
jay tweet media
English
7
0
20
2.1K
Godsgirl
Godsgirl@Gdsgrl7·
@jay555b Hi Jay! Can you please run the probabilities for times during Power Hour in the afternoon? Maybe 1pm and 2pm? :)
English
1
0
0
78
jay
jay@jay555b·
Statistical Observation: Nasdaq(NQ1!) Hourly Range Mean Reversion I analyzed NQ1! historical price action to measure the probability of price returning to the mid-level of a specific hourly range after a break (sweep) occurs. Methodology : The study defines a "valid return" as price touching the 50% level of the previous hour's range within a 3-hour window immediately following that hour. The Outlier 07:00 - 08:00 Range :The data shows a significant statistical anomaly during the 07:00-08:00 window. Probabilities (Return within 08:00-11:00) : High Sweep Reversion: 83.2% Low Sweep Reversion: 82.7% Average Probability: ~83% It is an interesting anomaly. You should check this on your own charts to see how price behaves during this specific window. #DataAnalytics #Quant #NQ #Futures #NQStats
jay tweet media
English
18
11
165
18.7K
jay
jay@jay555b·
@Chase_ICT @StoicTA Bro it is too much of math for him, he only knows how to count to 5
English
2
0
1
117
𝘾𝙝𝙖𝙨𝙚
𝘾𝙝𝙖𝙨𝙚@Chase_ICT·
After reading the replies on this post, it seems like you’re not the only retard here xD Anyway, I’ll do you a favor and explain why it gives 25% winrate: If price moves randomly with a 50/50 chance up or down, your trade wins only if price reaches +3R before it hits −1R. Since your stop is 1R away but your target is 3R away, price has a much shorter distance to lose than to win. In a random market, the probability of hitting the closer level first is higher, so the chance of reaching +3R before −1R is 1 out of 4 possible outcomes, which equals 25%. Now you know ;)
English
6
0
25
9.9K
Stoic Trader
Stoic Trader@StoicTA·
imagine calling someone a retard and then saying a coin flip gives you a 25% win rate I was trying to help him... but then I saw ICT in his handle...
Stoic Trader tweet media
English
16
0
50
18.5K
jay
jay@jay555b·
there is nothing funny here :d you are just lazy enough to not understand the constraints :d. 1)It is impossible to make it "work in bull" with 22% winrate IF YOU ARE AIMING FOR 3RR. 2)It says trade direction is random using a coin flip logic, which is not "go long only" 3)Only way for your statement to become true you have to extend your TP level beyong 3R using trailing stop. Don't try to be smart if you are not :)
English
0
0
0
307
jay
jay@jay555b·
Stop distance = 1 * ATR(14) Target distance = 3 * ATR(14) you don't have to act smart to seem cool. I have a suggestion for you. Since I can say you are not interested in stats or coding, you can go to tradingview, export 4H chart data of NQ or whatever, give it to any AI and tell the exact strategy. coin flip for direction and 3R profit target risking 1R, what will be the winrate. And comeback here tell me the results...
English
1
0
0
231
Slvmmed Capital
Slvmmed Capital@_Slvmmed·
@jay555b You have to genuinely be slow to believe this. How do you decide your stop for this flawless strategy
English
1
0
0
245
jay
jay@jay555b·
@save11tw He is making fun of a person which states the correct fact lol. Look at his post’s comments, everyone thinks it is 50% winrate 🤣
English
0
0
0
174
Wanderer
Wanderer@save11tw·
@jay555b Well he proves that you don’t need to be smart to be profitable
English
1
0
0
182
jay
jay@jay555b·
@algospirit Imagine making 50R per week and your bio looks like this 🤣🥲
jay tweet media
English
2
0
3
494
jay
jay@jay555b·
@algospirit Oh yeah I missed that you guys all making 50R per week at least your mentor says so 🤣🤣🤣
English
2
0
6
794
Pedo Killer
Pedo Killer@BrayanWisd82763·
@jay555b I get it, it is all market structure, yet nobody made me grasp this simple reversal pattern as @StoicTA just by counting 1 to 5.
English
1
0
1
88
jay
jay@jay555b·
I see so many renamed "paid models" where you count to 5 and suddenly you're profitable. Even the free ones doing the same thing. Why rename it? It's just Market Structure. That's it. They rebrand it to make it sound attractive to new traders who don't know any better. Just learn: Market Structure (There are so many sources which explains it wrong , you can check photon youtube video for correct Market Structure) Fibonacci retracements Premium/Discount zones WHY these concepts work (most importantly) Understand the logic behind price action. Not the fancy labels someone slapped on it. "4/5/6 swing model" , "SBS", "Shithole Model" Same concepts. Different packaging. Learn the fundamentals. Master the execution. Keep your money. Stop paying for rebranded market structure just because someone gave it a catchy name.
jay tweet media
English
17
8
79
30.4K
RoKo
RoKo@Lemuel_TM_·
@jay555b That's a shark pattern that ICT says doesn't work.
RoKo tweet media
English
1
0
1
814