Tomas@TomasOnMarkets
💵 "Not QE, QE" will commence within the next 14 days
The US Government will soon begin a drawdown of the Treasury General Account (TGA).
This could mean a liquidity injection totaling up to $830bn.
Functionally, this is similar to Quantitative Easing.
Here's what will happen...
🤔 So what's going on?
The US Government hit its self-imposed "debt ceiling" of $36 trillion in late January.
This means the Treasury can no longer take on additional debt until a new debt ceiling agreement is reached (this has historically involved raising or suspending the ceiling).
The Treasury has since been deploying "emergency measures" - a total of roughly $338bn in what are essentially accounting gimmicks and financial maneuvers.
On Friday February 7, the Government had used up more than 60% of these measures, with only $133bn left.
That means, probably this coming week or the week after, the Treasury will be forced into drawing down the TGA to fund spending, until a new debt ceiling agreement is reached.
🤔 So what does a TGA drawdown mean?
The TGA can be thought of as the Government's bank account at the Federal Reserve.
It currently has a sizable balance of $830bn.
This money is currently sat idle at the Fed - so it is "removed from markets".
If the Government begins to draw down the TGA, this is an injection of "new" liquidity into markets.
A TGA drawdown and Quantitative Easing (QE) are functionally similar in that both inject liquidity into the financial system by increasing bank reserves.
While not strictly "QE" - it looks like QE, sounds like QE and smells like QE, which is why it has been dubbed "not QE, QE".
And the impact of debt ceiling-induced TGA drawdowns on financial markets can be similar to QE, on a temporary basis.
In the past, significant TGA drawdowns have generally coincided with asset price appreciation.
The TGA drawdown in 2022/2023 started halfway through a bear market, and was arguably one the main factors in halting that bear market.
🤔 So what's the TGA path?
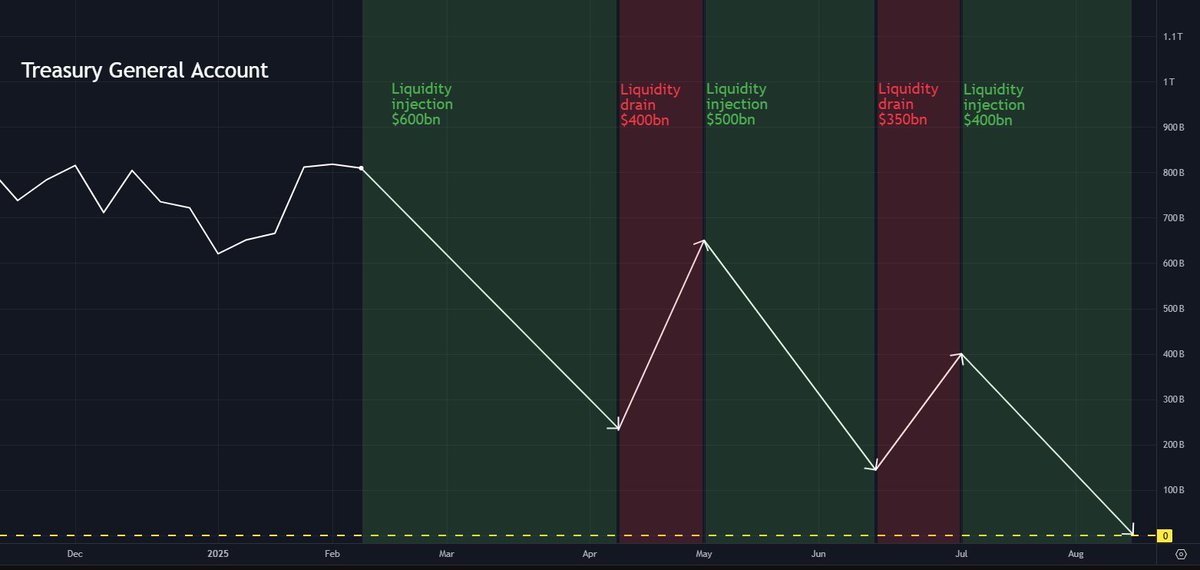
Analyzing all the components of the TGA, Treasury spending, borrowing and expected tax intakes, my rough estimated path for any potential coming TGA drawdown is below:
Any potential prolonged TGA drawdown will straddle two tax intake periods (April and June), so it will be punctuated by two short-term TGA balance increases (liquidity drains).
The first "portion" will take place between roughly mid-February and early April and I estimate it will total about $600bn in liquidity additions.
The estimated path in the chart above won't be perfect, but it is a guide to what is likely to happen.
It could vary as time passes.
How far along this path we will get depends entirely on how quickly lawmakers come to a new debt ceiling agreement.
What is known as the "X-date", the day that the US Government officially runs out of money, is currently looking like it will probably be some point in August.
This TGA drawdown is practically set in stone, and is essentially non-negotiable if the US Government wants to keep functioning.
If lawmakers follow a similar "debt ceiling discussion path" to previously, they will leave things late and finally come to a new agreement at some point in July/early August.
This will allow for a significant TGA drawdown.
🤔 Other considerations
However, there are a number of nuances and considerations to take into account, and I set these out in a more detailed post quoted below.
If you are interested in this debt ceiling/TGA drawdown dynamic, I would urge you to also read that post.
To determine the total "net" liquidity injection from the Federal Reserve over any potential Treasury General Account drawdown period, all aspects of the Fed's balance sheet should be taken into account (both liquidity adding and liquidity draining).
This total "net" injection will be reflected in the below Net Federal Reserve Liquidity chart.
This chart has already increased by roughly $240bn since January 1 2025.
I will continue posting updates of this chart here on X.