Kay | 🌺 retweetledi
Kay | 🌺
703 posts

Kay | 🌺
@keon_zero
spiraled into trenches, tauren chieftain https://t.co/0cP0ErXmyz
Katılım Ocak 2021
3.6K Takip Edilen2.6K Takipçiler

Kay | 🌺 retweetledi

The author of this piece is our teammate — a legendary trader who predicted the drop from the 90k level to the 60k level.
Layergg@layerggofficial
🏄♂️BTC(Beyond The Candle) - Technical Analyze (12/11) 1. BTC Monthly Chart — Three Uptrend Criteria & Technical Weakness Signals Red line = 20 EMA / Orange line = 20 MA 1) Uptrend Criteria on the Monthly Chart (Three Conditions) 1/ MACD Golden Cross remains intact 2/ Monthly candle closes above both the 20 EMA and 20 MA 3/ 20 EMA and 20 MA maintain a Golden Cross (20 EMA stays above the 20 MA) In the green-circled areas, all three conditions were satisfied, supporting a continued bull market. 2) 2018 & 2022 Cases 1/ Condition #1 broke first (yellow box). 2/ Two to three months later, conditions #2 and #3 also broke (red arrows). 3/ After that, the market shifted into a downtrend and a prolonged accumulation phase. 3) Current Situation Condition #1 has already broken, and conditions #2 and #3 are also at risk. It remains to be seen whether conditions #2 and #3 will break again—similar to previous cycles—potentially signaling entry into a bear market. 2. BTC Weekly chart: bullish momentum has been completely lost. The weekly candle has clearly entered a downtrend. 1) RSI The RSI 44 level has served as the momentum baseline for the uptrend that began in September 2023. With the decline in November 2025, the RSI broke below 44, signaling a loss of bullish momentum. 2) Trendlines Both the white ascending trendline and the green ascending trendline have been broken. Price is currently making a retest bounce on the green trendline. There are no remaining lower ascending trendlines supporting the structure. Given this, the weekly chart is considered to be in a downtrend, and unless price reclaims the green ascending trendline, further downside continuation is likely. 3) Possible Support Zones if Downtrend Continues - 78k - 69–71.5k - 58.7–60.2k - 47–52k If the weekly downtrend continues and the monthly downtrend is also confirmed, a correction toward 58.7–60.2k is the most reasonable expectation. A drop below 47–52k is unlikely, but if it does occur, it would be considered a full-allocation buying zone. 4) Invalidation Level If Bitcoin closes a weekly candle above 105–107k, the weekly uptrend can resume and the current bearish weekly structure would need to be reevaluated. (105–107k corresponds to the zone where the November 2025 decline broke RSI momentum.)
English
Kay | 🌺 retweetledi

@VitalikButerin Shut the fuck up, stop selling god damn eth like a bitch
English
Kay | 🌺 retweetledi

지금부터가 진짜 빌더들의 시간이다.
절대 멈추지 않고,
국경의 한계가 없으며
누구나 쉽게 접근 가능한 네트워크와 함께
많은 시도를 해볼 시간.
한계가 없으니 규제와 충돌하고
누구나 쉽게 접근 가능하니
투기판이 벌어지기도 한다.
그러나 잊지 말아야 할 본질은
결국 멈추지 않는 신뢰 네트워크를 통해
자기 주권에 대한 의지가 펼쳐지는 장소가
여전히 여기라는 점이다.
인간은 언젠가 죽고
그러므로 세상 그 어디에도
영원한 제약은 존재하지 않을거다.
그러니 제약없이 10년 뒤의 미래를 상상하고
사람들이 동참할만한 도전을 시작하자.
그게 가장 나다워지는 유일한 방법일거다.
한국어
Kay | 🌺 retweetledi

Closed shorts on Thursday with a decent gain.
As BTC held 98/100k past few days at pivot zone, I flipped longs in the past few days as Risk to Reward became favorable again, with crypto showing strength on Friday when US equities were still weak
Added more longs today as Trump announced 2k cash distribution to lower-income group. This has 2020 cash distribution vibes with money printing led BTC to pump from 6k to 68k
Shorts covering is already happening and pumping the market. Bears are forced to close shorts or get rekt
This might mark the turning point of bull market resumption 🔥
English
Kay | 🌺 retweetledi

Kay | 🌺 retweetledi
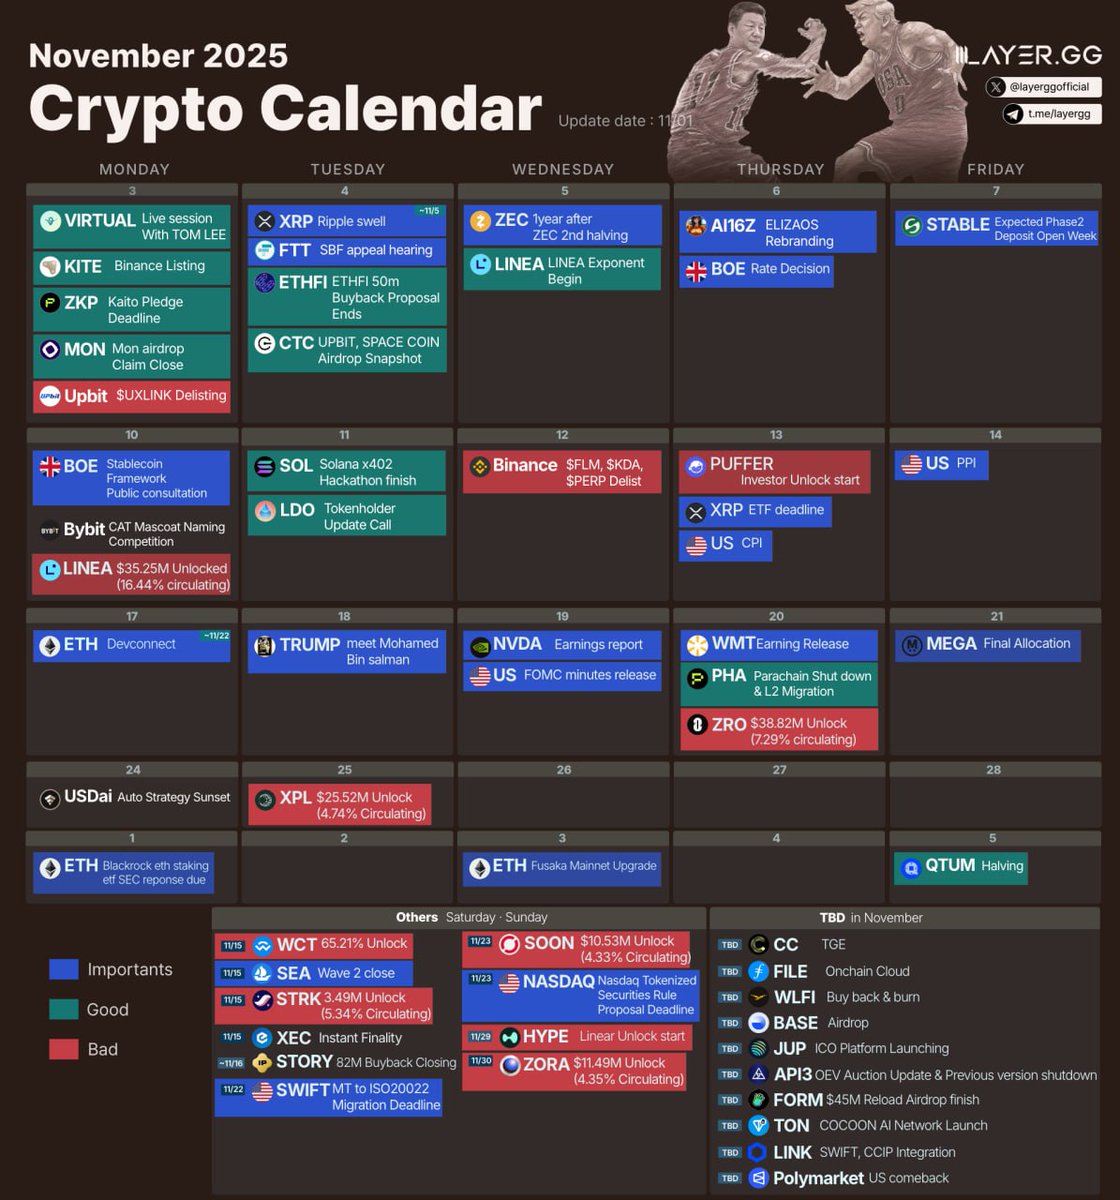
🗓 2025 Crypto November Calendar
Nov 3 : $VIRTUAL - AMA with Tom Lee
Nov 3 : $UXLINK - Upbit Delisting
Nov 3 : $MON - Airdrop Claim Close
Nov 3 : $ZKP - Kaito Pledge Deadline
Nov 3 : $KITE - Binance Launchpool & Listing
Nov 4 : $ETHFI - 50m Buyback Proposal Vote End
Nov 4 : $XRP - 11/4 ~ 11/5 Swell
Nov 4 : $FTT - SBF Appeal Hearing
Nov 4 : $CTC - Upbit Spacecoin Airdrop Snapshot
Nov 5 : $LINEA - Exponent Begin
Nov 5 : $ZEC - 1 Year After 2nd Halving
Nov 6 : $AI16Z - ELIZAOS Rebranding
Nov 6 : BOE - Rate Decision
Nov 7 : Stable - Expected Phase 2 Deposit Open Week
Nov 10 : $LINEA - $35.25M(16.44% of Released Supply) Unlock
Nov 10 : BOE - Stablecoin Framework Public Consultation
~ Nov 10 : Bybit - Cat Naming Competition
Nov 11 : $LDO - Tokenholder Update Call
~ Nov 11 : $SOL - x402 Hackathon
Nov 12 : Binance($BNB) - Delisting $FLM, $KDA, $PERP
Nov 13 : US - CPI
Nov 13 : $XRP - XRP ETF Deadline
Nov 13 : $PUFFER - Investor Unlock Start
Nov 14 : US - PPI
Nov 15 : $STRK - $13.49M(5.34% of Released Supply) Unlock
Nov 15: $WCT - $17.72M(65.21% of Released Supply) Unlock
Nov 15 : $XEC - Instant Finality Luanching
Nov 15 : Opensea - Wave 2 Close
~ Nov 16 : $IP - 82M Buyback Closing date
Nov 17-22 : $ETH - Devconnect
Nov 18 : $TRUMP - Trump Meet Mohamed Bin Salman at White House
Nov 19 : FOMC - Minute Release
Nov 19 : $NVDA - Earning Release
Nov 20 : $ZRO - $38.82M(7.29% of Released Supply) Unlock
Nov 20 : $WMT - Earning Release
Nov 20 : $PHA - Parachain Shut Down & L2 Migration
Nov 21: $MEGA - Final Allocation
~ Nov 22 : SWIFT - MT to ISO20022 Migration Deadline
Nov 23 : $SOON - $10.53M(4.33% of Released Supply) Unlock
Nov 23 : NASDAQ - SEC due to respond to the Nasdaq tokenized security rule proposal
Nov 24 : USDai - Auto Strategy Sunset
Nov 25 : $XPL - $25.52M(4.74% of Released Supply) Unlock
Nov 29: $HYPE - $428M Linear Unlock Start
Nov 30: $ZORA - $11.49(4.35% of Released Supply) Unlock
Dec 1 : $ETH - Blackrock ETH Staking ETF - SEC Response Due
Dec 3 : $ETH - Fusaka Mainnet Upgrade
Dec 5 : $QTUM - Expected Halving
👀 TBD in November
$WLFI - Use 100% of WLFI Treasury Liquidity Fess for Buyback & Burn
$JUP - ICO Platform, First project humidify
$BASE - Airdrop
$CC - TGE
$FIL - Onchain Cloud
$API3 - OEV Auction Update
$FORM & $BNB - $45M Reload Airdrop Finish
$TON - Cocoon AI Network
$LINK - SWIFT & CCIP Integration
Polymarket - US Comeback
* * *
💞 Please Like + Retweet if you enjoy this November Crypto Calendar.
➬ Follow me @layerggofficial for more🫡
🔗Sharing is welcome, just a nod to the source would be appreciated.
English
Kay | 🌺 retweetledi

'the LORD gave, and the LORD hath taken away; blessed be the name of the LORD' — Job 1:21
yesterday's liquidation event is the most brutal i've witnessed in my time in crypto
i got wiped out on ALL my perps positions
literally everything
eight figures: $30 million+ at peak uPnL if realized, or well above $15 million just before the liquidation started
100% of the following perps position got wiped:
- $BONK
- $FARTCOIN
- $POPCAT
- $PNUT
- $CAT
- $APEX
- etc
i lost maybe 80% of my $ASTER position that i used as a collateral on a DeFi lending protocol
i took out the remaining (~$1 million), fully liquidated it and rotated it into $BONK and $4 because i think i get better R/R from both from here on out:
- BONK because i refuse to be a 'bonk guy' without BONK exposure, and i remain convinced in my deca-billion-dollar target for it. i will continue to add more over time, God willing
- $4 because i remain strongly convinced that BNB season continues until the end of this quarter and i think $4 is the most asymmetrical bet to capitalize on that
thankfully the overwhelming majority of my $USELESS coin position is held in spot, so i didn't record significant loss on that — maybe with the exception of mid six figures worth of uPnL i had in perps accounts
i am still resolutely convinced that $USELESS is THE memecoin to watch for outperformance from here on out, that it is a multi-billion-dollar narrative currently trading for pennies on the dollar, and that it will end the cycle being a top 5 memecoin at the barest minimum i.e. certainly has a lot more than 10x upside from here. so i’m glad contagion there was contained for me!
what happened yesterday?
everyone blames the recent Trump-China tariffs, but this isn't the first time we've had that this year
and the Trump tariff comments certainly shouldn't have been responsible for such a massive nukage across almost the entirety of altcoins and memecoins in the space
a lot of altcoins crashed 70 to 99% in minutes, when $BTC and $ETH barely crashed 13%
$ATOM, for example, crashed from $4 to $0.001 on top exchanges like Binance — a 99.9% crash in minutes. no one could have humanly responded to that!
it is also worth noting that this massive altcoin/memecoin crash was EXCLUSIVELY on CEXs. these altcoins did not come close to hitting these levels on spot DEXs, so yesterday's liquidation was almost certainly due to MM/CEX liquidity issues
why it was unprecedented (market mechanics)
many people reported being massively affected, especially since exchange systems broke across the board: stop losses failed, orders didn’t fill, margin couldn’t be added, and platforms became unusable within minutes. the entire liquidation cascade happened so fast that almost no one had time to react, something i don’t think we’ve ever seen at this scale before
i was in front of my screen, took a short break, came back to the screen to see the nasty wick about 10 minutes later, then realized i've been liquidated on EVERYTHING i had in perps
it is the craziest crypto event i have witnessed, ever!
it was worse than COVID, which was a black swan event
you could say whatever you want about this event: you can call it manipulation, unnatural, or whatever else
you would be right tbh
however, whether or not manipulation played a role doesn’t change what i have to do next: as a trader, i am only ultimately concerned about things i can actually control
of course it's easier to point out how it all wasn't my fault and how someone else was responsible, but how does that help me grow as a trader? i win if i make money trading, i lose if i lose money trading. end of!
i'm sure we will be hearing more about exactly what happened yesterday night, which will hopefully help give some people closure
i wish i didn't have to write about this:
this will likely be one of the most viral tweets coming out of this event
many have waited for this moment: 'he is so greedy!'
and there will be an army of people mocking me with 'I TOLD YOU SOs'
but write i must, for a few reasons:
1. a key part of the 'bonk guy' persona and identity i have built is one of utmost transparency around my trades, so others can learn
2. while i lost a fortune in the liquidity wipe event, i have a very diversified basket of alts across perps and spot. i'll be fine; my spot assets are safe. but i think there are people who lost literally everything they have right now that might be having very bad and nasty thoughts, and them seeing a voice like mine at this time just might give them hope
i want to be very clear:
1. i do not need your empathy. i appreciate that some would have the thought, but i do not need people messaging me to empathize with me over this
2. i do not need donations or financial support. it was a massive loss, but i'm okay
i also want to emphasize that i'm in a very good mental state right now, as difficult as that might be for many to believe
i've always been very detached from money and material things, and that makes it easy to cope with situations like this
at the end of the day, my $BONK trade was a trade in which i went from $16k to a peak 8-figure PNL
contrary to what seems to be the most common belief here, it isn't my most impressive trade. if i made it before, i can make it once again!
could i have foreseen exchange systems crashing and nuking the most liquid altcoins and memecoins in the market 70 - 90% in mere minutes before anyone could react? no!
could i have maybe done a few things differently leading up to this event? maybe
however, i am a big believer in focusing on what *could* happen and taking action to get there instead of focusing on what *has* happened
the past is the past, and what has happened has happened
there are a lot of changes i’ll be making to my systems as a result of this: less dependence on leverage, sharper risk management, and a stronger focus on protecting my positions from exchange-side risks going forward
all that matters is what happens from here on out...
i remain very optimistic about the market
i do not believe the bull run is over, nor do i think the Q4 rally is out of the picture
so what do i do from here?
lock in more than ever before, be buried deeper in the trenches, and most importantly have fun while i do it!
if there is one thing i have learned after being in this industry for multiple cycles, it is that there is always new opportunities: every day, every week, every month
i have always been one to love a challenge, and i guess this is another one for me and an opportunity to once again prove myself — not to internet strangers, but to myself
this event has not dampened my spirit, not in the slightest. if anything, it has strengthened my resolve to get back in the ring, fight, and win bigger
i will make it all back, and more!
for those who are in a similar situation, who either lost a fortune or lost it all, i have some words for you:
PERSIST
SURVIVE
DON'T GIVE UP
if you need to take a break, please do
if you're struggling to hold it in, please seek help
above all, pay special attention to yourself and focus on your health
i know it will take a while for the gravity of what happened to hit many, but a philosophy that has always helped me to survive massive drawdowns is internalizing all of these crypto gains as just numbers on the screen — until it is realized at least!
i know they can have very real consequences in the real world if/when cashed out, but right now i think internalizing it as just numbers on the screen would make dealing with the loss more bearable
you made it before, so yes YOU can make it again
the most profitable period of the cycle is still well ahead of us
we are all going to make it
and you are going to have me along on this journey with you, if that matters to you!
if there’s one thing this taught me, it’s that no matter how prepared you think you are, you’re never fully protected from systemic shocks — but you can always control your response. i’ll be rebuilding my framework with that truth in mind!
i am once again an underdog, and this is not the end of my story
GOD WILLING

English
Kay | 🌺 retweetledi

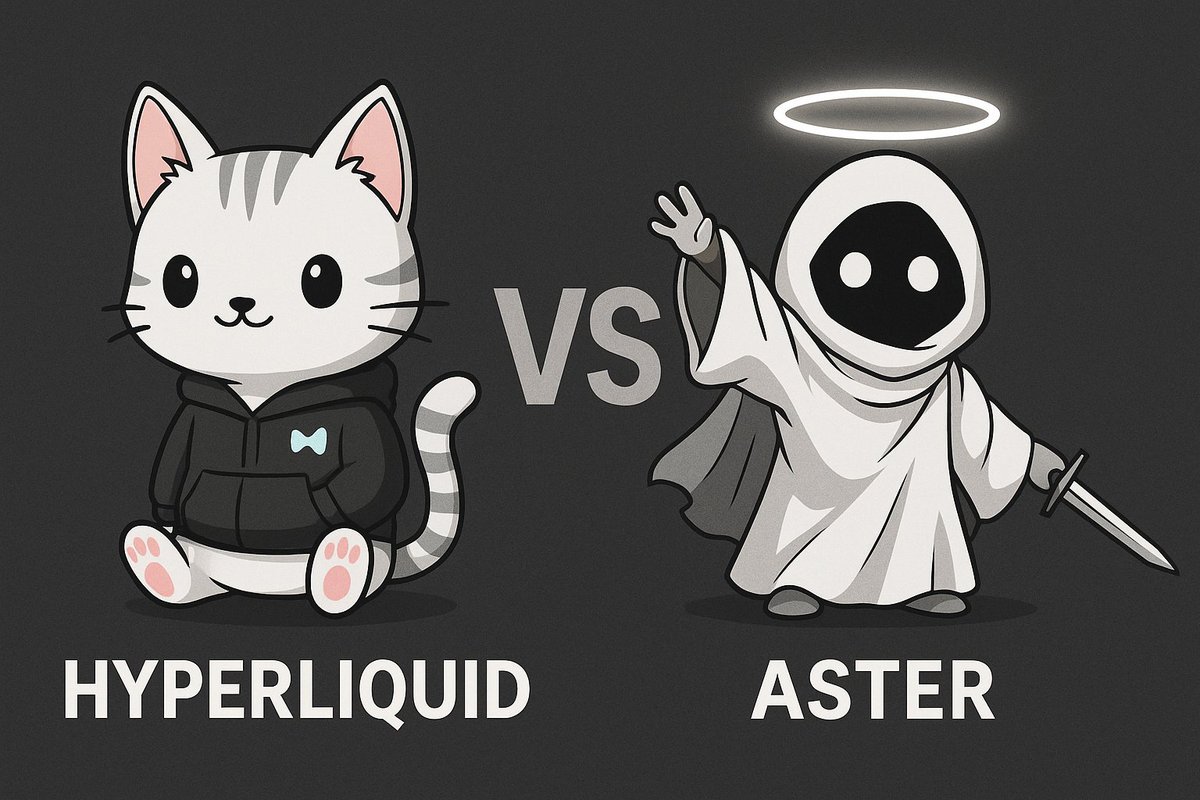
The rivalry between @HyperliquidX and @Aster_DEX has been one of the most interesting stories this cycle.
Hyperliquid’s meme representative was $Purr, while Aster has $Dust.
Comparing the relative values of Dust vs Aster to Purr vs Hype, it seems Dust could still have more upside potential.
nfa.
@DustonBNB
English
@manicdistopia update dexscreener for green degens get to know more about $PEPETUAL
English
Kay | 🌺 retweetledi

You’ve waited 4 years for the next 3 months. #crypto
English
Kay | 🌺 retweetledi

Kay | 🌺 retweetledi

Kay | 🌺 retweetledi

Kay | 🌺 retweetledi

🏆 Higher $10K Trading Competition – Final Results
Congrats to all the winners 🎉
🥇 0x55...ce11
🥈 0x65...3f6a
🥉 0xef...7df6
4⃣ 0x04...d7fd
5⃣ 0xfe...628c
6⃣ 0x9b...a6c0
7⃣ 0xba...8473
8⃣ 0x52...6f19
9⃣ 0xc1...a9fc
🔟 0xea...33eb
Prizes will be distributed to the competition wallets within 7 days from today.
___
🤔 What rank did you get?
👉 Flex your spot on the leaderboard and let the world know: app.higher.bot/en/contest

English
Kay | 🌺 retweetledi

Kay | 🌺 retweetledi


Kay | 🌺 retweetledi

We've entered the stage where you want to be positioned in the pre-expansion phase of "PVE mode" for the coins
Do you want to be right or make money?
Drop the ego, see ya onchain

pow🧲@traderpow
Drop the ego, don't leave money on the table. In a traders perspective, this is the most optimal and opportunistic mode you want rn. see ya onchain, gl
English