Khalid Ashour

206 posts

Khalid Ashour

Khalid Ashour

@kmmashour

MIT. ex-Facebook and Twitter
New York Katılım Temmuz 2011
784 Takip Edilen296 Takipçiler
Khalid Ashour
Khalid Ashour@kmmashour·
@ZaStocks This assumes the market behavior is the same today as it was 25 years ago. If there is a dotcom equivalent it’s not going to play out the same
English
0
0
0
46
Za
Za@ZaStocks·
Here’s the Nasdaq at the peak of the dot com bubble. “You won’t be able to time the top.” Sure but there will be signs. People who act like the stock market cratered 80% overnight are just trying to get engagement and fear monger. Not only did the stock market not crash 80% overnight, but it was a drawn out process that took over two years to bottom. There were plenty of signs that something drastic changed. A few: - Key weekly moving average breaks in the Nasdaq - Big red candles on the major indices - Cycle leaders topping/weakening This chart shows a clear character change before the big crash that took place in late 2000 into 2001+. Even if you didn’t sell at the top and sold 15% lower you still missed a 70% drawdown. There will be signs when the top is in but you don’t need to exit at the exact top.
Za tweet media
English
102
116
1.1K
115.7K
Khalid Ashour
Khalid Ashour@kmmashour·
@DeepValueBagger Saying Shopify's value is the software that can be copied is like saying the value of Visa is the plastic cards they distribute
English
1
0
3
469
DVB
DVB@DeepValueBagger·
For some stock like $shop, the price multiples look cheap, revenue looks like it grows ( like $duol), you have to ask yourself why the market is bearish? Here's my hint to you, look further in the future and how disruptive AI for the business. Shopify big sell is it has hundreds of plug and play features. Most stores only need a few. Bloated platform is riped for agentic ai disruption toward custom solution that can be built with a prompt. Maybe not today for everyone but the market is moving fast and you don't see it yet (unless you're a developer deep in this space) until it kills you.
English
12
1
55
14.3K
Khalid Ashour
Khalid Ashour@kmmashour·
@Basssem666 There is a specific definition for what a flag is, this isn't one.
English
2
0
2
137
Bassem
Bassem@Basssem666·
$BTC $SPY I don’t own or trade crypto, but I think Bitcoin tells the real story here. It’s the asset that can’t be manipulated by governments and it’s showing the real picture. It’s in a downtrend, bear flag after another, and I think the current one may play out soon. Perhaps it’ll take equities down with it.
Bassem tweet media
English
33
10
120
11.2K
Bassem
Bassem@Basssem666·
$SPY This rally has been remarkable no doubt about that, but the volume is very suspicious. I’m not trying to be a perma bear and I’m not, i go long when i see fit. Despite that I still underestimated the extension of this rally and took multiple losses trying to short it. Owned my Ls and moving on. I’m currently neutral, not bullish, nor bearish, and I’ll explain why. The volume on the weekly declined as we went up, the monthly looks funny as far as volume, really pathetic so far but there are still two weeks to go. Nonetheless, with how much the index went up it should be a lot more. This lack of volume says smart money isn’t buying. I’m not calling for new lows or anything yet but just caution. This rally is still very suspicious regardless how historic it is. Price is currently at a rejection zone between 700-705. If price rejects then we’ll start correcting a little. If price holds above then the next level on my fibs is around 710- 713 and that’s crazy without a pullback, but I’m ready for anything at this point to be honest. The first phase of the correction whenever it starts should resolve around 682-678, won’t be in a straight line as there are many supports above, but eventually it should get there, then we will see whether the bulls or the bears are in control. If the 670s hold it’ll be a buyable dip. Technically, even if the correction extends to fill the gap (660) or tag the 200 dma from above it will be a buyable dip as well, if the levels hold of course. If price starts to make higher highs again from there then we’ll likely go for 713 or even higher on SPY, that’ll be super bullish. If price drops below 659 and fails to reclaim it then we are going to test 648-644, if this support fails too then price is heading towards the March low and may even break it. Ultra bearish. It’s still 50/50 between the bulls and the bears despite the massive rally. The volume is very suspicious. No bias. One level at a time.
Bassem tweet mediaBassem tweet mediaBassem tweet mediaBassem tweet media
English
48
17
364
85.3K
Khalid Ashour
Khalid Ashour@kmmashour·
Not a bull market. Big dip incoming (1-2 weeks)
English
0
0
2
30
Khalid Ashour
Khalid Ashour@kmmashour·
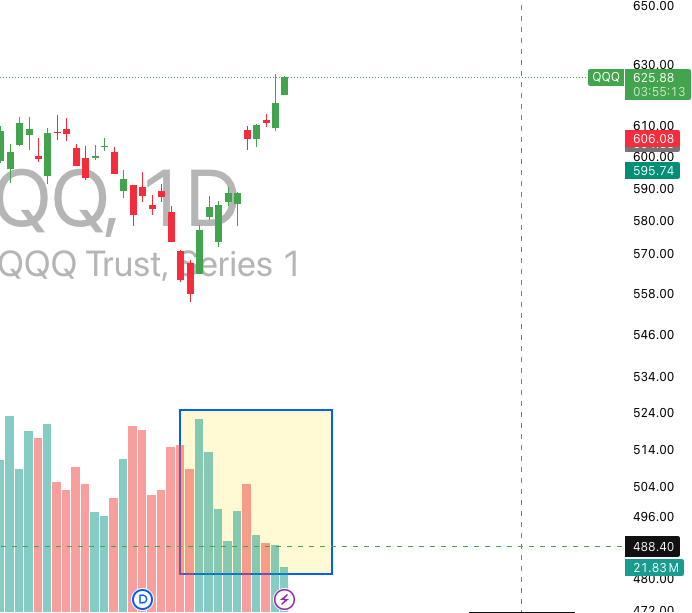
@WheelieInvestor This whole "low volume" thing needs to die, it has no indicative or predicative value whatsoever. Look up previous recoveries
English
0
0
4
330
The Wheelie Investor
The Wheelie Investor@WheelieInvestor·
Look at the declining volume on $QQQ Volume has been very low the past few trading sessions This makes me weary of this huge pump
The Wheelie Investor tweet media
English
60
20
233
29.8K
First Squawk
First Squawk@FirstSquawk·
Bessent said the economy was “very strong” through January and February, Semafor reports.
English
5
2
12
10.3K
The AI Investor
The AI Investor@The_AI_Investor·
If MU doubles from here, its forward P/E would still be below 10, based on current analyst estimates.
English
19
15
283
27.4K
Kurt S. Altrichter, CRPS®
Kurt S. Altrichter, CRPS®@kurtsaltrichter·
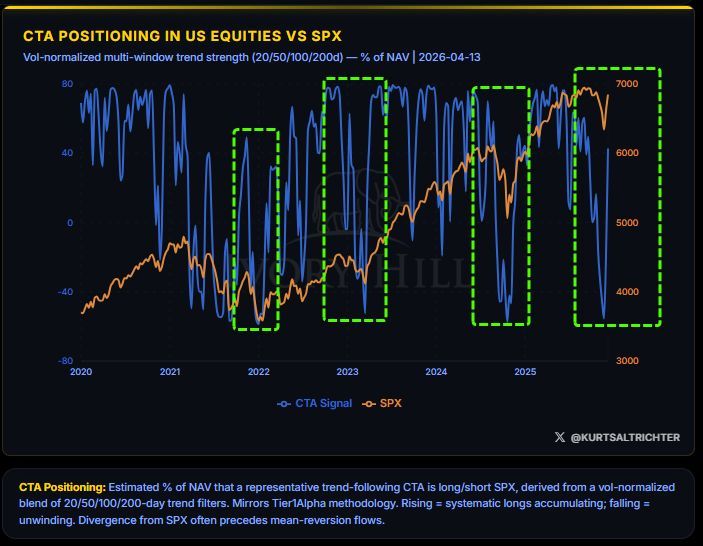
Algos hit the buy trigger last week. CTA positioning is rising off deeply negative levels. Worth keeping an eye on.
Kurt S. Altrichter, CRPS® tweet media
English
4
13
71
6.6K
Ben Kizemchuk
Ben Kizemchuk@BenKizemchuk·
Been front office for nearly 20years this nov. Every bit of that experience is saying vibe is way off. Uncanny.
English
18
4
256
41.5K
Bassem
Bassem@Basssem666·
$SPY No all time high without at least a gap fill to 660 in my opinion.
Chirag@chirko8721

@Basssem666 Do you still think we don’t go ATH from here because the rally has sustain all the way from 630 to 680


English
46
12
255
53.3K
GGEN5 ⚡ HHK | ワールド生成 × ベンチ
@Mark4XX lol you think you can squeeze the us government who has unlimited money and cheats the system everyday 🤣🤣 the government can just dump 10 million physical barrels directly into the Gulf Coast to instantly crush your $170 fantasy. Give it up.
English
6
0
2
1.5K
Mark
Mark@Mark4XX·
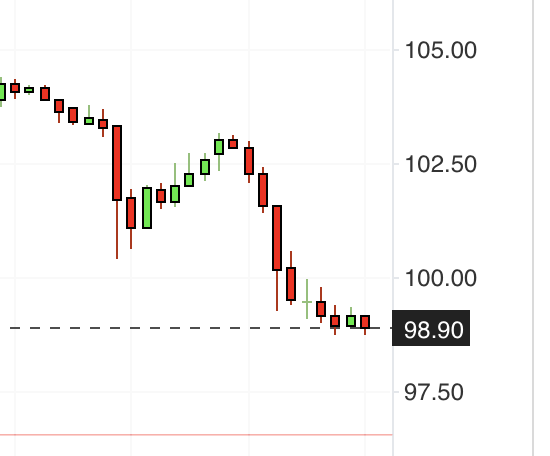
This desperate short-selling won’t end well. Delivery is due in 8 days. The spot market, then trading at $170, will be more than happy to take the oil for $98.90 🤡
Mark tweet media
Mark@Mark4XX

$50 OIL PREMIUM EXPOSED: SCREENS SHOW $104 WHILE PHYSICAL BARRELS ARE SCREAMING $150 Two oil markets are running in parallel right now. The financial screens flashing across the world show Brent futures around $102 to $104. But the physical market of real cargoes, refiners, and ships tells a completely different and far more alarming story. This extreme backwardation is no temporary glitch. THE PAPER VERSUS PHYSICAL WAR ➡️ Dated Brent has surged past $132 per barrel. ➡️ Forties Blend touched an incredible $147. ➡️ Asian benchmarks like Oman and Dubai trade at $50 premiums to futures. ➡️ Saudi Aramco posts record differentials as refiners battle for every molecule near the Gulf. THE RISK PREMIUM NO FUTURES CAN HEDGE ➡️ Every cargo now carries full war, mine, and blockade risk through the blocked Hormuz Strait. ➡️ South Korea, Japan, India, and China refiners are no longer bidding on price—they are fighting for physical barrels. ➡️ The physical market never believed the April 8 ceasefire and kept war-level bids. ➡️ It was proven right when diplomacy collapsed four days later. THE INFLATION GAP ALREADY HERE ➡️ Diesel now trades at $5.64 a gallon with trucking rates at $2.97 a mile. ➡️ March CPI energy component exploded 10.9 percent in a single month. ➡️ All of this is priced off the physical barrel, not the screen price. ➡️ Every inflation forecast based on Brent or WTI futures is missing $37 to $50 of real cost passthrough. THE PERSISTENT CRISIS AHEAD ➡️ This disconnect will not vanish quickly even if the blockade lifts. ➡️ Mine-clearing, tanker repositioning, and insurance normalization take weeks. ➡️ The battle for physical barrels is likely to stay severe for 4 to 8 weeks minimum. ➡️ Shortages hit import-dependent regions first while prices ripple everywhere else. THE BOTTOM LINE Most of the world still sees only the comfortable $104 screen price and assumes the crisis is contained. The physical market is screaming the opposite. The barrels—not the bets—will decide how hard the economy hits the wall. #OilBackwardation #PhysicalMarket #HormuzCrisis #RealOilPrices #HiddenInflation #EnergyShock #BarrelBattle


English
36
127
944
102.4K
Khalid Ashour
Khalid Ashour@kmmashour·
@Basssem666 Good call out but I don’t think it’s as much a risk factor now as it was in July 2024. Net speculative short yen was about 2x as much as it is now, and the rate hike came as a surprise back then. Not to say there is no risk of course
English
3
0
0
884
Bassem
Bassem@Basssem666·
$SPY What’s happening with the Japanese 10year yield is important because Japan has been the world’s main source of cheap money for a long time. For years, interest rates in Japan were extremely low, so big institutions would borrow money there at near zero cost and then invest that money into higher return assets like US stocks. This is known as the “carry trade,” and it has been a major source of liquidity supporting markets. When the Japanese 10year yield starts rising like this, it signals that borrowing in Japan is becoming more expensive and less attractive. As a result, those same institutions may start unwinding those trades meaning they reduce risk by selling stocks and bringing money back. This doesn’t mean the market has to crash immediately, but it does mean that one of the key drivers of liquidity is weakening. Less cheap money in the system typically leads to tighter financial conditions, lower risk appetite, and more fragile price action. So even if the market continues to push higher short term, a sharp move up in Japanese yields is a warning sign that the underlying support for equities is starting to fade.
JLoc@JohnLoc18

@Basssem666 Can you explain it for me please

English
28
38
547
75.9K
Josh Young
Josh Young@JoshYoung·
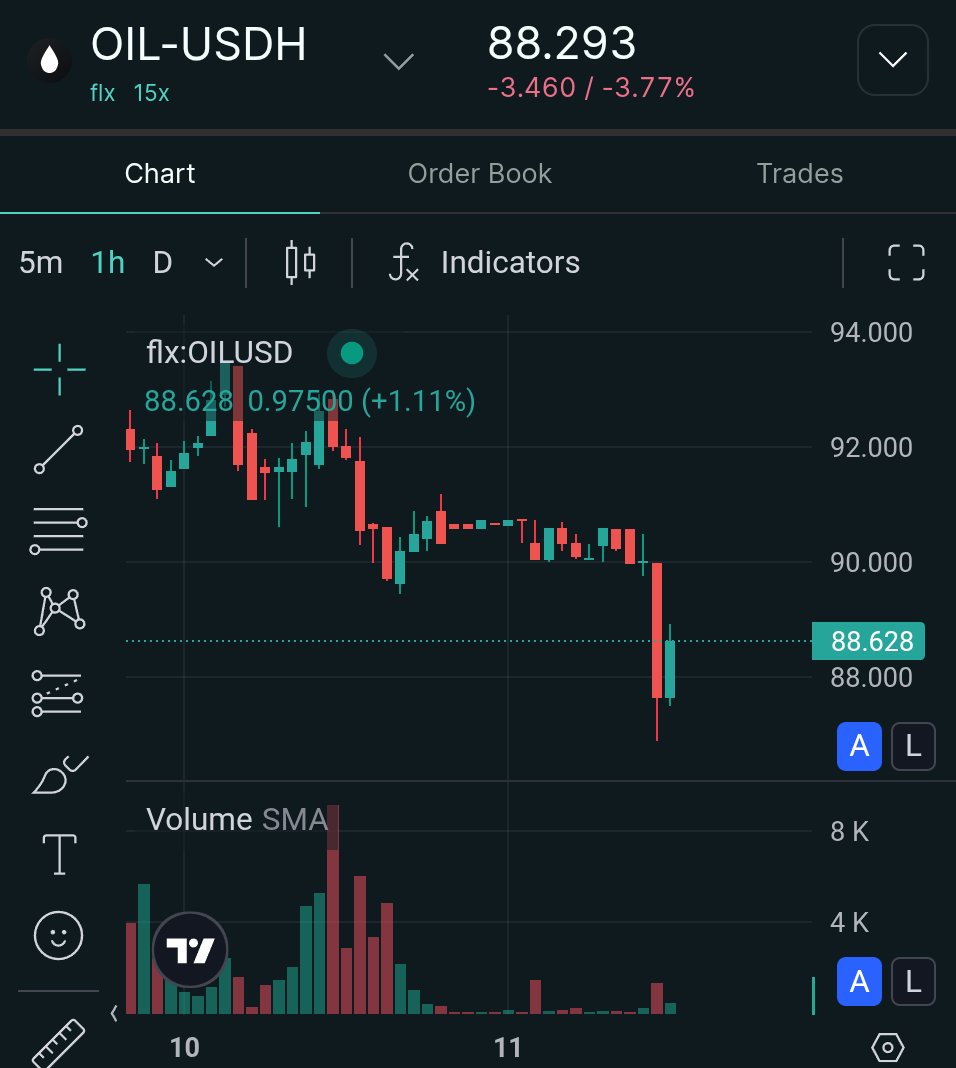
Weekend oil is down 3.8% on hyperliquid
Josh Young tweet media
English
43
10
267
38K
JLoc
JLoc@JohnLoc18·
If $SPY close below 675 today I’ll be able to cash out two months of paying bills + groceries 🙏
English
267
12
1.2K
255.4K