

Neil Pettinger
12K posts

Neil Pettinger
@kurtstat
Designs learning materials. Drives up and down motorways. Dissects health service data. Delivers training courses. Draws graphs.
Edinburgh, UK Katılım Aralık 2008
3K Takip Edilen1.7K Takipçiler

Agency for “the best", who "lack all conviction", and not so much for "the worst", who "are full of passionate intensity”.
This is so good from @catehall.
substack.com/inbox/post/198…
English
@RCEMPolicyVP @TJCoats @jo3hill Little's Law visualized as the area of a rectangle.
Height (How many?) × Width (How long?) = Area (How full?)
en.wikipedia.org/wiki/Little%27…
English
English

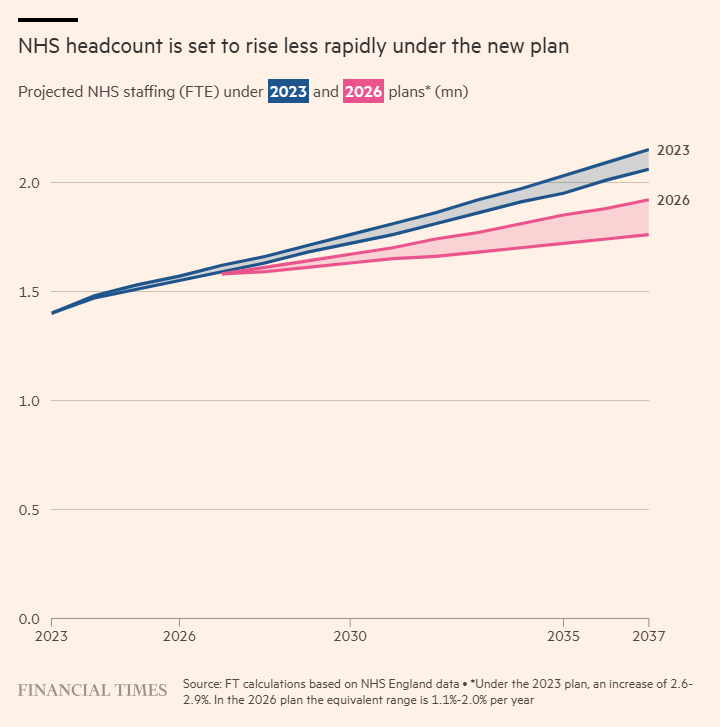
The FT reported this morning that the Government are looking at cutting back NHS recruitment in the upcoming workforce plan. This is a good idea.
The NHS keeps hiring more and more staff, but delivering much less with their workforce. Our 'Hospital of the future' research papers called for an approach which uses much more automation and shifts more secondary care into the community.
Between 2019 and 2023 hospital staff numbers grew significantly - consultants up by 15.8%, junior doctors by 24.6%, nurses up by 19.5% and support staff by 18.5%. In comparison, activity fell or stayed flat. Emergency admissions fell by 4.3%, and non-emergency admissions by 1.4%. Outpatient appointments grew by only 1.8%, and waiting list treatments grew by only 0.8%.
We are buying much more capacity, but getting little or nothing to show for it. The pattern is really stark in A&E - between 2010 and 2022 attendances grew by about 24%, but doctor numbers skyrocketed by over 80%.
It isn't sustainable to plan for an NHS workforce of up to 2.3 million people by the mid 2030s, employing 9 per cent of all workers in England. All other industries have to adapt and find ways to get productivity benefits over time, the NHS isn't different.
AI isn't the whole answer, but it will be part of it. Clinical roles aren't unique in terms of their complexity or the risk considerations, and human clinicians make plenty of errors and mistakes in their work as it is. But language models are consistently improving over time, whereas human clinicians aren't - at some point it's likely that whole bundles of tasks will be outsourceable to machine intelligence, which will be a good thing for patients, medical professionals and taxpayers alike.
@restate_thinks 'Hospital of the future' series is linked here, stats above are from the framing paper.
re-state.co.uk/publications/h…
English

@Montyburnout123 Yes, but one of my complaints about NHS data analysts is that they rarely present data to meetings *as if they mean it*. There's no purpose. No conviction. They're utterly detached from (even ignorant of) the organisation's objectives. So all we're left with is insipid head.
English

@kurtstat Things might work better if we based decisions on logic and data, not heart and gut
English
There’s a striking sentence at the bottom of page three of @mrianleslie’s book How to Disagree: “When we disagree, we bring the whole of our selves to the conversation: head, heart and gut.”
1/2
English
@Montyburnout123 OK, yes, good point. Hard to gate-crash a meeting you weren't invited to. Easier to get copied into an email or WhatsApp discussion thread.
English
@kurtstat Meetings are the best way to exclude people whose opinion you want to suppress. Asynchronous methods make this more difficult.
English
@Montyburnout123 Mind you, I do concede that asynchronous forums allow more time and space for more *considered* interventions and responses. The best ideas don't always come from those who are best at thinking on their feet.
English
@kurtstat Is the crapness perhaps an inherent property of NHS meetings?
Asynchronous methods of discussion are better in my opinion.
English
@Montyburnout123 That may well be the case. And indeed your description matches my experience of NHS meetings. But it's not a reason to give up on meetings. If meetings are crap, shouldn't we try to make them less crap?
English
@kurtstat In my experience NHS meetings are mostly about distributing future blame when something goes wrong. Decisions are made before meetings, disagreement is not allowed.
English
@jburnmurdoch Are we jumping too fast to 'fertility rate'? Isn't there an intermediate step? People (generally) have to be in long-term relationships before they have kids, so do we need to be clearer about why fewer people are entering into long-term relationships (if that is the case)?
English

@Montyburnout123 But if we're not meeting, we're not disagreeing. And if we're not disagreeing, we're not deepening our knowledge. (Though I concede that this view of the world assumes that meetings are appropriately convened and properly conducted!)
English
@kurtstat Productivity occurs in spite of meetings not because of them.
At least on Teams you can do some work at the same time as attending a meeting.
English
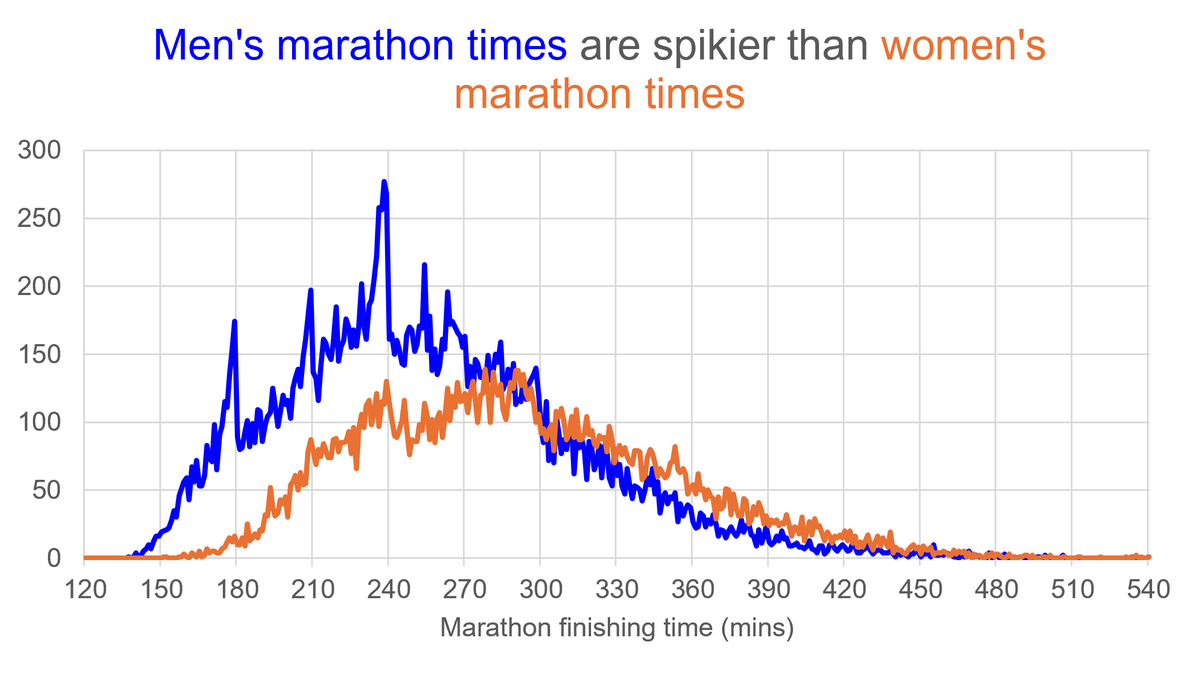
@drewhill79 I don't know. Maybe men are - in general - more motivated by target thresholds than women are? Your point about smart watches makes me want to see if I can find pre-smart watch era data to see if the spikes are less evident...
English

@kurtstat 🤣🤣🤣
I wonder what those actual spikes in the men’s graph are? Are we thinking this is more male runners looking at their smart watches and pushing themselves to get over the line at that timing? Or something else?
English
This happens to be a distribution of finishing times at the 2019 London Marathon, but I think it's a pattern we see in all marathons. The sudden spikes (at 02:59, 03:29 and 03:59, for example) are much more evident for men than for women.
English
@drewhill79 Ha ha! Yes! That thought (belatedly) occurred to me, too! (FWIW, the data I used for the graph was from the London_2019_mass_results.csv file. I didn't include data from London_2019_elite_results.csv!)
English
@kurtstat For any comparative work against modern datasets that X axis might need to start at 119 now 😬
English
Neil Pettinger retweetledi
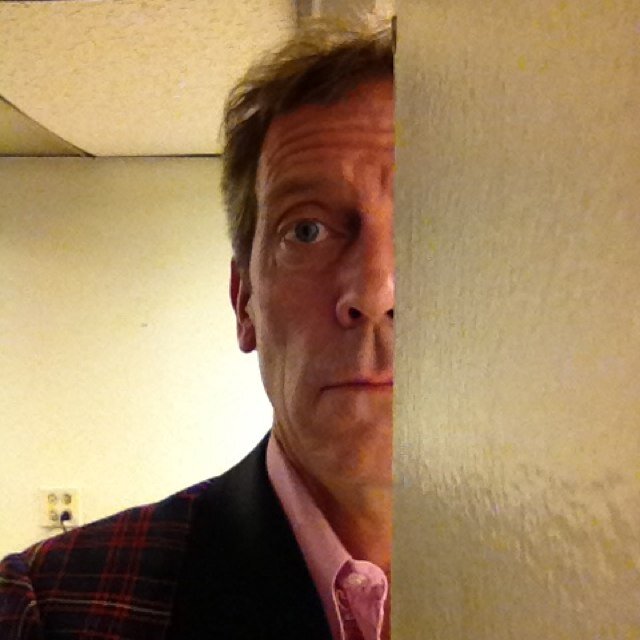
Well heck. The Arsenal. What an amazing achievement. BPM 150, dropping slowly.
English
Neil Pettinger retweetledi

Max Dowman is the first player born after ITV shut down Teletext to win the Premier League
English
@TJCoats Oh I like that idea. It fits with my general complaint that managers try to improve patient flow by focusing on individual patients rather than patients-as-a-whole.
English

@kurtstat If you want to increase the number of sub 3hr marathon runners you should definitely not try and get everyone to improve. You should concentrate on getting those between 3:00 and 3:10 to train a bit harder.
BUT is this the best way to create overall improvement?
English
I've rashly said I'll do a 10-minute talk on the topic of "Endurance" at a local storytelling event on Friday. I thought I'd use this pair of graphs as my theme (thanks to @TJCoats for planting the idea a few weeks ago!). Anyone got any good 'compare-and-contrast' suggestions?

English
