Kaustav Sen

423 posts

Kaustav Sen banner
Kaustav Sen

Kaustav Sen

@kustav_sen

actuary, interested in data science and visualizations #rstats

Katılım Aralık 2019
327 Takip Edilen497 Takipçiler
Kaustav Sen
Kaustav Sen@kustav_sen·
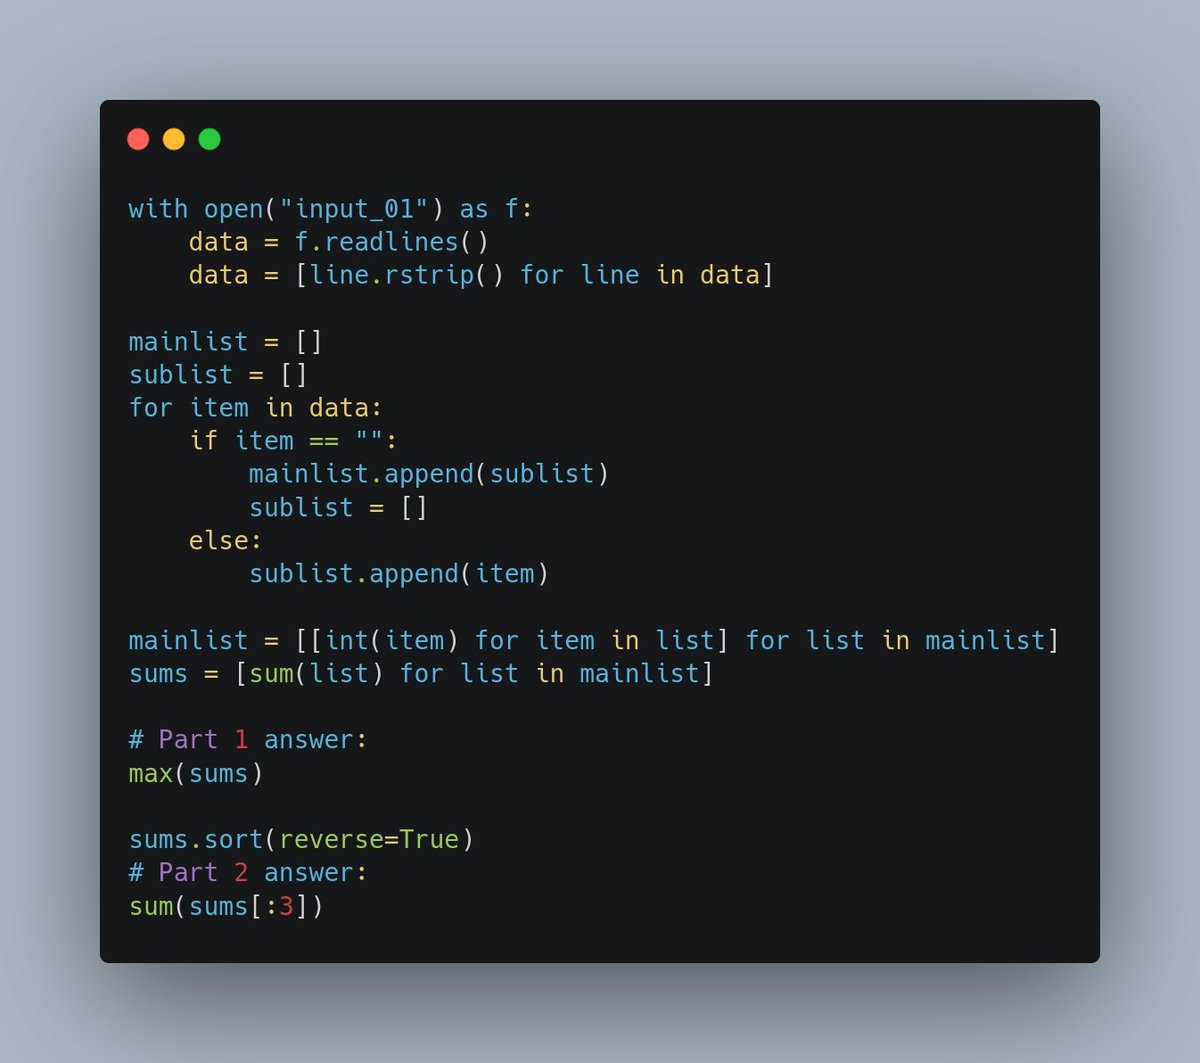
#AdventOfCode 2022 Day 9. Really struggled to code the logic for the "move" function but then realized can use the Euclidean distances to get the revised position for the tail! #Python
Kaustav Sen tweet media
English
0
1
2
0
Kaustav Sen
Kaustav Sen@kustav_sen·
@JulienMouchnino I think there is this "match" construct which seems to mimic case_when: #pep-634-structural-pattern-matching" target="_blank" rel="nofollow noopener">docs.python.org/3.10/whatsnew/… although I have never used it before and seems like it was only introduced in python 3.10
English
0
0
0
0
Kaustav Sen
Kaustav Sen@kustav_sen·
I just completed "No Space Left On Device" - Day 7 - Advent of Code 2022 #AdventOfCode Really struggled with this one but finally happy that I finally managed to complete it (albeit a little help from reddit 😊)
Kaustav Sen tweet media
English
0
0
3
0
Kaustav Sen
Kaustav Sen@kustav_sen·
Catching up on #AdventOfCode puzzles. Day 6 proved to be quite easy with python Counters.
Kaustav Sen tweet media
English
0
1
4
0
Kaustav Sen retweetledi
tess
tess@xsphi·
Proposed software term: a ladybug -- a glitch that clearly isn't a feature, but is harmless and sparks joy so it is allowed to stay
English
151
3.3K
30.9K
0
Tanya Shapiro
Tanya Shapiro@tanya_shapiro·
Brainstorming here 🤔💭 Maybe we start something like a recreateR series: how to reproduce well-known graphics (from news/media/online etc) with #RStats. Would love to join forces with more R friends if there’s enough interest!
English
29
5
272
0
Abiyu Giday
Abiyu Giday@abiyugiday·
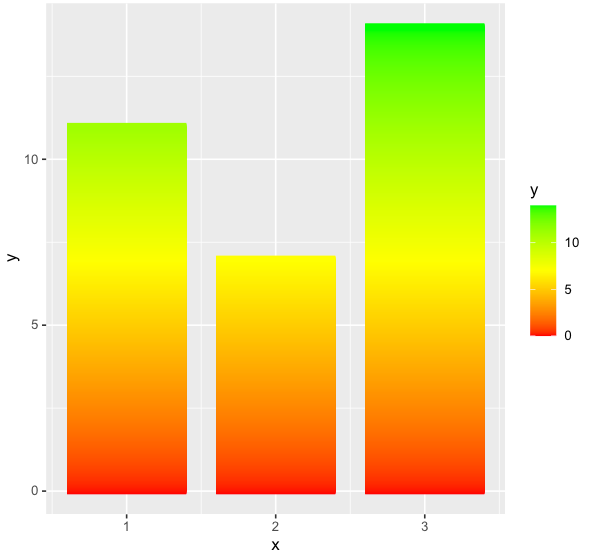
@kustav_sen @tanya_shapiro Good one! IYDK, for gradient fill, you can also use geom_segment(...) + scale_color_gradient2(...) To get something like this 👇
Abiyu Giday tweet media
English
1
1
3
0
Kaustav Sen
Kaustav Sen@kustav_sen·
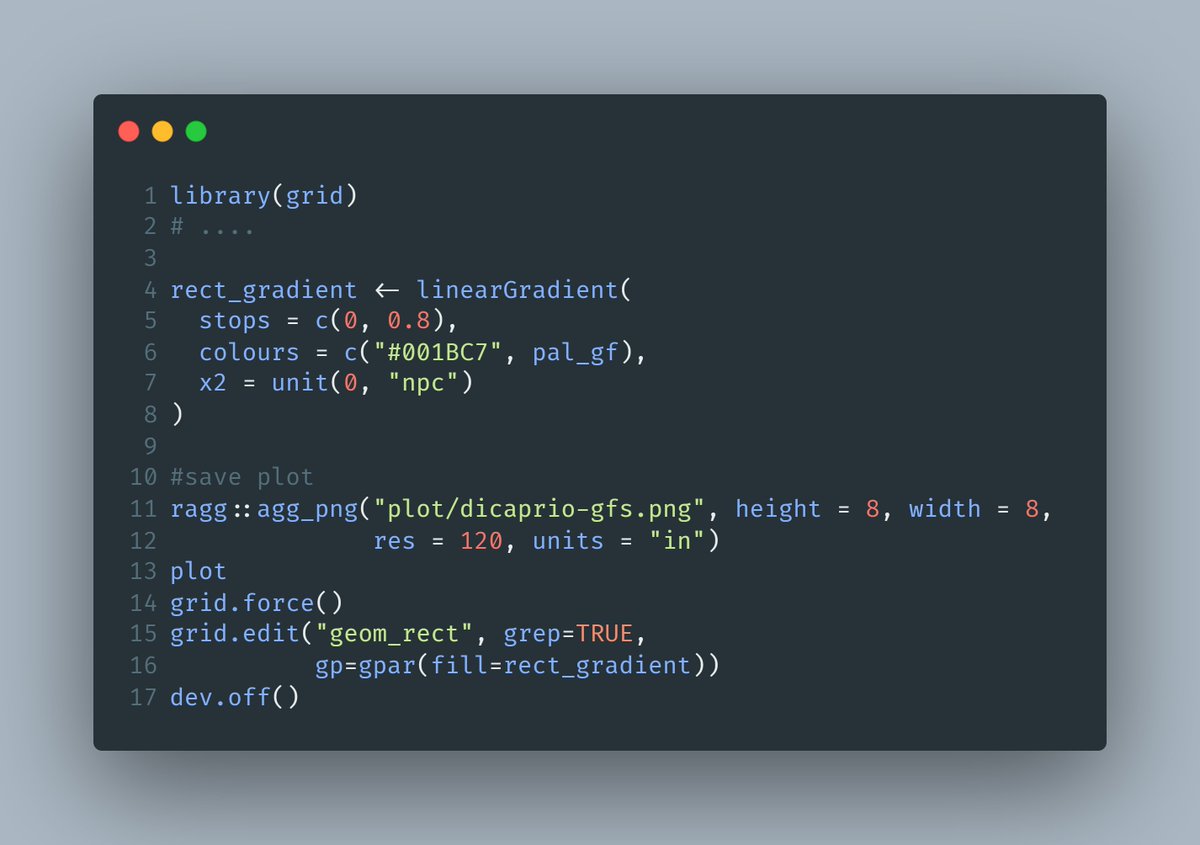
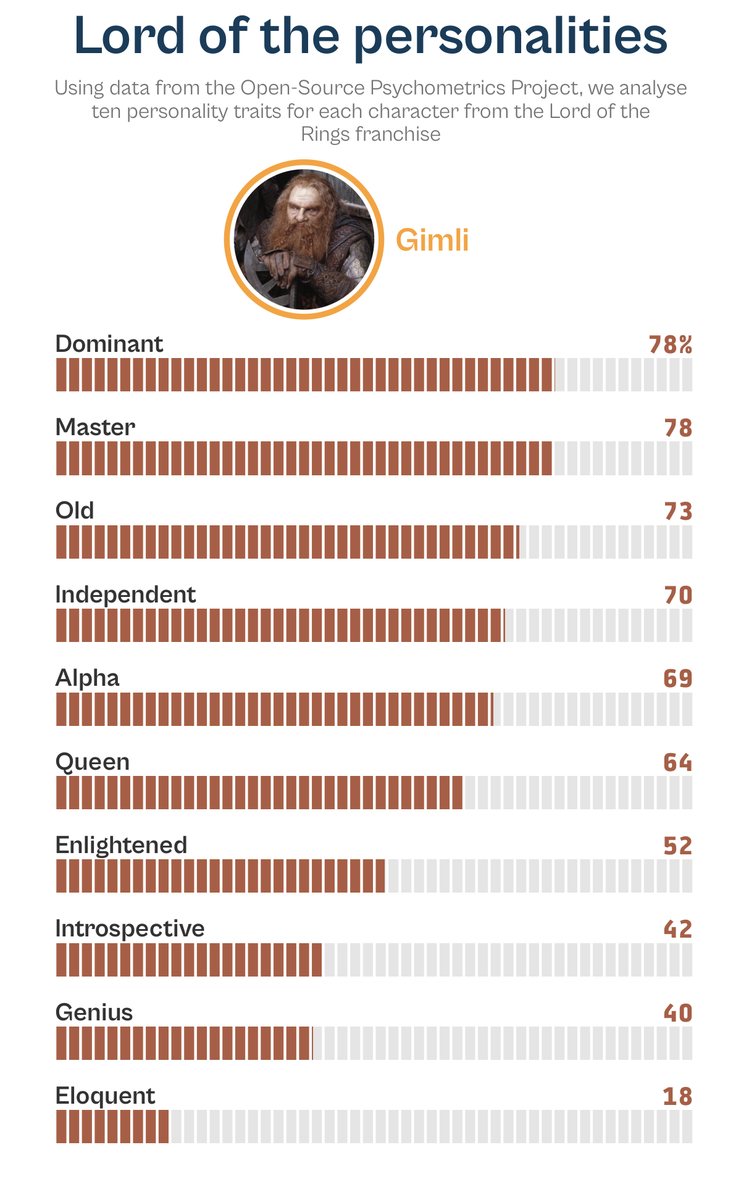
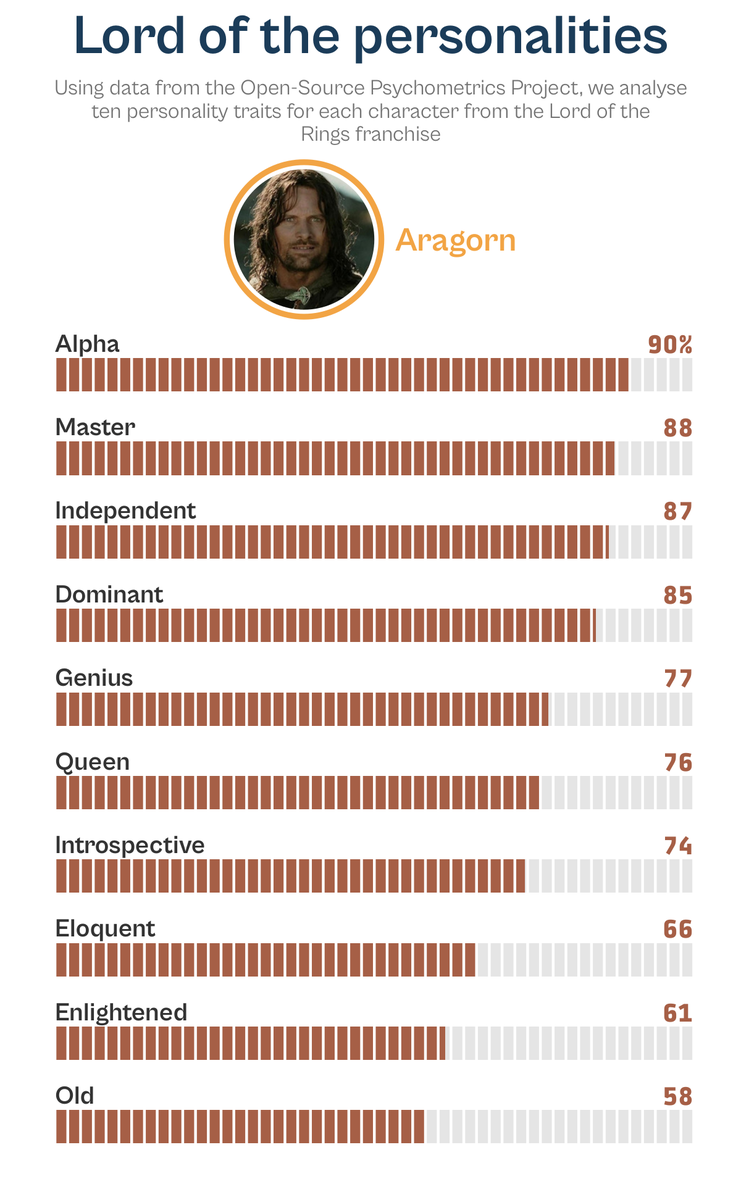
Fantastic recreation in R + ggplot2, @tanya_shapiro 👏👏💯 Had to figure out a way to add gradient to the bars - took a while but finally figured out 😅 In the end all I had to do was use geom_col() for the bars and add a linearGradient() from the {grid} package!
Kaustav Sen tweet mediaKaustav Sen tweet media
Tanya Shapiro@tanya_shapiro

Alright friends, as promised, here's the #RStats code on how to create the Leo chart with ggplot. Maybe it's worthy of a "how to" Quarto blog post in the future...Feel free to hit me up if you have questions! 😊 🔗Code: bit.ly/3wGnSz2

English
3
10
80
0
Tanya Shapiro
Tanya Shapiro@tanya_shapiro·
Maybe today is the day we take the plunge and learn something new... Think I'll start here with D3 in Depth. Expecting a steep learning curve - I'm new to JS. Welcome all resource recs from my data viz friends! d3indepth.com/introduction/
English
4
1
33
0
Kaustav Sen
Kaustav Sen@kustav_sen·
@_ansgar @nrennie35 @danoehm Thanks! First thought of using small rects but then went with using geom_vline() as that turned out to be easier and gave the same aesthetic effect I was going for 😅
English
0
0
2
0