

Lawson McWhorter
97 posts

Lawson McWhorter
@lawsonmcw
Lived through a few cycles and have the gray hairs to prove it. Not investment advice.
Wilton, CT Katılım Nisan 2009
31 Takip Edilen85 Takipçiler

@lawsonmcw @Chartfest1 Do you have the All securities isee for the 21st. I couldn't figure out how to find historical API. The link you gave was good as a daily , but I just didn't get that 21st all securities number. I track both . Thank you fur the equity number for that day.
English
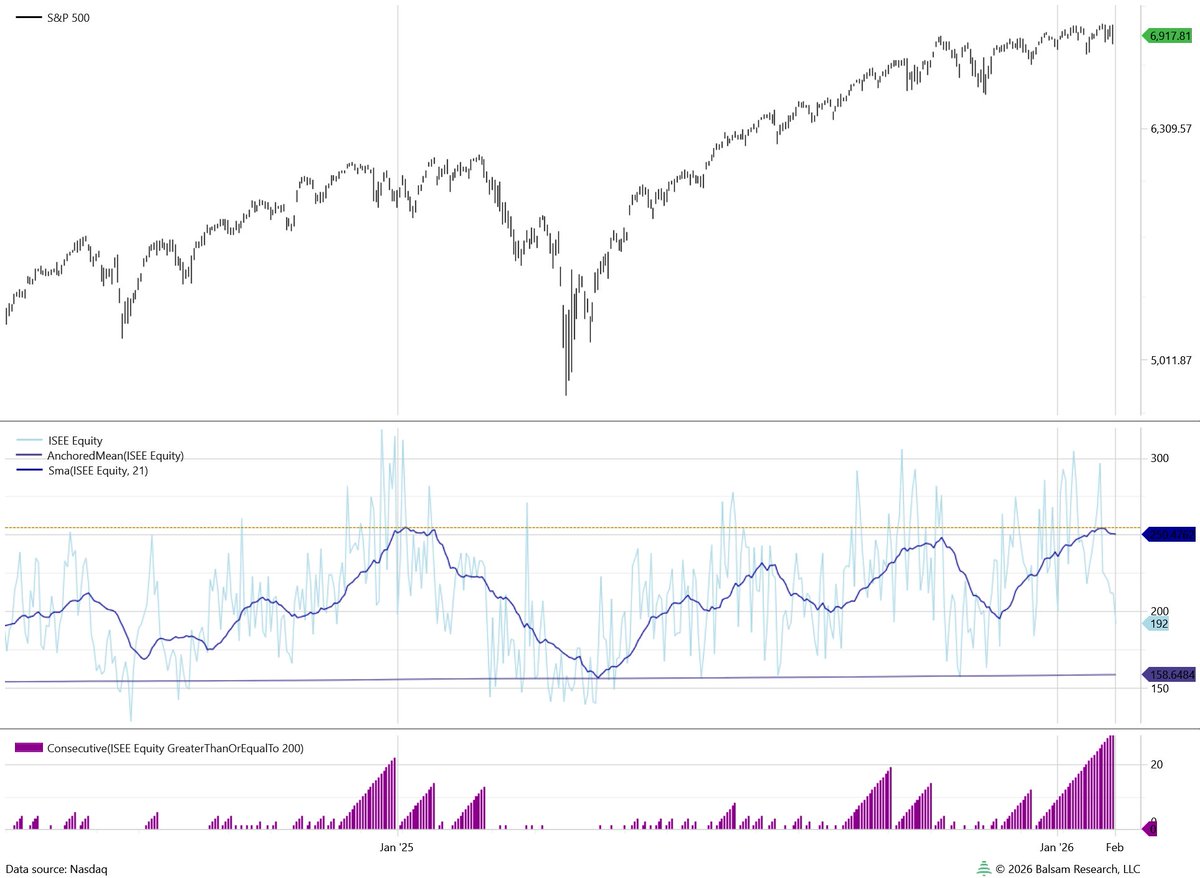
21 day moving avg of ISEE equity sentiment index just hit its highest level since inception over 20 years ago. Great time for Nasdaq to discontinue the series! @Chartfest1 It's still available via the API for the moment . . .

English
@Shepdog69138782 @lawsonmcw I got the may 20 th and may 22nd data . Do you have the isee numbers for the 21st? I track this as well. I'm needing the data for that day. Thanks for sharing the API
English

PSA
I contacted ISEE/Nasdaq to find out where they moved the ISEE data to. Will report back if/when I learn something.
Unless one of you knows and would like to share with me!
TYIA
English
@Chartfest1 Nor could I. I'm not inclined to pay for it. The API link will probably quit working at some point in the future. Not sure what Nasdaq is trying to do with their site. Do people really need yet another landing page with a chart of the Nasdaq?
English
@lawsonmcw thank you. that's what i am using for now.
but they tell me they have it and i can pay for it. i just could not find it when they gave me the URL.
English
@Chartfest1 The API endpoint that provided the underlying data in JSON format is still working for the moment: api.nasdaq.com/api/quote/isee…
English
@Chartfest1 Would love to know as well. I watch the equity-only value. It went out at 262 (sourced via API). That will make the 28th consecutive day closing > 200. Only one to go to match previous streak right at the highs in early Feb. Horizontal line marks current value of the 21 day SMA.

English
@lawsonmcw They changed the website midday. They did this once before and I think I had to call and find it. Let's see if anyone gets back to me.
English
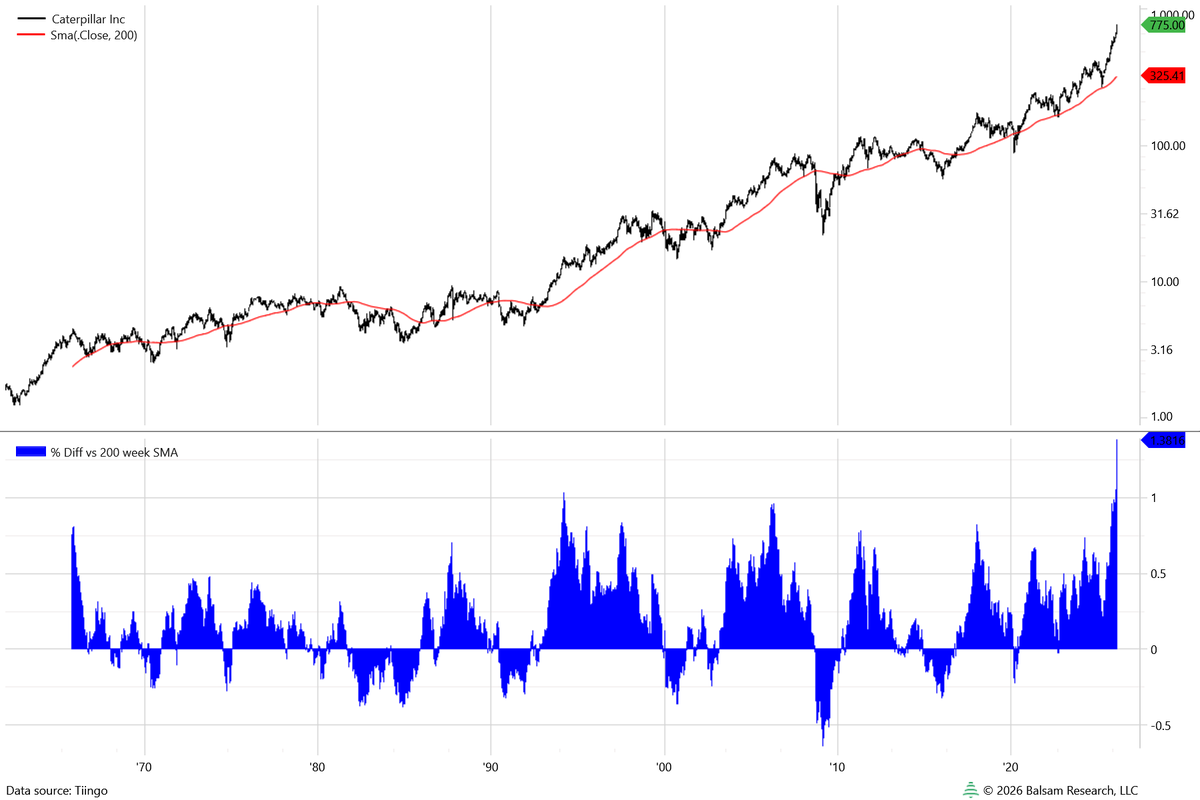
$CAT is 138% over its 200 week SMA, the most extreme stretch in over 60 years of data. Things are so extended it could get cut in half and still be above the average. CAT and Goldman combined are 21% of the price-weighted DJIA, so any reversal could have an outsized impact.
English
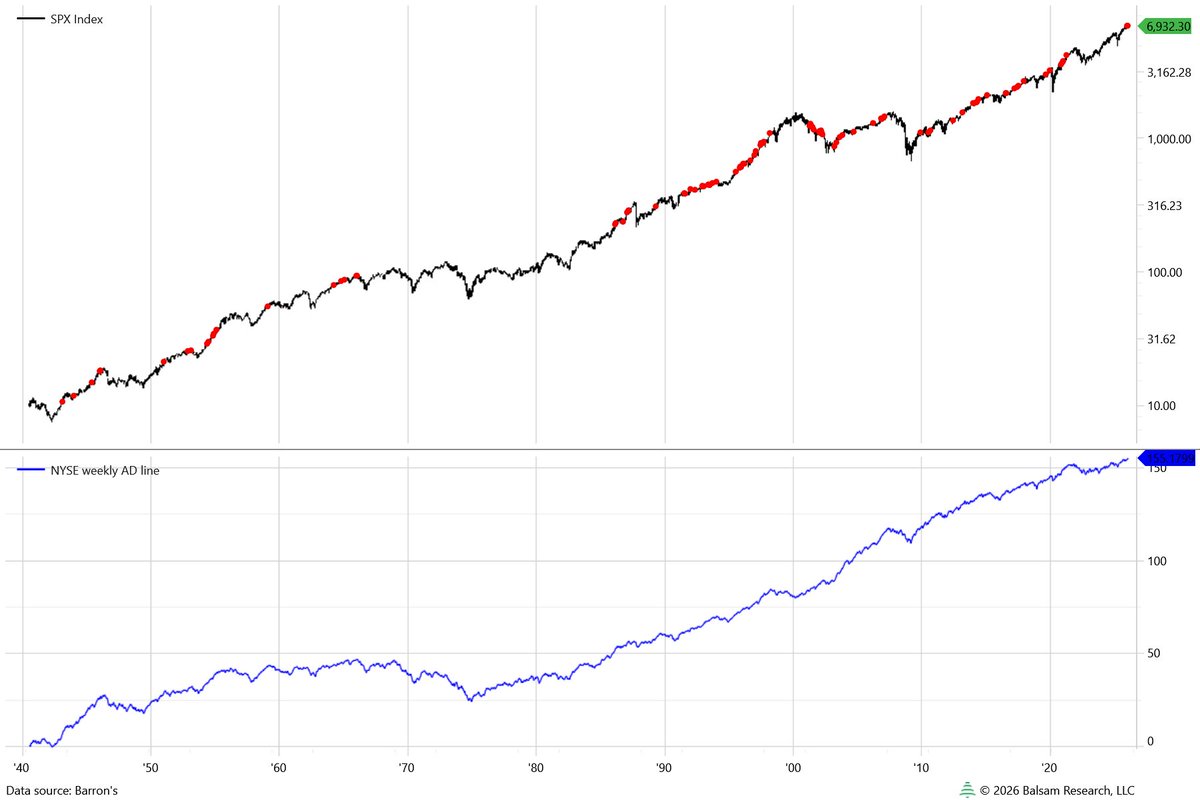
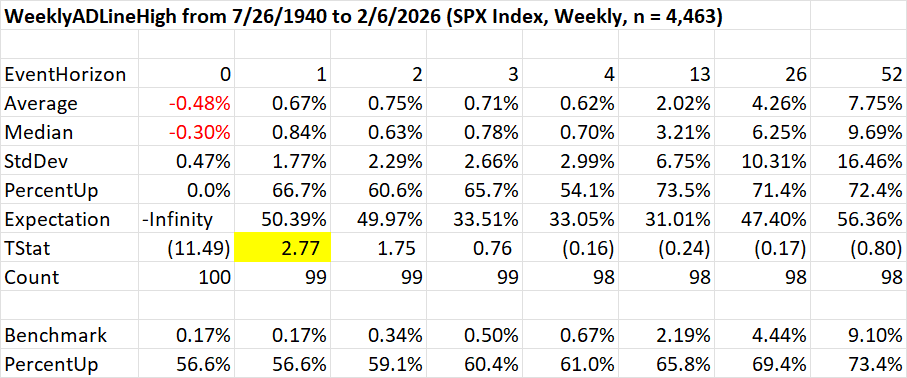
Weekly NYSE A/D line hit a record high despite the S&P closing down on the week. This setup has occurred 99 times prior in my data back to 1940 and has a decent upside bias for the following week.
English
@GunjanJS This is not unprecedented. Equal-weighted peaked a full year after cap weighted in 2000.
x.com/lawsonmcw/stat…
Lawson McWhorter@lawsonmcw
Interesting to watch the strength in RSP today. Back in the 2000 TMT bubble, the equal-weighted S&P peaked over a full year after the cap-weighted S&P. Still didn't prevent it from having a 40% drawdown in the end.
English

The S&P 500 equal-weighted index is **up** 0.05% this week, S&P 500 down 2%
English
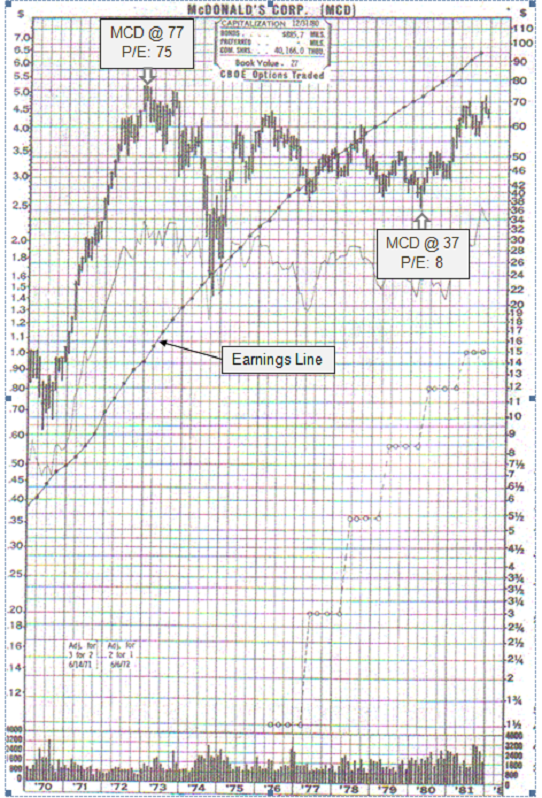
@WalterDeemer Even as earnings increased, MCD suffered a 72% drawdown that took 10 years to recover. And that's on a total-return basis. (shout out to Tiingo for excellent clean historical data). MCD had an even worse drawdown in '99-'03. Something about history rhyming comes to mind . . .
English

Interesting to watch the strength in RSP today. Back in the 2000 TMT bubble, the equal-weighted S&P peaked over a full year after the cap-weighted S&P. Still didn't prevent it from having a 40% drawdown in the end.

English
Today the ISEE call/put ratio broke its record streak of 29 consecutive days closing >= 200 (i.e. 2 opening calls traded for every put). The 21-day SMA recently hit a level only exceeded by a single day in Jan '25. At least by this measure, options traders are all-in.

English
@gfc4 Brings to mind the classic quote from War Games. "The only winning move is not to play." But of course, every trader feels compelled to play!
English

Disclosure: I did not trade $SLV (or silver futures) long or short. And I co-write the Market Wizard books but I don't claim to be a MW. That said...
I wonder how many people actually walked away with a profit considering everything they did (long or short) over the past few weeks.
If you were long and using a tight stop you almost certainly got chopped up a ton recently. If you had a wide stop, you're still long and hating it right now (although you might still be profitable depending how early you got in - but down 30% in one day sucks 🤮).
If you were short, you probably took a lot of small (or big) losses on the way up trying to find a top. And you had to maintain the resolve to keep trying all the breaks pressing hard. You also likely had to trade futures to maximize your win because a lot of the move came when SLV was not open (although it did trade a bit).
To win at this game requires a lot of skill, a lot of luck, or a bit of both. And it would definitely take an iron will.
I imagine Buffett and Munger would file this one in the "too hard" pile (assuming they did things like short futures on runaway commodity moves which they don't).
English
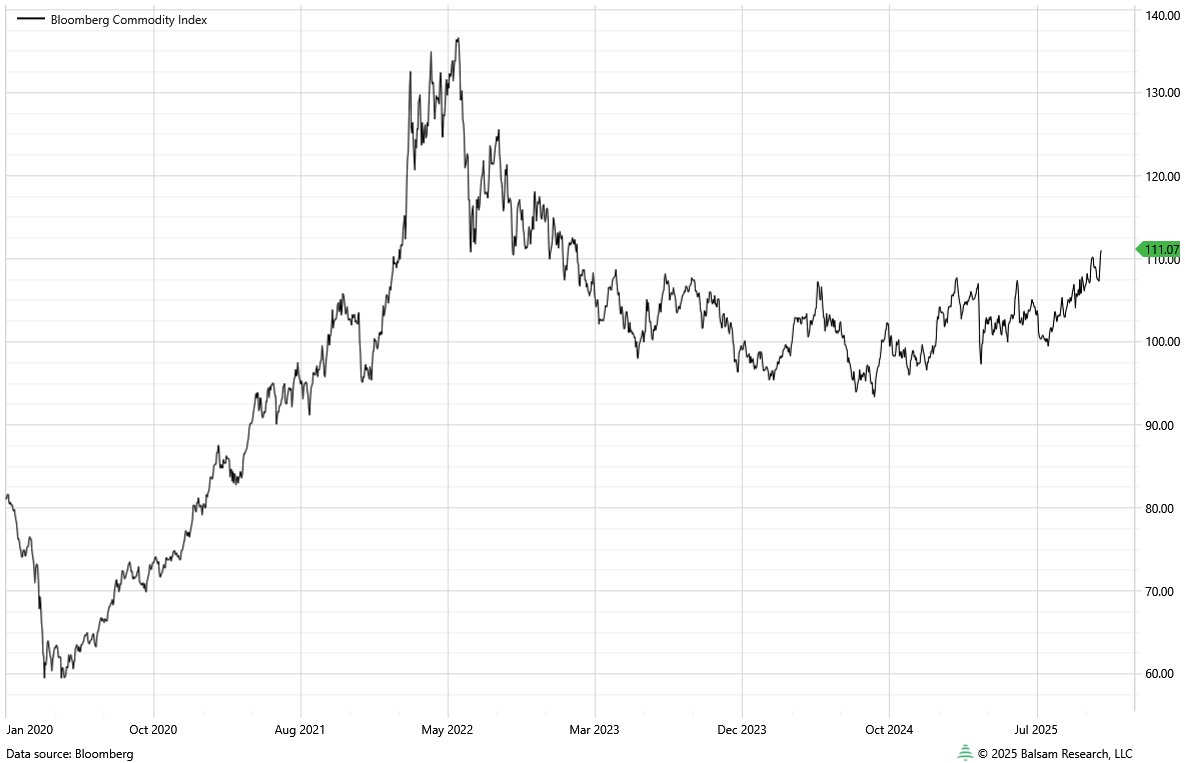
BCOM has hit the first of what seemed like a reasonable target given the massive base. Parabolic moves can be challenging. Market can pull back massively and yet have done nothing wrong from a long-term trend perspective. Not a bad spot to lighten up a tad if you're so inclined. Long-term, I think we're still in the early innings.

English
A classic retest of the breakout last month and now new highs in BCOM today. What percent allocation do you think most investors have to commodities . . . zero or close to?
English
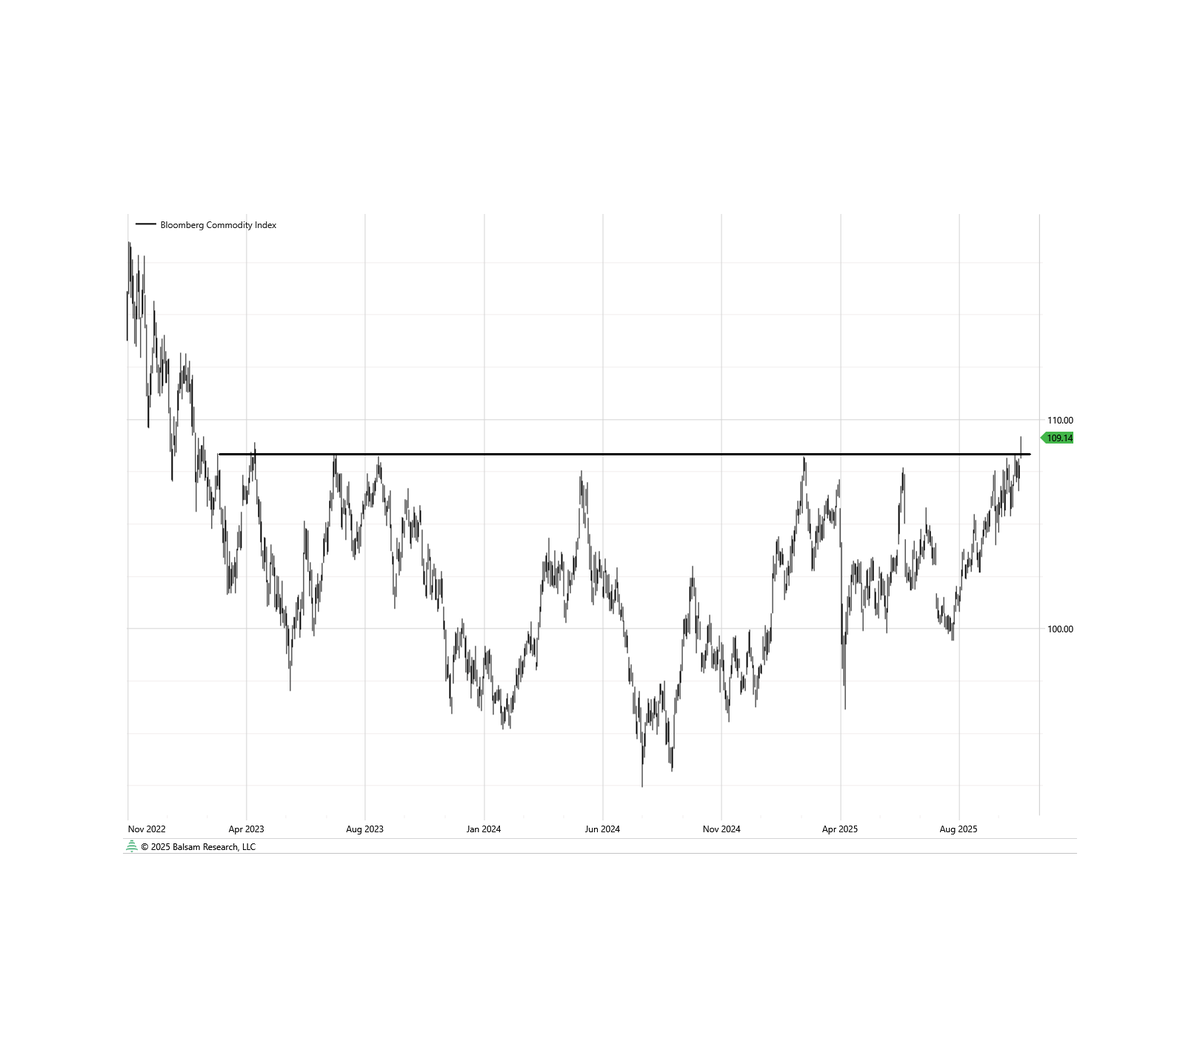
Don't look now, but the Bloomberg Commodity Index just broke out of a massive base making a new 2.75 year high. It's had a lot of head-fakes along with way, but today's move is pretty broad based. This should be good news for long-suffering CTA's.
English
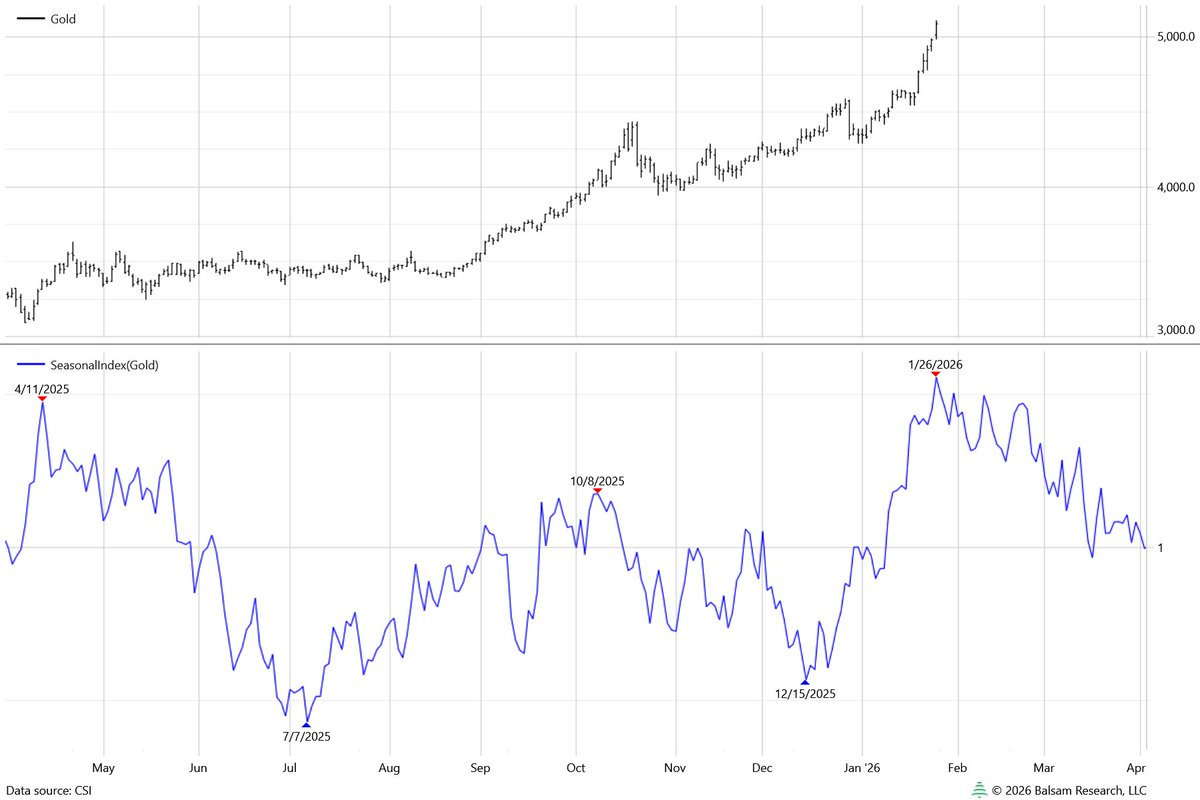
Today marked the high for my gold seasonal index based on the past ~40 years of gold futures data. This isn't to say it can't keep going, just that one of the tailwinds is no longer behind it. #GOLD $GLD
English
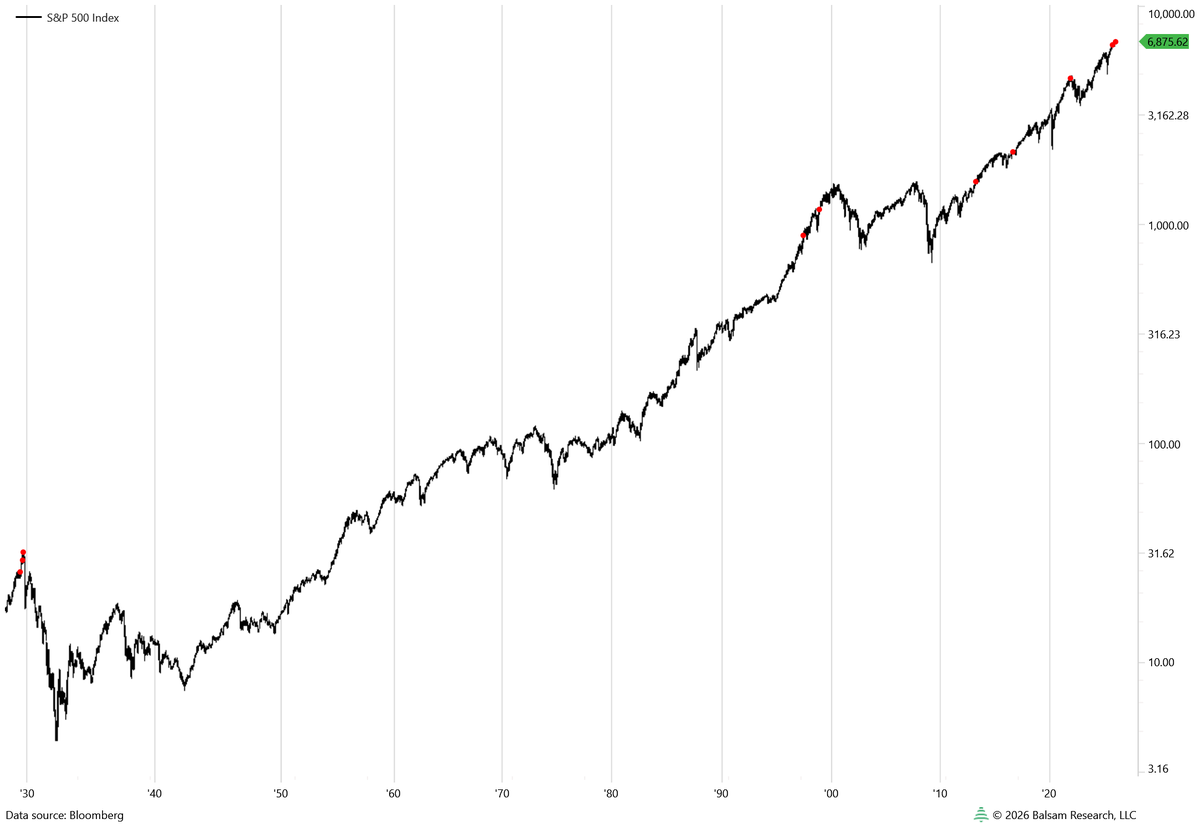
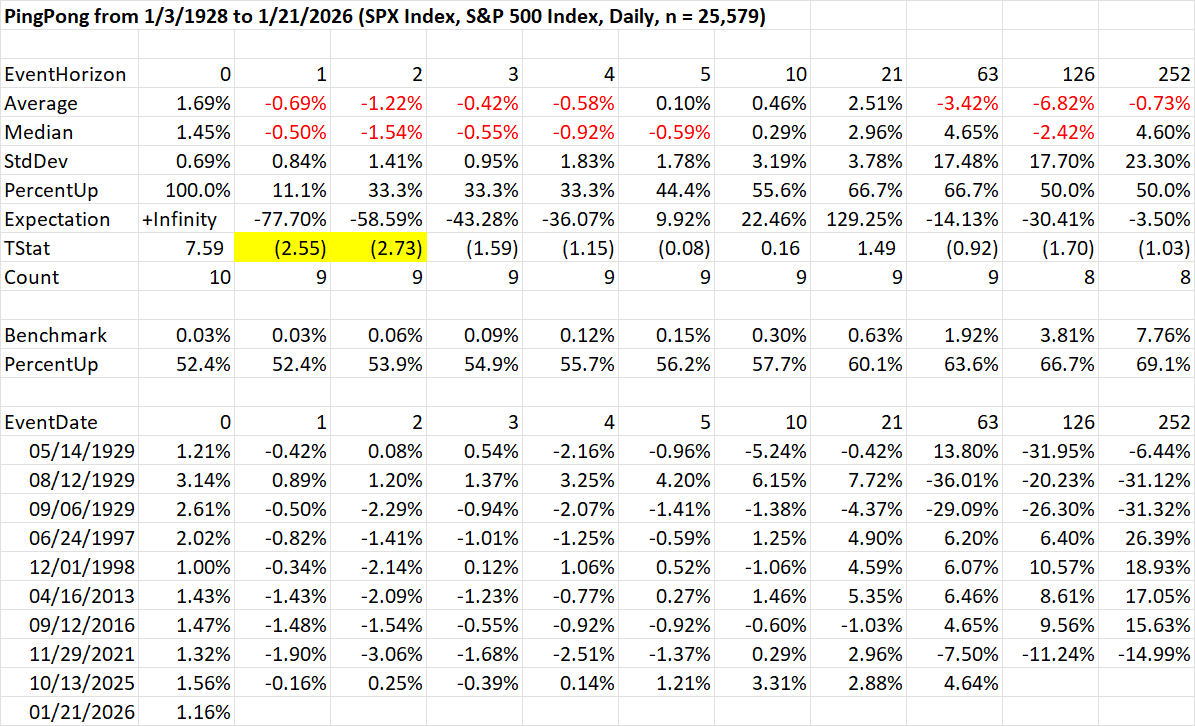
Down 2% days followed by up 1% days in the S&P are usually the kind of thing you see near bottoms, not within 2% of all-time highs. Since 1928, it's only happened 9 times prior to today. Batting average the next day is not good. Small sample size though, so more of a curiosity than anything.
English
High yield credit spreads as measured by the Bloomberg US Corporate High Yield OAS Index just hit a reading of 2.53. You have to go back to June 2007 to find lower readings. I'm sure it's nothing. 🙄 Party on Garth!

English
100%. JFK attacked the steel industry in 1962 and S&P sold off ~23% in about two months. In the past week, Trump has threatened RTX, XOM, credit card companies, institutional homebuyers and now the Fed. I suspect this will continue unless and until the market reacts like '62. But we seem to be a long way from that. Dip buyers are undeterred and emboldened after today.
English
They say pay attention to how stocks respond to good news and bad news. If Trump and Powell got into a public fight in a bear market, I imagine the stock market would be getting hammered.
English
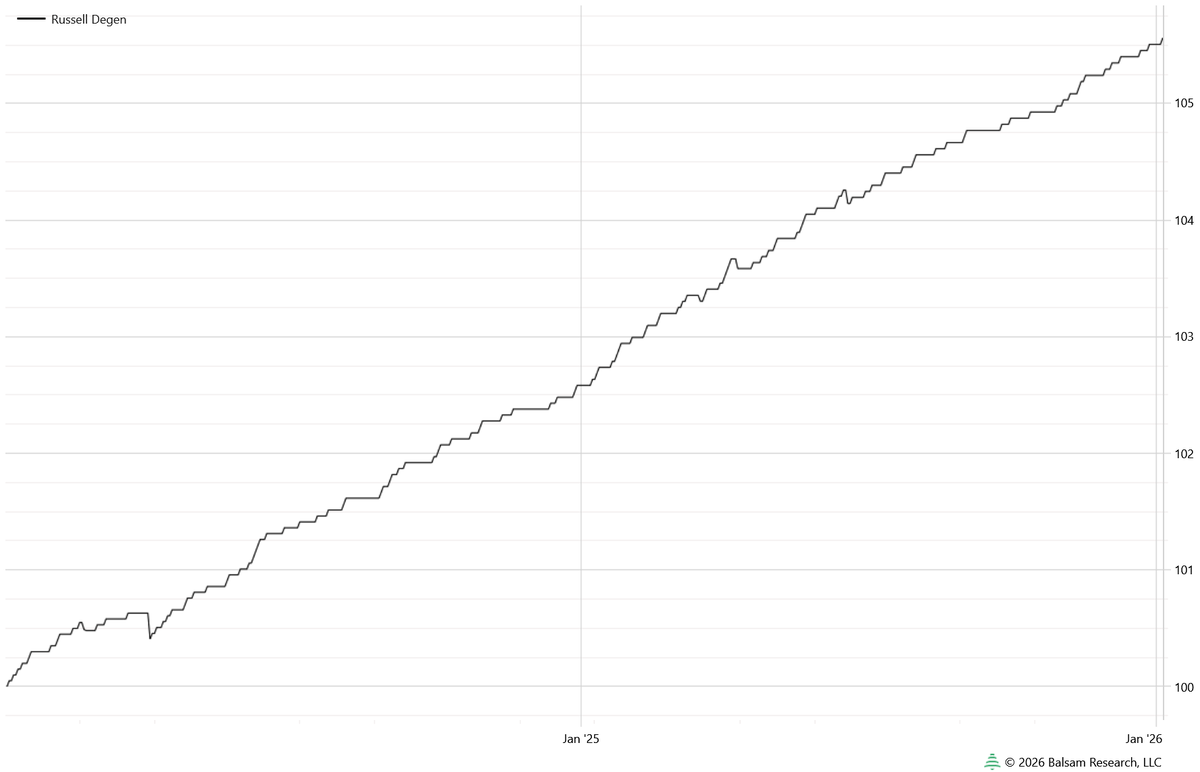
Wait for a dip versus the prior close, buy ~10 mins before the cash open and exit when it rallies a few points. You will go broke with a probability approaching 1 if you trade this long enough, but it's delivered a Sharpe of 6+ over the last two years, way longer than I would have guessed.
English
I've been amazed to watch the explosive moves in breadth right off the open recently, particularly on the occasional down opening. I was playing around with system ideas to take advantage of this recently. Behold the Russell Degen system:
English