
Lestherat
3.4K posts

Lestherat
@lestherat
Trading Bitcoin since 2014
San Francisco, CA Katılım Haziran 2009
1.9K Takip Edilen443 Takipçiler

Lamine Yamal eligió incitar contra Israel y fomentar el odio mientras nuestros soldados combaten a la organización terrorista Hamas, una organización que masacró, violó, quemó y asesinó a niños, mujeres y ancianos judíos el 7 de octubre.
Quien apoya este tipo de mensajes debe preguntarse: ¿considera esto humanitario? ¿Es esto moral?
Como Ministro de Defensa del Estado de Israel, no guardaré silencio frente a la incitación contra Israel y contra el pueblo judío.
Espero que un club grande y respetado como @FCBarcelona se desmarque de estas declaraciones y deje claro, de manera inequívoca, que no hay lugar para la incitación ni para el apoyo al terrorismo.
Español
@GitaGopinath Its bussiness meeting, no place for affected and traumatized egos, do you have a trillion company ?
English

A painting of the end of meritocracy: A meeting of the two largest economies and not one woman at the table.

English
@BitcoinPulseX All of you fake scam accounts with same shit charts, you will be left behind, buy now at 80k or buy later at 90k
English

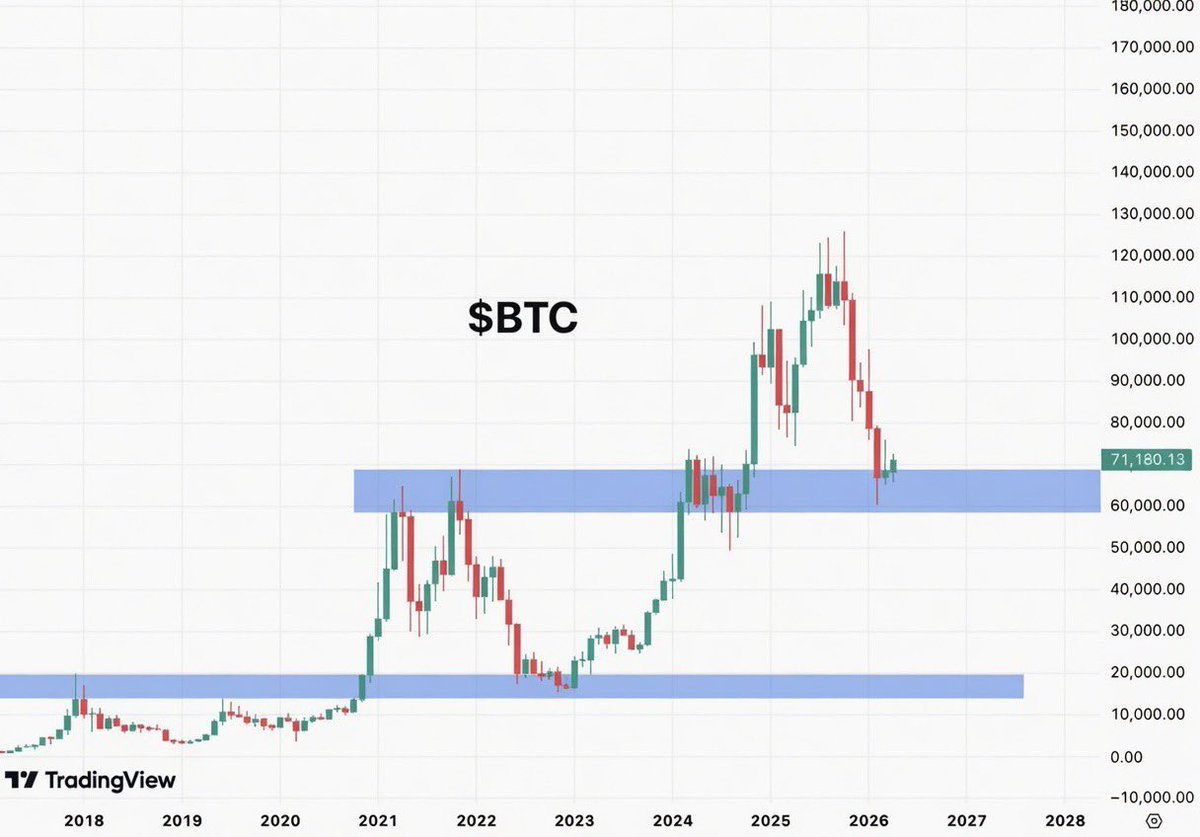
I stayed bullish from $16K all the way to $120K.
Closed everything at $120K and flipped short.
When Bitcoin was sitting at $120K, I called for $60K next.
At $60K, I said the rebound toward $79K–$85K was coming.
Now we’re here.
This $80K–$85K zone looks like the local top.
Next move? A brutal flush toward $50K and possibly even lower. 📉
Bitcoin PulseX@BitcoinPulseX
Bitcoin is flashing the exact same fractal pattern we’ve seen in every major bull trap before. If history repeats once again, $BTC could see a sharp move down toward $60,000 within days. Save this chart now — there’s a good chance everyone will be looking back at it next week.
English
@degargoyle Well Microstategy and Blackrock owns almost 10% of total supply, satoshi 5%, institutions and governments 10% and around 20% lost forever, so nop, we will never see that amount of volume again, most of the big trades are OTC
English

DON'T BUY $BTC UNTIL YOU SEE THIS
The real bottom always announces itself with massive volume. Always
We saw it in 2022-2023. The capitulation spike was unmistakable
Right now?
The volume box is empty - price is falling but nobody is truly panicking yet
That's the problem. The hardest flush always comes after retail thinks it's over
Wait for the spike. That's your signal
NOTIFS ON!
Gargoyle@degargoyle
$BTC IS RUNNING THE SAME 3-YEAR CLOCK SINCE 2018 And it's never missed a beat The structure is mechanical: - 365 days of bear - 1,065 days of bull - Higher peak each cycle 2018-2021: bottom $3k, peak $69k 2022-2025: bottom $15k, peak $126k We're now ~220 days into the bear phase of 2026-2029. Bottom prints around February 2027 After that, the next 1,065-day bull run begins This isn't a forecast. It's the same engine running for the third time NOTIFS ON!
English

$BTC RISING WEDGE!
Bitcoin could easily drop 20% from here.
Very dangerous.
English

The $BTC gap has not quite filled yet.
At first I though it filed but it turns out, on the lower timeframes, it's sitting at $83.9K
The fact that it's taking longer to fill this gap, tells me that once we do, then well be going lower.
I hope I am wrong. If so, it just means we enter lower!

English

Bitcoin is now perfectly mirroring this pattern.
After another bull trap and a relief rally, $BTC will dump to $41K.
History is repeating itself, everything going according to my plan:
$79K → $61K → $47K → $55K → $41K
Next stops:
→ $70K in days
→ $40K by June
I called the $126k top in October 2025 and $15k bottom in November 2022.
If you missed those calls, don't worry. I'll call the next one too.
Follow now. I'll update you as this dump plays out.
Kabuki🔴@kabukistory
Everyone celebrating Bitcoin at $80K right now No one's asking what happens at $82K $82K is a powerful psychological mark. Won't break that easy. Next stops: → $70K in days → $40K by June Bookmark this chart - you'll come back to it next week
English

$BTC just got brutally rejected at the $82K psychological ceiling.
This Bull Trap rejection can send Bitcoin straight back to $73K within days.
If the Right Shoulder fully confirms, then $BTC could retest the bottom and dump toward ~$30,000 by June.
Bookmark this chart - you’ll come back to it next week.
English
@Danny_Crypton Scam account claming same shit on other 30, dont trust in this scammer
English

Mark my words 2.0:
Two weeks ago, I predicted the $BTC hits into the $82K.
And now it’s time to say it again:
Everyone thinks Bitcoin is breaking out again.
In reality, Bitcoin has formed a Wyckoff accumulation pattern.
Traders see accumulation and think there is no danger.
That’s exactly how they get trapped.
Bitcoin has already completed the first major reaction after the local high near $82K.
That is the Relief Rally phase.
And historically, this stage is followed by downside.
But the setup is not that simple:
- Drop toward $60K (finished)
- Secondary Test formation (completed)
- Bounce back above $75K (done)
- Re-sweep of the lows (next)
- Cycle bottom formation (coming)
That’s how accumulation works.
It doesn’t reward people who chase every bounce.
It rewards people who understand the structure.
Most traders only think in one direction:
“BTC is pumping. Bottom is in.”
Wrong.
Real accumulation is messy.
It shakes out early buyers.
It traps breakout traders.
It forces people to sell the bottom twice.
That’s why my main focus is still the same:
A potential <$50K bottom.
Not because Bitcoin is dead.
Because this is where the real accumulation phase can finish.
For the record, I was the only one publicly calling the exact bottom at $16,000 three years ago and the top at $126,000 in October.
If you missed those calls, don’t worry. I’ll call the next one too.
Turn notifications on. If you’re not following yet, you’ll understand why that was a mistake later.
DANNY@Danny_Crypton
Mark my words: $BTC will fill the $82K CME gap. 100%. And when it happens… Over $10 BILLION in shorts will get liquidated. That’s the TRAP. Everyone will call it a breakout. Everyone will think the bull market is back. But bulls won’t like what comes next. This move is not the end. It’s the setup. For the record: I’ve studied macro for 10 years and called almost every major market top, including the October BTC ATH. Follow and turn notifications on. I’ll post the warning BEFORE it hits the headlines.
English
Lestherat retweetledi

A divorce is painful.
But you know what’s even worse?
Waiting 5 years for altseason just to get another -20% candle.
English
🇬🇧 Which of these stereotypes about British people is most true?
English


Lestherat retweetledi

78k-80k reached.
Bullish continuation soon, imo.
il Capo@CryptoCapo_
Potential quick pullback to 78k-80k, to shakeout late longs. Then bullish continuation to 85k-90k. Let's see.
English
@TedPillows It was already at 60k months ago, you should bought that time
English

Daily RSI uptrend lost.
MACD has flipped bearish.
Coinbase Bitcoin Premium is already negative.
IMO, $BTC drop to $60,000 this year is a matter of when, not if.

Kalshi Crypto@Kalshi_Crypto
BREAKING: Our traders forecast Bitcoin will crash to $60,000 this year
English
Lestherat retweetledi

Lestherat retweetledi

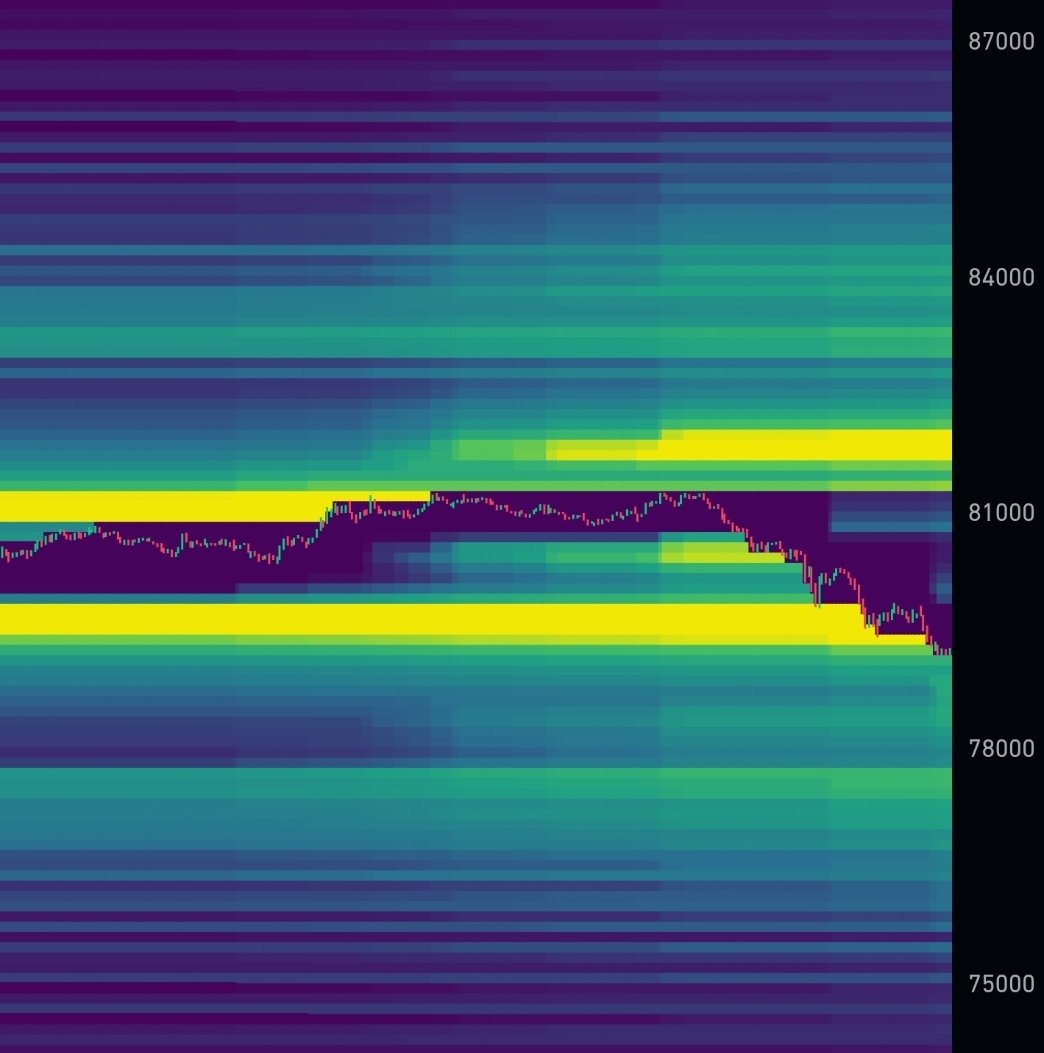
Insane dump.
$BTC just dumped from $81,200 to $79,500 within a few hours liquidating $175M longs!
That's now $2.28B liquidations in Crypto over the past week alone!!!
Now, $77,000 - $79,500 has sizable liquidity we could see fully swept next.
However, $81,000 - $85,000 has around 3x more liquidation clusters stacked up - making this the 'higher probability' zone to sweep next.
Bears just responded.
English
@AlexMasonCrypto Shut up scammer, i still remember all the shitcoins you shill past year
English

Everything is going according to the plan.
2018 → 2022 → 2026
Bitcoin cycle bottom will look exactly like this.
Remember, I was the only one publicly calling the exact bottom at $16,000 three years ago and the top at $126,000 in October.
If you missed those calls, don’t worry. I’ll call the next one too.
Turn notifications on. If you’re not following yet, you’ll understand why that was a mistake later.
Alex Mason 👁△@AlexMasonCrypto
🚨 READ THIS CAREFULLY Everyone thinks Bitcoin is breaking out. The chart says something completely different. Bitcoin is now forming a Wyckoff accumulation pattern. Most traders see accumulation and think the danger is over. That’s exactly how they get trapped. Bitcoin has already completed the first major reaction after the local high near $82.5K. That is the Relief Rally phase. And historically, this stage is followed by downside. But the setup is not that simple: - Drop toward $60K (finished) - Secondary Test formation (completed) - Bounce back above $75K (done) - Re-sweep of the lows (next) - Cycle bottom formation (coming) That’s how accumulation works. It doesn’t reward people who chase every bounce. It rewards people who understand the structure. Most traders only think in one direction: “BTC is pumping. Bottom is in.” Wrong. Real accumulation is messy. It shakes out early buyers. It traps breakout traders. It forces people to sell the bottom twice. That’s why my main focus is still the same: A potential <$50K bottom. Not because Bitcoin is dead. Because this is where the real accumulation phase can finish. For the record, I was the only one publicly calling the exact bottom at $16,000 three years ago and the top at $126,000 in October. If you missed those calls, don’t worry. I’ll call the next one too. Turn notifications on. If you’re not following yet, you’ll understand why that was a mistake later.
English
Lestherat retweetledi

恐怖!用家Wi-Fi就能知道隔壁墙后的人在干什么!
开源项目 RuView 在GitHub已经冲到 5万+星,直接炸了!
完全不用摄像头,也不用戴任何设备,就靠家里普通的WiFi信号,就能穿墙透视:
- 隔壁有几个人、在哪个位置、是走路还是躺着,全看得见
- 实时看人体姿态(17个关键点)
- 睡觉时自动测呼吸和心率
- 有人跌倒立刻报警,动作识别超准
用WiFi CSI + AI,把你家路由器直接变成隐形雷达!
没有视频、没有录像,隐私安全拉满,天然符合GDPR,完全本地跑,不上云。
ESP32几块钱就能玩,Docker零硬件也能直接试。
中文