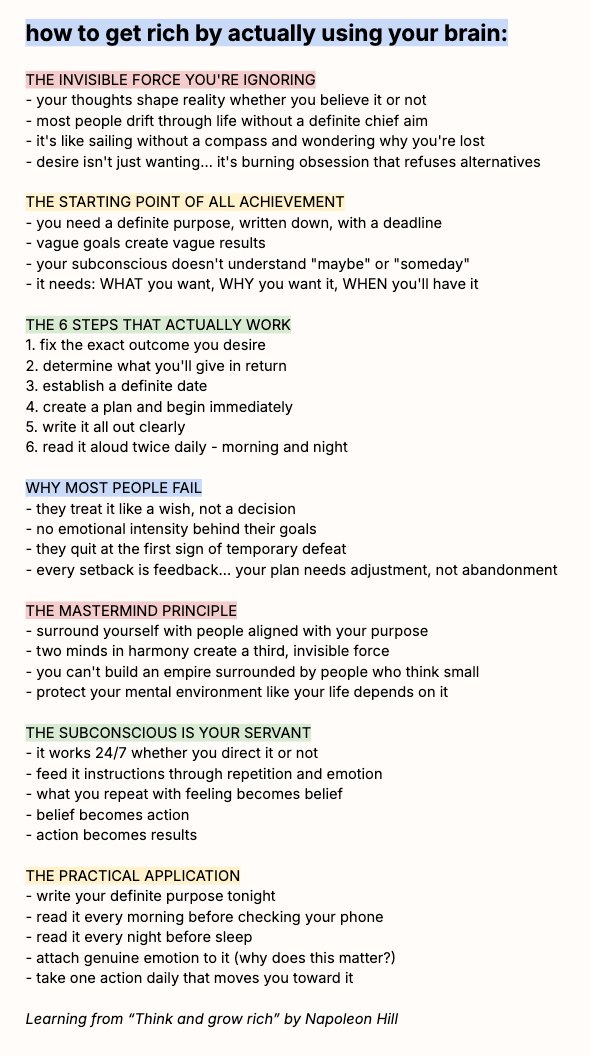
liquidationemails

911 posts

liquidationemails banner
liquidationemails

liquidationemails

@leverageonly

Katılım Ekim 2024
217 Takip Edilen129 Takipçiler
Pepe Invests
Pepe Invests@pepemoonboy·
When I ran the numbers on renting and investing the difference vs. buying a home, I used national averages and y'all lost your minds. Fair enough. This time I used two real listings in Durham, NC with matching bedrooms and comparable square footage. Apples to apples. The properties: - For sale: 305 Reynolds Ave — $389,000 / 3bd 2ba / 1,580 sqft - For rent: 1526 Smoky Mountains St — $1,950/mo / 3bd 2.5ba / 1,658 sqft The setup: - Mortgage rate: 6.50% (30yr fixed, 10% down) - Durham combined property tax rate: 0.99% - Home insurance: $1,721/yr (avg for 27707 zip) Buyer monthly cost (Year 1): - P&I: $2,213 - Property tax: $321 - Insurance: $143 - Maintenance (1%): $324 - PMI: $146 Total: $3,148/mo Renter monthly cost (Year 1): - Rent: $1,950 - Renters insurance: $14 Total: $1,964/mo The renter saves $1,184/mo. Plus the $50,570 in down payment and closing costs never leaves their pocket. All of it goes into $VOO. This time I'm accounting for what everyone said I missed: Assumptions: - Rent increases 3.5%/yr (it is NOT frozen) - Property tax increases 2%/yr - Home insurance increases 3%/yr - Home appreciates 3.4%/yr (avg since 1891) - S&P 500 returns 10%/yr (long-term avg) - PMI drops once equity hits 20% - Selling costs: 6% (agent commissions + transfer taxes) - Capital gains tax: 15% on stocks - Home sale exclusion: $500K (married couple) All results are AFTER taxes and selling costs Results: 1. After 10 years: - Renter net (after cap gains tax): $299K - Buyer net (after selling costs): $214K Renter wins by $85K 2. After 20 years: - Renter net: $815K - Buyer net: $519K Renter wins by $296K 3. After 30 years: - Renter net: $2.16M - Buyer net: $971K Renter wins by $1.19M "But rent will be $5,473/mo in 30 years." Yes. And the renter's portfolio generates $18K/mo at a 10% return. Even at a conservative 4% withdrawal rate, that's $7,200/mo. You can pay rent and still never touch the principal. What this still doesn't capture: - HELOC access / borrowing against equity - Refinancing if rates drop - Forced savings effect (most renters won't invest the difference) - Intangible value of ownership, stability, no landlord - HOA fees (if applicable) - Major repairs beyond 1% (roof, HVAC, plumbing) - Geographic differences: these numbers are Durham, NC. Your market will be different. A home is a place to live. It can also be a great financial decision depending on your market, discipline, and goals. But the "renting is throwing money away" crowd needs to run the numbers before they say that. Not financial advice. Run your own numbers.
Pepe Invests tweet mediaPepe Invests tweet media
Pepe Invests@pepemoonboy

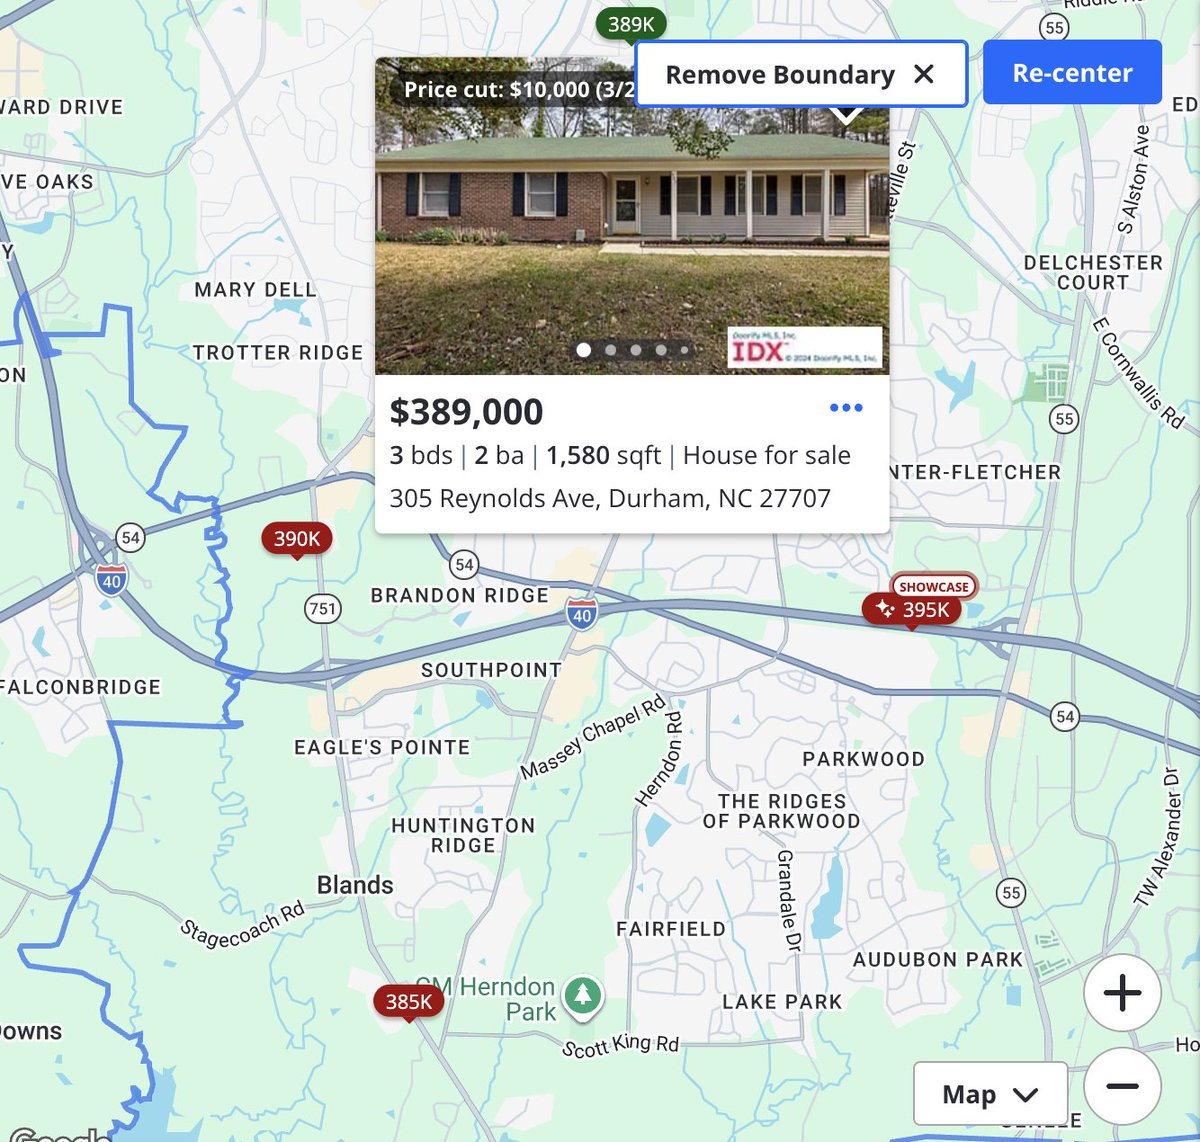
I ran the numbers on renting and investing the difference vs. buying a home... The results are shocking. The setup: - Median U.S. home sale price: $398,000 (NAR, 2026) - Average U.S. rent: $2,000/mo (Zillow, 2026) - Mortgage rate: 6.51% (30yr fixed, 10% down) All in monthly cost of owning that home: - P&I: $2,266 - Property tax: $332 - Insurance: $215 - Maintenance: $332 - PMI: $149 - Total: $3,294/mo Renting cost: - Rent: $2,000 - Renters insurance: $14 - Total: $2,014/mo The renter saves $1,280/mo. Plus the $51,740 in down payment and closing costs never leaves their pocket. All of it goes into $VOO. Using the long term S&P 500 avg return of 10% and home appreciation of 3.4%/yr (the avg since 1891): After 10 years: - Renter portfolio: $334K - Home equity (net of selling costs): $219K - Renter wins by $115K After 20 years: - Renter portfolio: $927K - Home equity: $531K - Renter wins by $397K After 30 years: - Renter portfolio: $2.41M - Home equity: $1.02M - Renter wins by $1.39M Even if you give the home 5% annual appreciation, the renter still wins at every single checkpoint. At $VOO's actual historical return of 13.99%, the renter's portfolio hits $6.38M after 30 years. The home equity is still $1.02M. The part nobody talks about: after 30 years your rent is $5,614/mo. Sounds scary. But your portfolio is generating $20K+/mo at a 10% return. You could pay that rent 3x over and never touch the principal. A home is a place to live. $VOO and the stock market is a wealth building machine. Not financial advice. There are lots of variables I may be missing. Run your own numbers.

English
137
93
1.1K
346.2K
liquidationemails retweetledi
Popeye
Popeye@SailorManCrypto·
How I Read a Chart in 60 Seconds. Most traders open a chart and immediately start drawing lines. Trendlines, fibs, indicators stacked on indicators. No structure. No process. Just visual noise. This educational post is sponsored by @_WOO_X, where I trade crypto with zero fees on spot. I have been doing this for years. When I open a chart cold — no context, no bias, nothing — I know what I'm looking at within 60 seconds. Not because I'm fast. Because I follow the same 5 steps every single time. Here they are. STEP 1 — HTF Structure First (Weekly / Daily) Before anything else, I zoom out. Weekly or Daily chart. Clean. No indicators yet. I'm asking one question: what is the trend? Higher highs and higher lows? Bullish structure. Lower highs and lower lows? Bearish structure. Neither? Then we're in a range — and that changes everything. If it's trending, I want to know where we are in that trend. Are we near a key support? Pushing into resistance? Mid-leg with no reference points? If it's ranging, I define the boundaries first. Where is the range high? Where is the range low? Because in a range, the strategy flips completely — you're not chasing breakouts, you're fading extremes and waiting for deviation. This step takes 10 seconds. And it eliminates 80% of bad trades before they start. STEP 2 — Key Levels + Liquidity Now I mark levels. But here's the rule: 2 or 3 levels maximum. Not 15. I want the levels where price has reacted multiple times. The ones that are obvious. If you have to squint to see whether it's a level — it's not a level. Then I look at liquidity. Where are the equal highs? Where are the equal lows? Where are the stop clusters likely sitting? Liquidity is the fuel. Price needs it to move. If there's a pool of liquidity sitting above a range high, I know price is likely going to hunt it before reversing. If there are clean equal lows below support, the market will sweep them. This is not about drawing every level you can find. It's about identifying the 2-3 zones where the real action will happen — and understanding where the liquidity traps are. STEP 3 — Market Phase Now I identify the phase. Every market is always in one of four phases: 1. Accumulation — price is basing after a downtrend. Low volatility, tight range, smart money is loading. 2. Markup — the trend begins. Higher highs, higher lows. This is where most of the easy money is made. 3. Distribution — price is topping after an uptrend. Same low volatility and tightness as accumulation, but at the top. 4. Markdown — the downtrend. Lower highs, lower lows. Exits and shorts. Why does this matter? Because the phase tells you what kind of trade to look for. In accumulation, you're looking for breakout entries. In markup, you're riding the trend on pullbacks. In distribution, you're tightening stops and watching for structure breaks. In markdown, you're either short or on the sideline. If you don't know the phase, you don't know what you're trading. You're just reacting. STEP 4 — LTF Confirmation (4H / 1H) Only now do I zoom in. 4-hour or 1-hour chart. I'm looking for three things: Does the lower timeframe structure agree with my HTF bias? If I'm bullish on the daily, I want to see bullish structure forming on the 4H. Moving averages — are they aligned with my bias? If price is above the 200 EMA/MA on the 4H and both are sloping up, that confirms the bullish read. If they're flat or crossing down while I'm trying to go long, something doesn't fit. RSI — I'm not trading RSI signals. I'm checking for divergence. If price is making a new high on the daily but RSI on the 4H is making a lower high, that's a warning. If price is pushing up and RSI confirms, that's clean. Here's the most important rule of this step: if the LTF disagrees with the HTF, there is no trade. I don't force it. I don't talk myself into it. I wait. The next setup is always around the corner. STEP 5 — Bias in One Sentence After those four steps — 60 seconds total — I should be able to say one sentence: "I'm bullish above X, bearish below Y, and right now price is doing Z." That's it. That's the whole read. If I can say that sentence clearly, I have a bias. I have a framework. I have a plan. Now I can look for entries. If I can't say that sentence — if it feels forced, if I'm unsure, if the data conflicts — then I don't have a read. And that's fine. I close the chart and move to the next one. There are hundreds of charts. Not every one needs to be traded. The discipline to say "I don't have a read" is worth more than any setup. What NOT to Do. Don't start on the 5-minute chart. Ever. The 5-minute chart without context is pure noise. It will give you a bias that contradicts the higher timeframe and you'll lose money following it. Don't draw 15 levels and call it "analysis." If your chart looks like a colouring book, you have too many lines. You don't need more levels — you need fewer, better ones. Don't force a bias because you want a trade. Wanting to trade is not a reason to trade. If the chart doesn't speak to you in 60 seconds, it has nothing to say right now. Don't skip HTF because "it looks good on the 1H." The 1H can look perfect and still be sitting right under daily resistance with bearish divergence on the weekly. Context kills bad trades before they happen. Don't make it complicated. Five steps. Same order. Every chart. Every time. The process is the edge. It's not the indicator. It's not the pattern. It's not the setup. It's the process you follow before you even consider clicking buy or sell. Same steps. Every chart. Every time. No shortcuts. Trade spot with zero fees on WOO X Pro: wooxpro.com/en-US/invite/P…
Popeye tweet media
English
24
34
266
23.6K
liquidationemails retweetledi
Felipe Guirao
Felipe Guirao@FelipeGuirao·
After many requests, here is a full breakdown of my stock swing trading strategy I used to: • Average triple-digit % returns for the past 7 years, • With minimal drawdown of -13%, • Entering EOD (do everything in <30min/day) Here is the process in 5 steps: (This is a long one, bookmark for future reference) --- Step 1: --> The first thing to trade momentum breakouts is to find stocks that made a new, fresh leg higher and established a new trend. You will see the 8/20/50 EMAs all stacked and trending, indicating strong momentum in the stock (big money supporting it). It's very important that it's the first leg and fresh, stocks that already had consolidations and are trading in their 3rd and 4th legs of the intermediate trend have a lower chance of having a successful, multi-day breakout. --- Step 2: --> I want my CML indicator (custom momentum & linearity indicator) flashing GREEN. I developed this to scan and filter stocks with the right amount of momentum and linearity. If not, you will be trading stocks that are choppy at the moment, and data shows the probability of your stops being taken out is high. --- Step 3: --> Look for the first valid volatility contraction pattern, riding the 8/20 EMAs layer. This is the step before the breakout, and you want to see the volatility contract, with the top and bottom trendlines converging together. This shows that in the case below, sellers are being absorbed, and buyers are about to break through the least amount of resistance, taking prices to major levels quickly. That's the foundational principle of the volatility contraction/expansion cycle, and we want to find these stocks about to make the expansion leg in the direction of the established momentum (or uptrend). --- Step 4: --> Now look for the breakout candle, breaking through resistance, and having a nice close. This should be stronger than the preceding candles, and I don't want to buy after 2-3 big green candles in a row. If there are 1-3 tight candles before, the better. --- Step 5: --> After the breakout, I ride the swing for 5 days, regardless of what happens. I place my stop below the LOD, move to break even around the 1:1 RR mark, and close at the end of the 5th day. We look for an asymmetric move and look for a positive risk-to-reward relationship. It's all about positive expectancy! --- I developed this strategy after studying 6000 stocks for 3 decades, through all market conditions. I go long and short, so also profit in bear markets as well (did +60% in 2022 with <10% max DD). I enter at the end of the day, in the last 20 minutes of the trading day. This allowed me to have a life as well during the day. No need to be glued to your charts all day, or not even during the first hour, looking for entries. If you study and develop your edge, you will make it in this business. If you want to go deeper into my process, the software I use, and how I scan for them using TC2000 and TradingView, make sure to watch the 2.5-hour video series in my pinned post in my profile. Go and make it happen 📈
Felipe Guirao tweet media
English
17
84
506
38K
liquidationemails retweetledi
Sean trades
Sean trades@SRxTrades·
in 2026, challenge yourself: -Take only a few trades per week -Build good habits -Focus on the process and not the result Come back to this tweet next year and watch how much better your performance will be.
English
19
27
447
17.4K
liquidationemails retweetledi
Danny Naz
Danny Naz@ThePupOfWallSt·
The monthly charts across key sectors just tightened up and revealed where capital is quietly rotating. Healthcare is breaking out, insurance is turning off support, materials are coiling for a bigger move, and energy is still winding inside a long consolidation. These are the moments that shape the next multi-month trend. $XLV finally cleared the $157 ceiling and printed a strong breakout candle. As long as price holds above that level, healthcare keeps the momentum advantage. $IAK reacted with a bullish engulfing candle right off $124.75 support. A clean reclaim of $138 would confirm the next leg higher. $IYM continues to tighten inside an ascending triangle. Monthly squeeze is active, and a push through $150.70 sets up a run toward $168. $XOP posted an inside month while holding the bull flag structure. A break over $164.81 opens the path to $189 and $214 on the extensions.
Danny Naz tweet media
English
1
1
19
3.5K
liquidationemails retweetledi
EliZ
EliZ@eliz883·
I've taught you how to move several times now 👌Waiting for the Monday Range for new plan $BTC is now part of your trading strategy: it allows you to have a clear structure for the week, avoid impulsive entries and only trade when the price shows a real direction. The Monday Range is the maximum and minimum price formed during Monday. During the week, when the price breaks this range with volume and confirmation, the real directional movement (weekly trend) often begins. It is a simple strategy: do not anticipate, react to the breakout of the range. The logic is to trade only after the price has shown a directional choice, avoiding impulsive entries within the congestion at the beginning of the week. It is a strategy based on confirmation and reading the market's intention, not on anticipation.
English
93
68
766
149.2K
liquidationemails retweetledi
The Kobeissi Letter
The Kobeissi Letter@KobeissiLetter·
Meanwhile, the US and China are both signaling that a trade deal is now on the way. We just published our trades for premium members. Since 2020, our calls are up over +370%. Subscribe below to see how we are positioned into the week: thekobeissiletter.com/subscribe
English
6
10
151
74.5K
liquidationemails retweetledi
The Kobeissi Letter
The Kobeissi Letter@KobeissiLetter·
Key Events This Week: 1. Fed Interest Rate Decision - Wednesday 2. Fed Chair Powell Press Conference - Wednesday 3. Microsoft, Alphabet, Meta Earnings - Wednesday 4. President Trump Meets President Xi - Thursday 5. Apple and Amazon Earnings - Thursday 6. ~20% of S&P 500 companies report earnings this week We have a huge week ahead.
English
107
939
5.3K
506.5K
liquidationemails retweetledi
Popeye
Popeye@SailorManCrypto·
Price ranges 80% of the time, so if you are into trading, there is no alternative; need to learn how to trade ranges. Here's a collection of videos from my Learn and Trade series, all focused on ranges. Time to lock in and study! HOW TO TRADE RANGE DEVIATIONS youtube.com/watch?v=Z8C_LA… FIXED RANGE VOLUME PROFILE - FRVP youtube.com/watch?v=luCWdn… VISIBLE RANGE VOLUME PROFILE - VRVP youtube.com/watch?v=OdHoET… RANGE VOLUME PROFILE - PART 2 youtube.com/watch?v=qGEDNo…
YouTube video
YouTube
YouTube video
YouTube
YouTube video
YouTube
YouTube video
YouTube
English
2
7
88
5.3K
liquidationemails retweetledi
The Long Investor
The Long Investor@TheLongInvest·
Just about every successful person I’ve met has suffered at one stage.
English
45
15
574
46.6K
liquidationemails retweetledi
Danny Naz
Danny Naz@ThePupOfWallSt·
$LAES Weekly Chart A clean cup and handle breakout through $4.55 with a fired TTM Squeeze. Holding momentum above the 10/21 cloud as it targets higher Fib zones. Upside levels: $6.60 → $7.63 → $9.10 Downside levels: $5.57 → $4.55
Danny Naz tweet media
English
1
5
46
9.3K
liquidationemails retweetledi
Castillo Trading
Castillo Trading@CastilloTrading·
Vibes lately
Castillo Trading tweet media
English
17
18
371
28.2K
Danny Naz
Danny Naz@ThePupOfWallSt·
13 Weekly Charts. One Framework. Each weekend I break down where the strongest names sit in the Weinstein Stage Cycle, from early basing to full trend maturity. This week’s scan covers: $TSLA $AMD $HOOD $PLTR $APP $RKLB $MP $OKLO $NBIS $VSAT $BTC $LAES $HIMS Every chart is mapped with Fib targets, EMA cloud trends, and structure pivots so you can see exactly where momentum lives and where risk hides. The full breakdown’s live inside The Edge Lab, for traders who like their charts clean, their analysis deep, and their edge sharp. 👉 Subscribe to get all 13 setups each weekend.
Danny Naz tweet media
English
5
3
29
10.1K
liquidationemails retweetledi
John Bollinger
John Bollinger@bbands·
Potential 'W' bottoms in Bollinger Band terms in $ETHUSD and $SOLUSD, but not in $BTCUSD. Gonna be time to pay attention soon I think.
English
443
1.4K
10.1K
2.6M
liquidationemails retweetledi
plur daddy
plur daddy@plur_daddy·
Weekend thoughts on BTC. 1. The main issue capping BTC price has been OG selling. Putting myself in their shoes, this year was a logical time to sell. It hit the mythical $100k price target. The ideology around it had significantly shifted from being an expression of Libertarian idealism into a mainstream asset co-opted by Wall Street and the Trump admin. There were toppish signals from the TCs. There was finally sufficient liquidity to exit large bags. This was the apex of the 4 year cycle, so if you believed in it, you were selling for the last quarter or two. 2. It is undeniable that BTC has disappointed many this year by failing to demonstrate strong momentum despite immense buying from the ETFs, MSTR, and other TCs. Gold hit the afterburners and humiliated BTC, which has parallels to 2020. That year, BTC eventually stepped up to the plate and left gold in the dust, but there was a long period of frustration before that. 3. BTC has been too consensus for a lot of the year. There was no longer any uncertainty around it. Now, finally there is a sense of capitulation and anger. I certainly have been frustrated by the way it has traded this year. Positioning was significantly cleared last week, and when it finally does start decisively moving, it will soar into thin books. 4. BTC trades like aids most of the time, and then resolves into violent lockout rallies higher. In order to capture most of the upside, either you have to stay long continually and tolerate the pain, or be good at buying into the scare the hoes moments. We haven't seen a real BTC rally since April-June, and even that move did not have a long vertical stretch like the past. The last proper one was post election last year. 5. I continue to be super bullish on the underlying macro over the next 6-12 months. The Trump admin wants to go balls to the wall and is leaning into pro-cyclicality, and they are dispensing with conventional guardrails against running things too hot. This is more important than any other factor in the markets. Unfortunately BTC was not the optimal vehicle to express this view this year, but my macro views have been correct, and played out enormously in other assets such as gold and stocks. 6. Pulling this all together, the picture is extremely simple. BTC is coiled and ready to finally have a violent rally higher, when OGs finally stop selling. I do not know exactly when this will be. What I am trying to figure out, is whether OGs view the 4 year cycle as having already concluded (a framework around 1064 days) or are still waiting for year end (a framework driven by the calendar year). Beyond that, whether the 4 year cycle has been the main driver of their selling, or if they would continue dumping past the date. 7. I am not certain when the bottom will be. Buying the stone bottom has never been my strength as a trader, and I am putting a lot of work into improving on this dimension. I am best at overall macro backdrop, staying long in size for meaty trends, and selling parabolic tops. I am generally not good at trading in choppy conditions. There are solid signs that we have entered a zone of value, but I do not know whether there will be another leg down or not. In any case, given the way BTC PA has evolved, and the psychological debates playing out in the market, it is more likely that we would see an ugly grinding bottom, not a V-shaped one. Have a great weekend everyone. It's a good time to unplug and refresh after an intense window.
English
147
114
1.4K
245.8K
liquidationemails retweetledi
Machina
Machina@EXM7777·
how to get rich by actually using your brain:
Machina tweet media
English
30
380
4.3K
1.3M
Popeye
Popeye@SailorManCrypto·
It was $BTC on the upper chart and $ETH on the lower chart. Structurally, $ETH is looking much better as it is still holding the range and that recent low, while $BTC has broken down from the range and formed a further structural low. So, while the upper chart is more likely to provide better results with shorts, the lower one might still favor longs. Also in terms of invalidations, the lower chart is much cleaner since we are still holding support compared to the upper chart. Both charts can be interpreted in many different ways, no absolute right or wrong. The main point of the exercise was to focus on the context, rather than the outcome, which in this case was considerably different.
Popeye tweet media
Popeye@SailorManCrypto

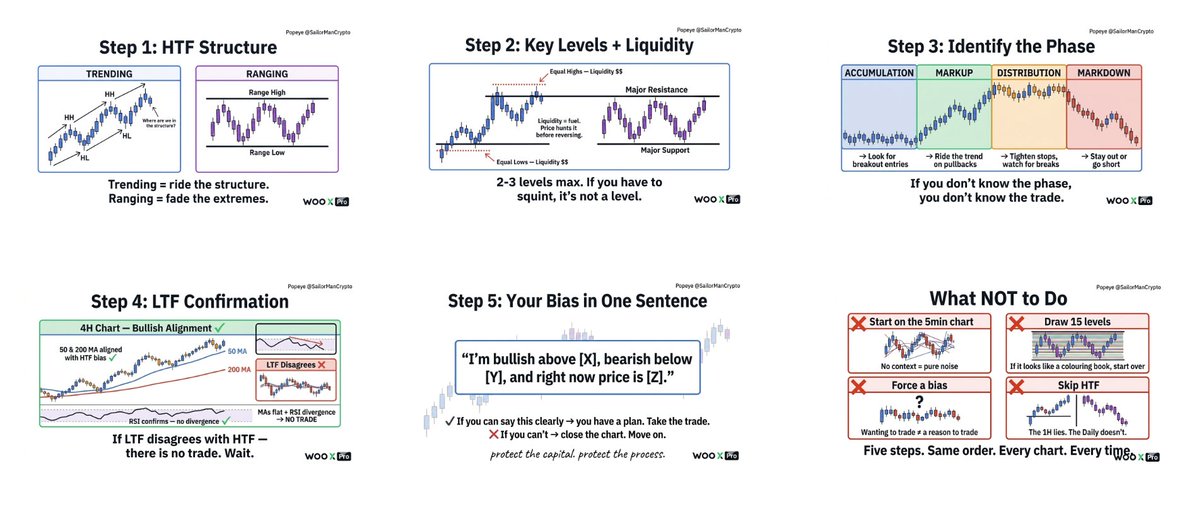
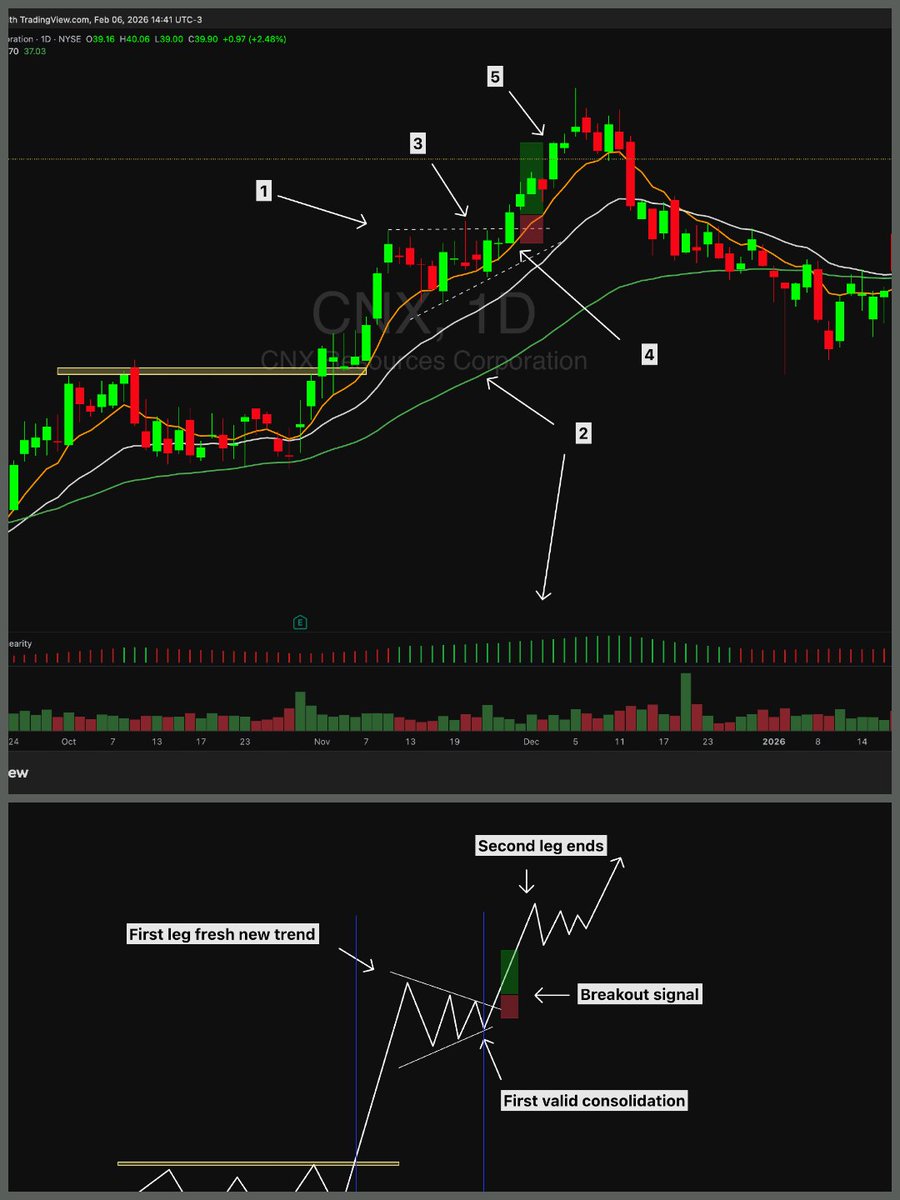
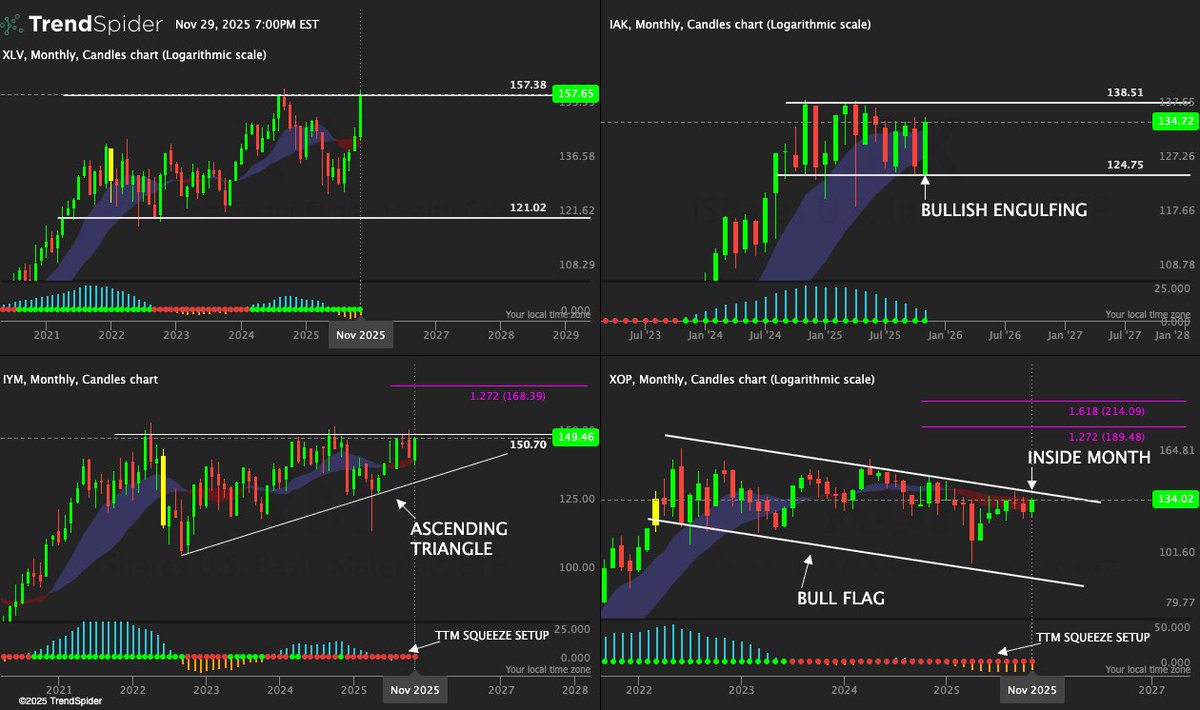
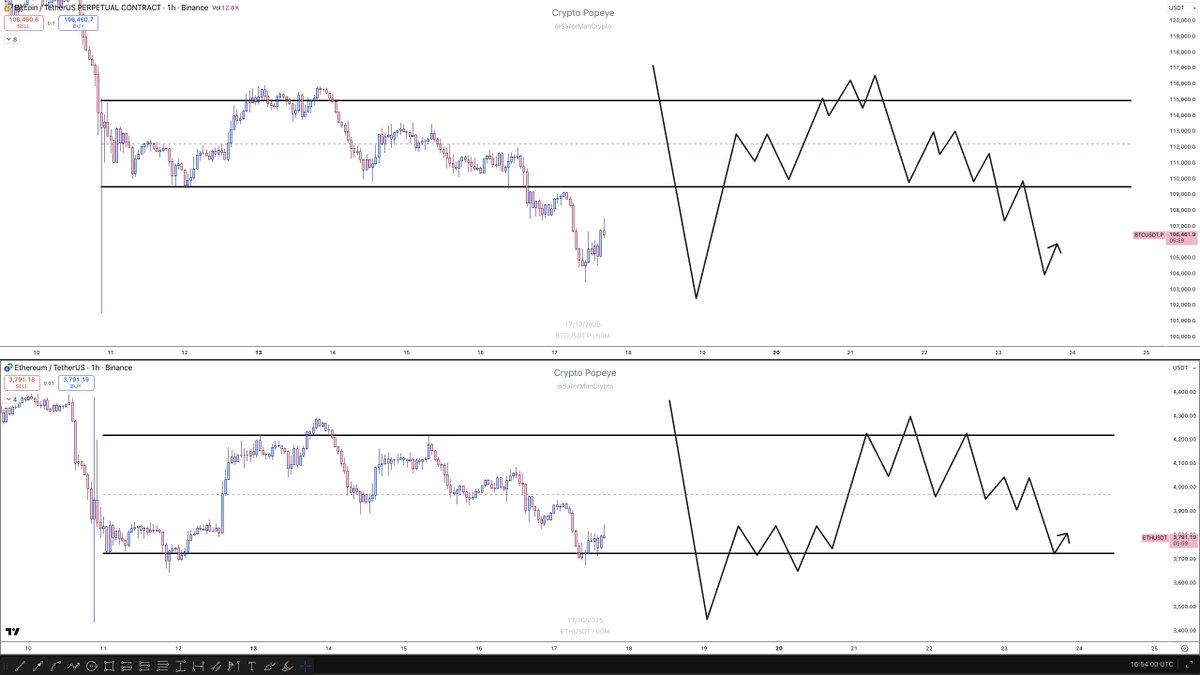
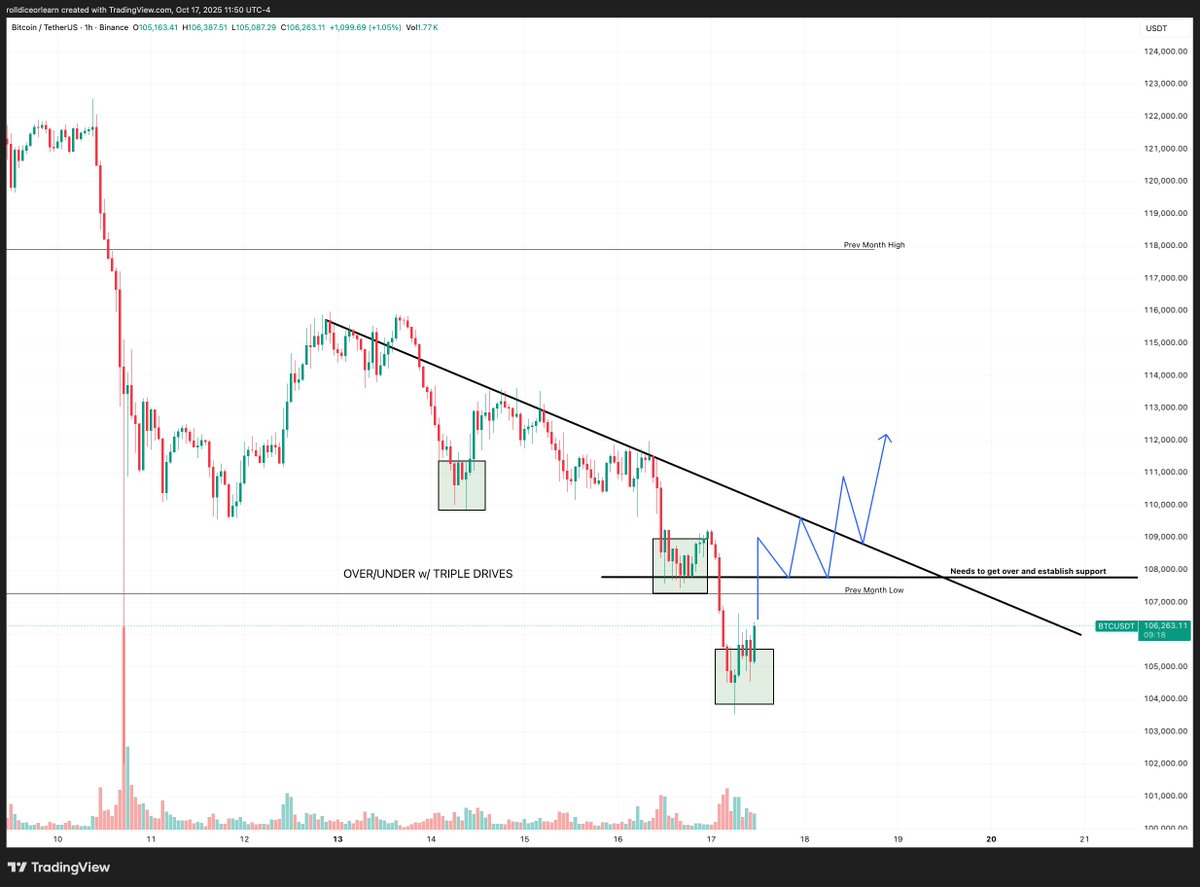
What do you see and what would you do in these two charts? - Bias - Trade Direction - Why and where to trade - Why are they different?

English
6
11
94
23.2K