Sabitlenmiş Tweet

FVG THEORY
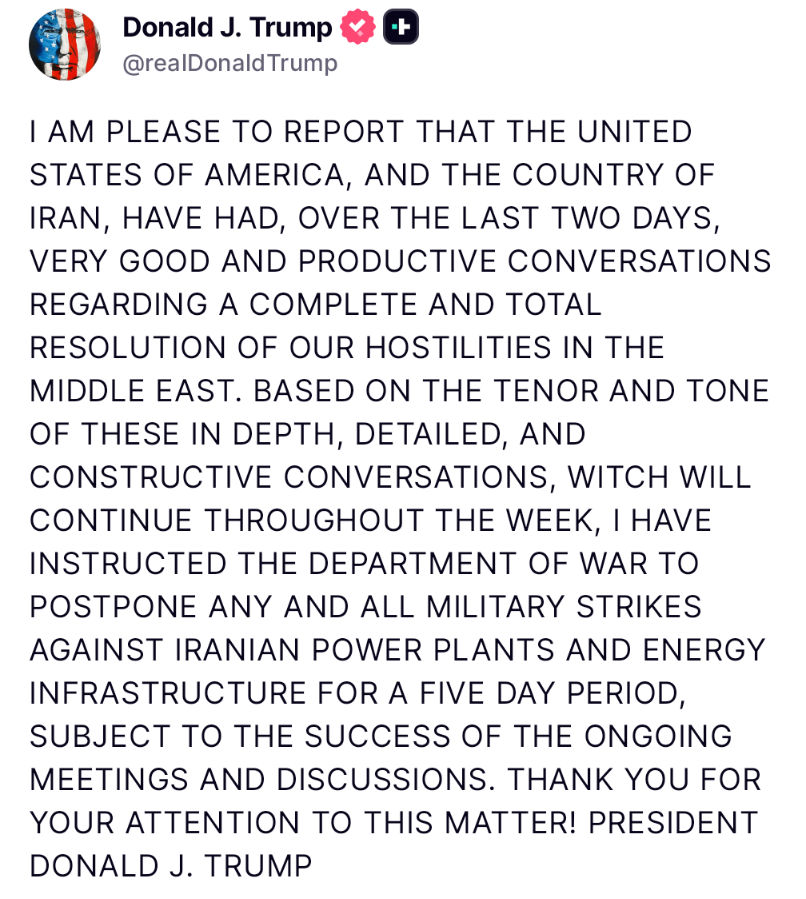
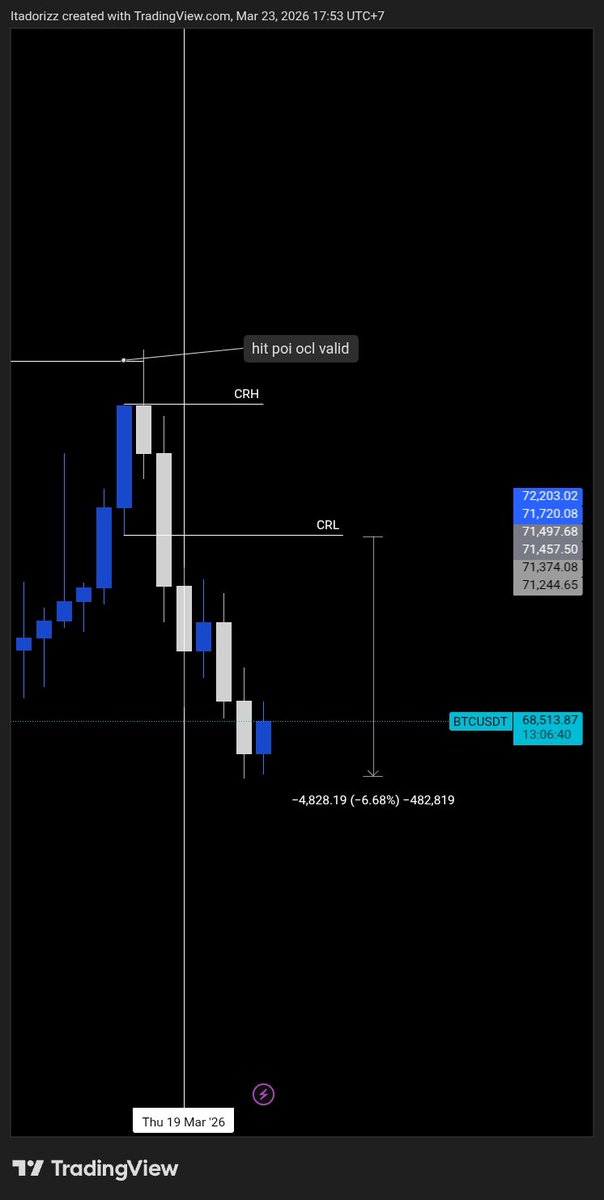
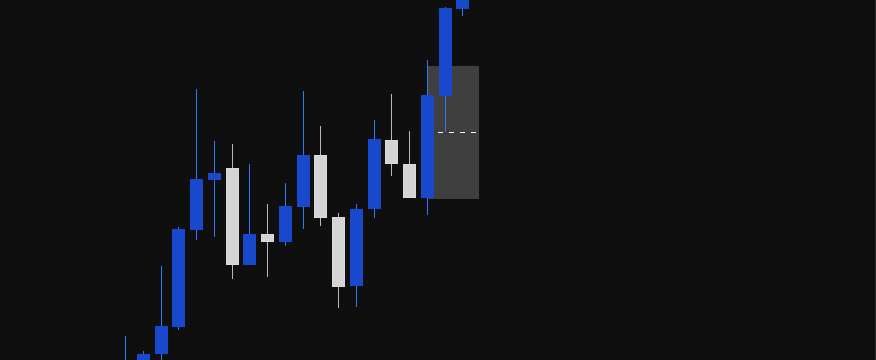
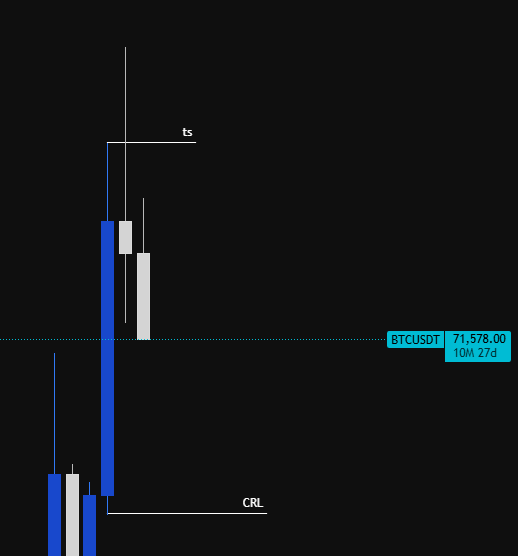
One more thing I learned in the financial market. Technical analysis can sometimes predict the future. Example: $BTC has formed a TS / CRT, so it should drop to CRL. Right? That's the theory. But there must be a reason why it can drop that far. What is it? Yep, turmoil in the Middle East and the US. This has caused economic instability, leading investors to choose gold or other safe-haven assets.
This is a 3M GOLD candle. What is happening there?
Similarly, when we see an FVG or momentum candle on the 3M XAUUSD timeframe, when the first bullish candle occurs, it can be said that it is a momentum candle. In theory, when a momentum candle occurs, the price will continue to rise. And yes, the price of gold continues to rise. But behind this rise, there must be a cause, right?
find out about the conflict that occurred at the beginning of Q4 2023.
Next...
There are four quarters in a year.
So every three months there is a change of quarter.
Therefore, we can use a three-month timeframe chart.
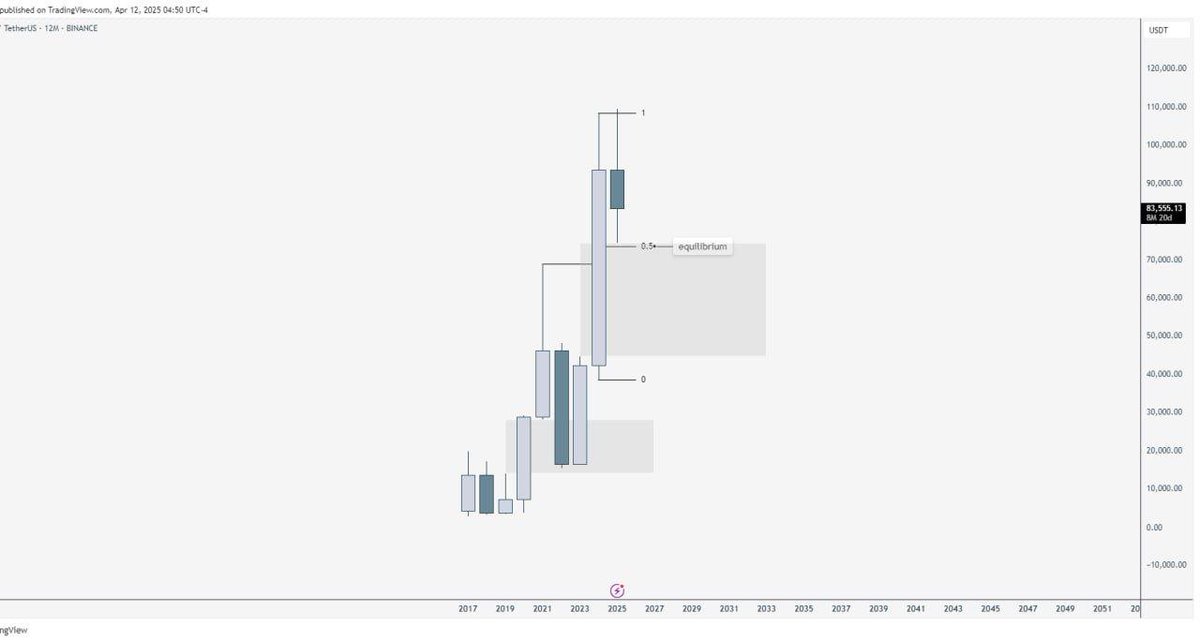
There is a mid-quarter point in the year, which is the closing candle in June, so we use a six-month timeframe.
And in four quarters there are 12 months, or one year, so we can check the one-year timeframe.
FVG in trading refers to price imbalance, or fair value gap.
But in the real world, FVG is a major event that occurs where there are new rich people and new destinies are changed, whether it be the fate of a country, its people, or individuals.
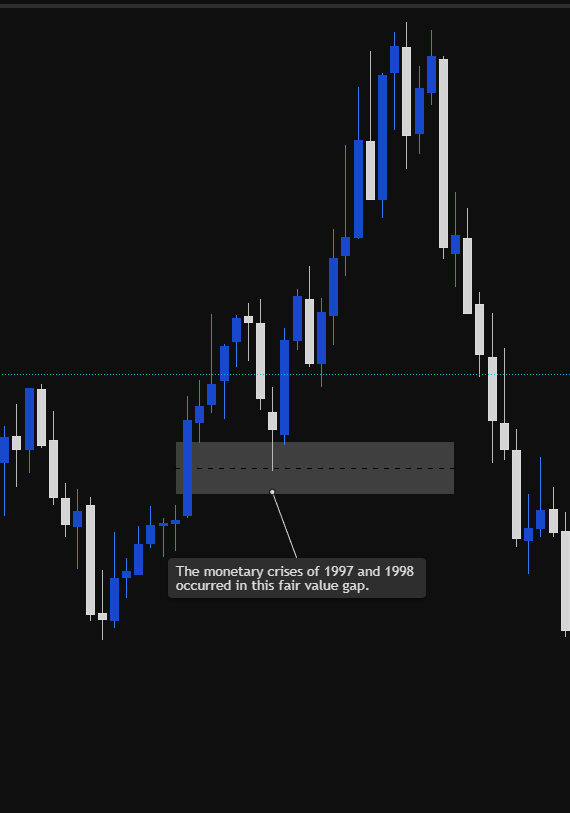
FVG is how the elite widen the GAP between the rich and the poor, bad luck and good luck, and create crucial events for the elite.
The monetary crises of 1997 and 1998 occurred in this fair value gap
So, in conclusion,
every FVG on a large timeframe is a sign that an event will occur that will affect the fate or direction of the world.
And every major event that harms a particular country and threatens other developing countries will cause a change in the trend or fate of other countries.
Thanks to my friends @dappsliq (tele)
- lucexbt & dapps
luce (pf arc)@luceurbae
mapping an lama ternyata jadi wick di tf 12M bearish storyline for $BTC kalo kita ambil konsep CRT / Candle Range Theory sudah membentuk CRT. dan untuk target price nya adalah CRL / Candle Range Low. Area 38K #dyor
English