
wongatron
48 posts

wongatron
@mcwongatron
A hobby investor with 55% verified annual returns since Q1'22.
London, UK Katılım Nisan 2018
1.4K Takip Edilen43 Takipçiler

The year is 2050
Astronauts (& their agents) are doing research on Mars.
Humanoid robots are everywhere.
People are routinely living well past 100.
$PYPL is around $50 per share & buying back a ton of the float.
English
@Para_Capital Has Nebius disclosed their current utilization rate?
English


How do we know the AI bottlenecks are starting to disappear or the demand is starting to wane?
I can think of three early indicators:
1. Memory pricing stabilize and come down
2. Usage limits removed from Claude, OpenAI
3. CapEx spend tapers off
This way we are not waiting for our companies to have slowing revenue or lowering guides to wait for.
What are some early signs you guys are focused on?
English
@cashflow_king94 And what about 503 stocks? That is what most people own :)
English

Unpopular opinion: Most people would be better off with 5 stocks than 50
English
@Kaizen_Investor The Plus subscription is $20 but there are couple of Pro tiers as well that offer much more compute. I can't say for Plus, but for Pro the cost per SOTA token is better value compared to Anthropic or Google APIs.
English

@mcwongatron What do you pay for gpt? Isn’t it all around $20?
English
Which AI do you guys use to help your research and why?
Looking to expand my tools.
English
@Ren_aramb Ah you're using Q1 annualized, that makes a difference. Either way, dot-com bubble comparisons are misguided.
English


To think people are expecting the bubble to pop like it did in the dot com era
Today’s Mag 4 P/E ratios:
$META – 16x
$GOOGL – 17x
$AMZN – 24x
$MSFT – 25x
Dot-com bubble peak P/E ratios:
Microsoft – 73x. Cisco – 200x+. Yahoo – 800x.
The Nasdaq as a whole traded at a P/E of 200 at the peak of the dot-com bubble.
Today’s “bubble” is trading at 16-25x earnings on companies generating hundreds of billions in real free cash flow.
Today we have the most profitable companies on earth,
$MSFT $GOOGL $META $AMZN reported beats on earnings, and you think we are in a bubble.
Joseph Carlson@joecarlsonshow
This is so crazy it literally looks fake.
English


@mcwongatron It's fun, but for actual apps with complex logic that need to be highly reliable and always be spot on, I still trust real engineers :)
English
Any cracked 10x engineers in my audience (now 100x with AI coding tools) down to build high-alpha finance apps for investors? DM me.
Condition: Portfolio size and track record don't matter, but you must have a passion for investing yourself!
English


@littletotoro8 Do you update line items based on macro? For example, if there is a significant change in interest rate expectations then update column 1 for Fintech names etc.
English

I predict their margin 3Y ahead.
Given that all of them are compounders, whether weak or strong one, their CoGs and operating expenses are quite predictable.
Core idea is: margin expansion occurs when revenue grows faster than operating expenses.
Revenue > Expense = margin expansion
-> will be profitable one day.
I simply use their historical +QoQ expense growth to predict their expenses 3Y ahead, combined with consensus revenue growth by analyst, adjusted to their inclination of sandbagging by +% to achieve margin 3Y ahead.
It's not a perfect method, but atleast it may tell "something" about those stock instead of excluding it out completely from the framework.
For non-compounders with no profit, their operating expenses are hard to predict. I either assign a higher execution risk, or avoid them completely.
English
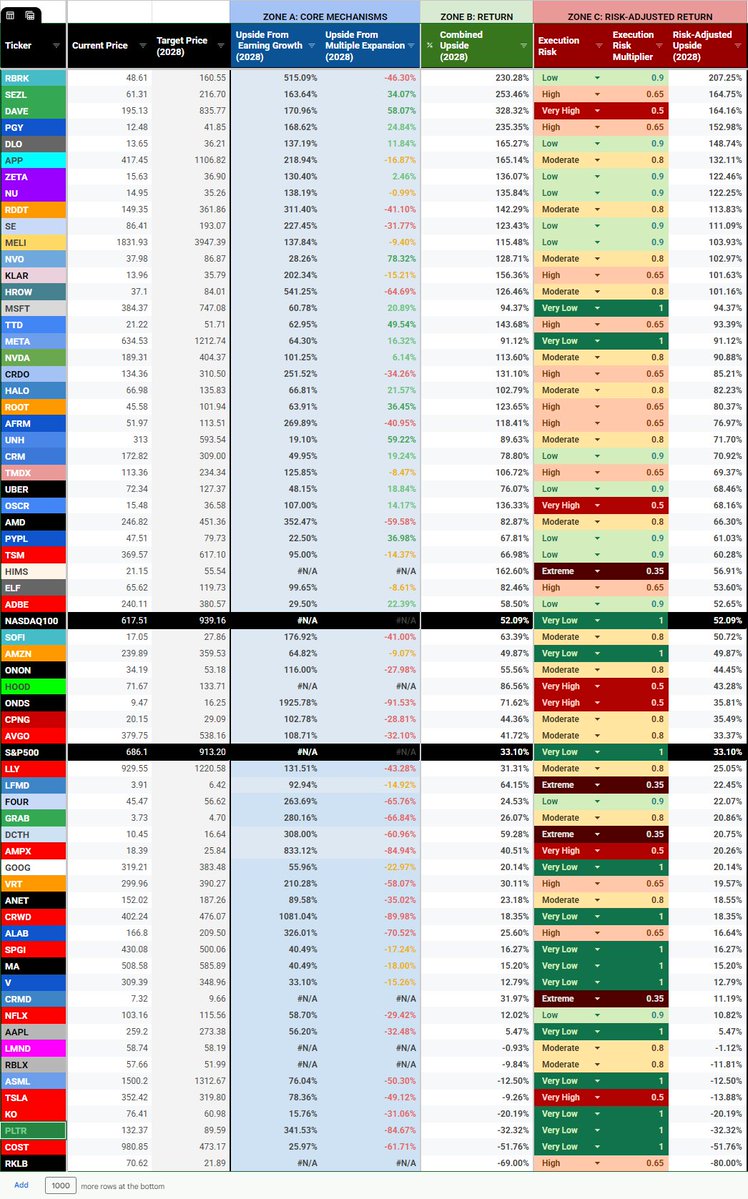
UPDATED COMPREHENSIVE FRAMEWORK
(Updated Intrinsic Value Calculation - April 2026)
========================
Framework Definition
This framework calculates the Expected Return of a stock over the next 3 years (end of 2028).
It is based on 12 steps of internal methodology inside this framework, to convert companies from different sectors, stages, industries to a standardized “Leaderboard”
The Goal
By normalizing every stocks to a 3 years holding period, with a uniform % upside metric, will allow comparing companies from different properties to a single objective field of “upside”
Every upside % → shares the same timeframe, 3 years of holding.
========================
To use this framework:
This framework is separated in 3 Zones: with each Zones assigned an upside number %, from different stages of analysis.
🔵 Zone A → 🟢 Zone B → 🔴 Zone C
🔵 Core Mechanism → 🟢 Overview → 🔴 Reality
========================
🔵 Zone A (Blue columns): Core Mechanism
Explains 2 core machanisms of what drive stock prices:
🔵 1. Earning Growth
🔵 2. Multiple Expansion
🔵 Column 1: Upside From Earning Growth Fundamentally, an increase in annual earning directly increase a stock economic value. This column is designed to calculate estimated earning growth that will occur over the next 3 years.
Higher value indicates stronger pace of underlying business growth.
🔵 Column 2: Upside From Multiple Expansion. Market always assign a “valuation” to a stock. Valuation is denoted as multiples. (Ex. 22 P/E = 22 Multiples)
This column is designed to evaluates their current multiples and a fair multiples. Fair multiple is calculated based on quality of earning itself, based on these parameters: 3Y Forward PEG = 1, Industry, Ability to compound, Ability to retain revenue etc.
For example: a company with current 30 P/E, but has fair value of 20 P/E would receive a -50% Upside From Multiple Expansion (a penalty)
→ Positive % suggests that the stock is currently undervalued relative to its quality, therefore, has room for P/E ratio to expands.
→ Negative % suggests that the stock is expensive. Stock today has price that doesn’t yield a great earning return in relative to its quality, and has room of opposite to multiple expansion, a “multiple compression”. In other words, downside in the future.
========================
🟢 Zone B (Green columns): Expected Return
🟢 Column 3: Combined Upside This column multiplies 2 mechanisms from first 2 columns together.
Formula = Column 1 (Earning Growth) × Column 2 (Multiple Expansion)
It represents total upside potential of the stock over the next 3 years if the company executes perfectly, and if the market remains rational.
In a perfect world, this is the return you will get from holding this stock for 3 years.
However, this method has flaws, as this world/market is not perfect. It assumed a perfect prediction of earning growth, and a perfect prediction of market’s emotion to appreciate a company quality enough to give a “fair multiples”, which is never the case in real life.
Which leads to Zone C
========================
🔴 Zone C (Red columns): Risk-Adjusted Return
This zones adjust Zone B & Column 3 into real market
🔴 Column 4: Execution Risk Level Not every company has equal quality, not company is equally reliable. This column adjusts existing Expected Return from Column 3, and adjusts for risk: management track records, moat/qualities, regulation risks, etc. Execution Risk ranges from Very Low (High moat, highly predictable) to Extreme (Uncertainty)
🔴 Column 5: Execution Risk Multiplier Execution Risk Level is assigned to a numerical multiplier to Expected Return. Execution Risk: Low → 0.9 Multiplier Execution Risk: Very High → 0.5 Multiplier As a result, the higher the risk, the lower Upside % overall
🔴 Column 6: Risk-Adjusted Upside (Final Product) The final product of the sheet. This columns accounts for expected upside over the next 3 years, accounted for Execution Risk.
Formula: Column 3 (Combined Upside) × Column 5 (Execution Risk Multiplier)
As a final product (Column 6, Risk-Adjusted Upside) will be used as main determinant of an investment choice.
========================
✅✅✅Example of my picks from this framework:
$APP → High Earning Growth, fair multiples, high quality earnings.
$CRDO → Very high growth with strong CapEx tailwind.
→ Cheaper than peers $ALAB → room to rerates to higher multiples
$MSFT, $META, $AMZN, $TSM → Safe “Core Stocks”, long term compounder, attractive valuation given their ability to compound & retain earnings.
$NU, $DLO → High upside from Earning Growth, attractive multiples, diversification from US.
$DAVE → High growth, extremely undervalued, but comes with severe regulation risks.
$RDDT, $RBRK → Expensive, but compensated by very strong growth.
❌❌❌ Example of my avoids:
$PLTR → Very high growth & Quality, but insanely overvalued
→ Actually ranks #1 in Quality Score Model, far above others, but the valuation is too high to justify an investment.
$RKLB → No profit in forseeable future (2028) → hard to evaluate intrinsic value.
$NVO, $UNH, $ADBE → Cheap, but rely too much on multiple expansion → require the market to rerates higher → rely more on luck
========================
To use this framework to help pick stocks step by step:
1. Avoid less than -25% in Upside From Multiple Expansion
2. Look for Highest Upside From Earning Growth
3. Look for Highest Risk-Adjusted Upside
4. Look for as low Execution Risk as possible
No stock is perfect.
→ Stocks with higher upside tend to come with higher risk
→ Low risk will comes with low upside This framework only helps to find a great Risk/Reward opportunity based on numbers, but by its own is not enough. Always do research, build your conviction, along with concrete fundamental numbers.
========================
Notes: This sheet exclude diffucult stock to evaluate: Extremely Cyclical: $MU, $SNDK, Bitcoin Miners/HODLers
No-profit stage: $NBIS, $IREN, $ASTS
Highly Speculative: $IONQ Rare Earths, Biotechs, Robotics, Space
Uninteresting stocks: Majority of SaaS, Banks, Insurances, Matured stocks
Excluding these stocks define your “Circle of Competence” strictly.
If a stock go up +50%, you must understand the mechanisms of it. Whether you do or don’t, it is the thin line between guessing and investing.
English

Unfortunately, on my birthday (4/9), I was in a severe accident and fractured my pelvis in 6 places, which led to a 9 hour surgery. The last few days since have been completely unhinged. I’m recovering now and taking it day by day, and it definitely puts everything into perspective fast. Grateful to be here. 🌹
English
@DrewCohenMoney An AI model moat can arise from a data moat, and Meta has a vast data moat
Română

The better Meta’s model, the more evidence AI is commoditized
If a laggard can just spend their way to the top, then that suggest there aren’t much moats in the AI Model world
Joseph Carlson@joecarlsonshow
Meta just released their AI model. meta.ai The benchmarks look very strong. The stock is up 8% today. $META
English
ROIC
Most investors love growth and get excited when they see revenue increasing, earnings going up, and free cash flow improving. On the surface everything looks great, the story makes sense, and it feels like the business is getting stronger. But growth alone doesn’t tell you if value is actually being created, because regular growth by itself is irrelevant, only efficient growth matters.
What actually matters is how much a company earns on the capital it puts back into the business. This is what ROIC measures, and it is one of the most important, underrated and misunderstood concepts in investing. It tells you, for every dollar reinvested, how much profit is actually produced. Without that, growth is just useless spending. This is how it’s calculated:
ROIC = NOPAT ÷ Invested Capital
NOPAT is after tax operating profit. Invested capital is the money required to run the business, which you can simply think of as debt plus equity minus cash. The formula looks like this:
ROIC = Operating Income × (1 − Tax Rate) ÷ (Debt + Equity − Cash)
This simple formula is one of the most important concepts in investing! Imagine a business earns $100m in operating income and pays a 20% tax rate, so it keeps $80m. If it needs $400m to operate, that’s 80 ÷ 400 = 20%. Yes this is dumbed down but essentially every $1 inside the business produces $0.20 a year.
Now take another business with the same $100m of operating income and the same taxes, so still $80m. But this one needs $1b of capital to operate, which is 80 ÷ 1,000 = 8%. Same earnings, completely different business.
This is where most investors get it wrong because they stop at the income statement. That’s why you see so many ignorant posts on X that say over the last 5 years sales up 500% and stock price is flat.
They see profit or growth and assume value is being created, but they never ask how much capital it required. The business looks the same on the surface, but the economics are completely different!
Most people think growth creates value. In reality, growth only creates value if returns are high. If ROIC is low, growth actually destroys value. The more capital you pour in, the more you dilute the quality of the business (this is different from shareholder dilution). The company gets bigger, but the value per dollar goes down. Here is the formula used for growth:
Growth = ROIC × Reinvestment Rate
If a business earns 20% and reinvests 50% of its earnings, it grows around 10%. If another business earns 8% and reinvests the same 50%, it grows around 4%. Same effort, completely different outcome.
This is why high ROIC businesses with long runways are so powerful, ie $MELI. They don’t just grow, they compound efficiently because every dollar is productive.
Now let’s consider the cost of capital, because the only thing free in life is cheese in a mousetrap. This is where value is actually created or destroyed. It works like this:
Value Creation = ROIC − Cost of Capital
If a company earns 20% and its cost is 8%, that 12% spread compounds in your favor. If it earns 6% with an 8% cost, it is destroying value even if the income statement looks great.
And then there is another aspect almost no one looks at which is “incremental ROIC”. Everything so far is based on the current business, but what really matters is the return on the next dollar not just the previous one. That’s what tells you where the business is going, not just where it’s been.
If a company earns $100m and reinvests $50m, and next year it earns $110m. That’s $10m on $50m, or 20% (very strong). Now imagine it only grows to $103m, which is $3m on $50m, or 6%. Here is the formula:
Incremental ROIC = Change in Profit ÷ Reinvestment
The reported numbers can still look strong while the new money is earning less. That’s usually the first sign the business is weakening which is usually almost immediately followed by a significant decline in share price.
1/2 👇
English
I came across a peculiar portfolio today, allocations are:
$MELI → 24%
$AMZN → 17%
$MSCI → 14%
$BRKB → 12%
$NOW → 11%
$SPGI → 9%
$MA → 9%
$DLO → 4%
What do you guys think?
🌹
English