Sabitlenmiş Tweet
mikkom
2.3K posts


mikkom
@mikkom
mostly AI / ML / Quant ramblings from a multiple startup founder CTO guy
Helsinki, Finland Katılım Mart 2008
121 Takip Edilen941 Takipçiler
Did not know this. This might have interesting practical use cases.
Gappy (Giuseppe Paleologo)@__paleologo
I did not know that, for any random variable x, | mean(x) - median(x) | <= stdev(x) Direct proof:
English
@heynavtoor If you don't do forward testing, this is totally worthless as AI already knows how each stock moves in the past and with LLM's you can't go around that.
English

🚨 Hedge fund managers are going to hate this. Someone just open sourced a system that does their entire job.
30.5% annualized returns. $0 in fees.
It's called TradingAgents.
Not one AI agent. An entire simulated trading firm. Analysts, researchers, traders, and risk managers. All AI. All arguing with each other before making a single trade.
No Bloomberg Terminal. No $50K data feeds. No MBA required.
Here's what's inside this thing:
→ 4 AI analysts scanning financials, news, social sentiment, and technicals
→ A Bull and Bear researcher that literally debate each other
→ A trader that synthesizes every argument into a final call
→ A risk management team that can veto any trade
→ A fund manager that approves or rejects execution
Here's the wildest part:
It beat every traditional trading strategy they benchmarked. Cumulative returns. Sharpe ratio. Max drawdown. All of them.
Hedge funds charge 2% management + 20% performance fees for this exact workflow. This is free.
100% Open Source.

English
@KBGreyhoundlady @nafoviking @AbhorBrexit but it's part of EEA which matters here
en.wikipedia.org/wiki/European_…
English

@nafoviking @AbhorBrexit Norway isn’t in the EU
English

Norways giga find of rare Earth minerals turns out 80% bigger than expected. China can no longer blackmail the EU.. America has made the choice to push Europe away, so this is bad news for both China and America. nrk.no/vestfoldogtele…
English


Armenia turns its back on Moscow and adopted a law to join the European Union
English
@kaizen_trd Totally agree but why use dollar amounts instead of percents?
English

@aw_trades_ @KaizenFunded you need to test live. it's when you really find out what was wrong, easiest way to save your time if you only trade small
English

@KaizenFunded So I’m doing a lot of tests to prove it’s not overfitting which are looking good however no forward testing yet with the successful combinations of settings. That’ll be the next step because you’re right it could vary quite a bit
English
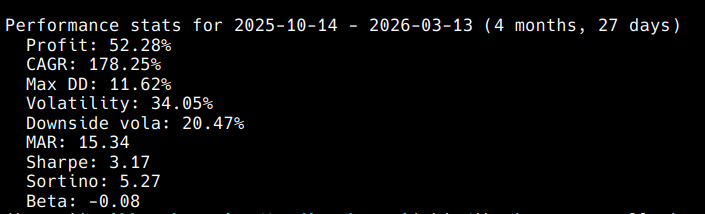
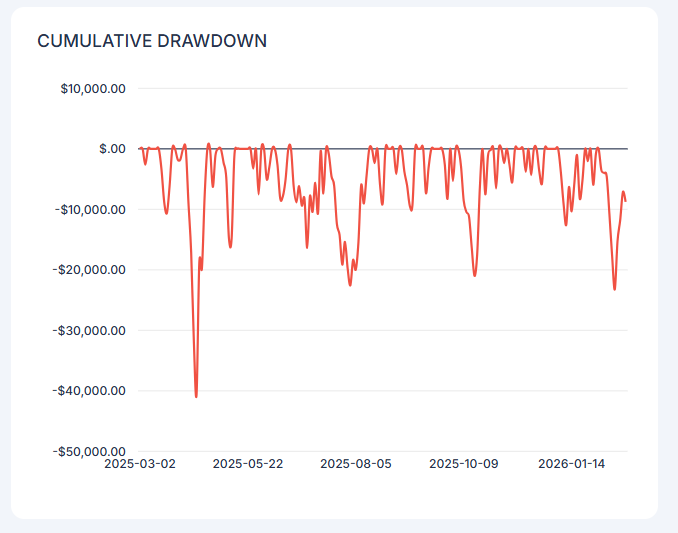
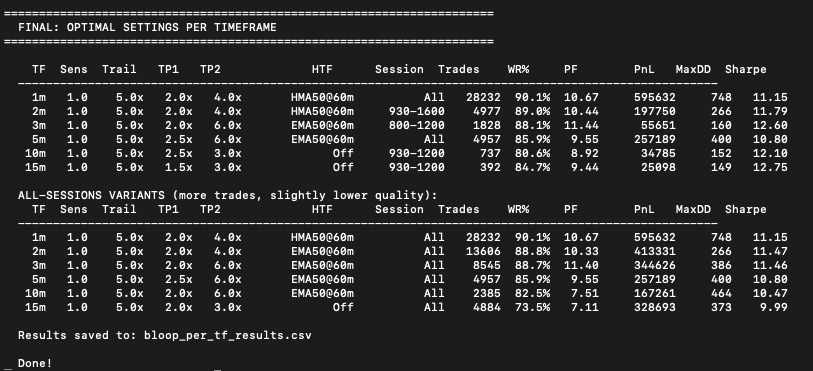
More Bloop testing results!!
773,393 bars of NQ. Every timeframe optimized independently.
1m - 90.1% win rate
2m - 89.0% win rate
3m - 88.1% win rate
5m - 85.9% win rate
10m - 80.6% win rate
15m - 84.7% win rate
All profit factors above 8.0
All out of sample validated
27 out of 27 months profitable
Thread on how I tested this coming next :))
English

@H3roAi @jonatanpallesen This was exactly what I was thinking of, if the mean goes up and standard deviation goes down (for example because more people have access to good education and women can go to school more easily) the number of outliers diminishes.
English

Umm Is this the correct assessment of the data. Correct me, please.
1. IQ is measured based on stand deviations, if I am correct.
2. IQ is measured relative to the current population taking the IQ test, so the current population becomes tehg base line.
3. If IQ is measured based on standard deviation and and relative to the population, there is no objective 100 IQ metric if the average of the population is shifting over time.
4. Do we know if the average has stayed flat objectively over the years?
5. Do we know if the results are just such that the average IA is going up but we cannot see that because the average will always be 100 as the baseline?
6. If this is true, could it not also be true that as a whole we are moving toward an over all everage and thus the standard deviation of 130+ would be definition go down?
@grok
English

The proportion of high-IQ people in the world is declining fast.
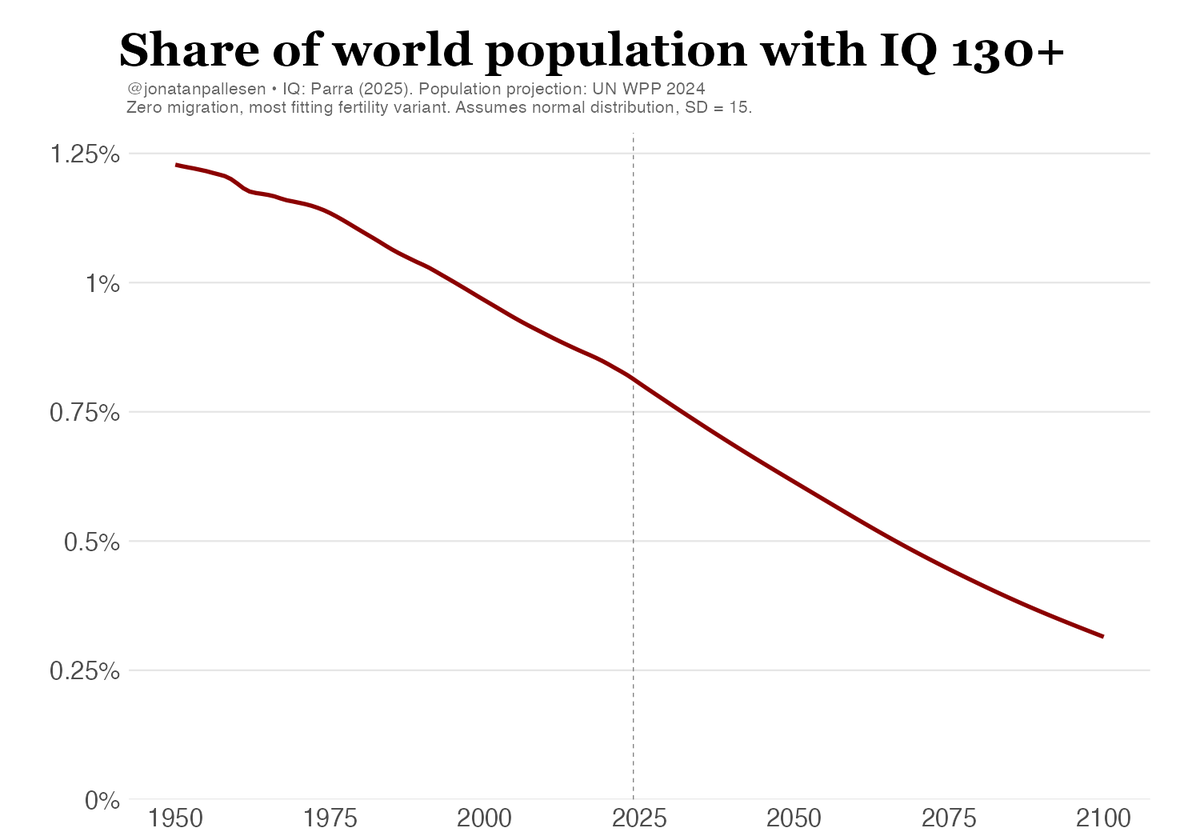
Jonatan Pallesen@jonatanpallesen
The total number of smart people in the world has just peaked. And now it's about to crash.
English
mikkom retweetledi

Luxury cars were never designed for rich people. I paused buying cars after learning this truth
English


I basically optimize position risk directly by doing constrained optimization with constraints being maximum volatility down and maximum dd with monte carlo stationary bootstrap on simulated results for my system from backtest for about 5-10 years of data.
What is important of course is you need to have confidence that your backtests are realistic, I do monitor my simulation vs live system almost daily and check that results match.
Instead of backtested data it's of course wven better if you have longer termlive data but I don't have that yet for my current system.
Stationary bootstrap is great as you kind of have volatility clustering and regimes partially modeled in.
then you just select confidence interval you are happy with and optimize your position size so that it keeps under the defined risk boundaries at your selected confidence boundary and you have the position size.
English
Please don't use kelly for trading. It is not suitable.
I see so many people posting about kelly this and kelly that related to trading.
Kelly was originally designed for gambling. Gambling has fixed rules that typically favour the house but in some cases you can find an edge. Because the rules and the environment are fixed, the edge can be calculated. In trading you have volatility clustering and fat tails and everchanging environmental chaos from both external event, varying participants and market internals.
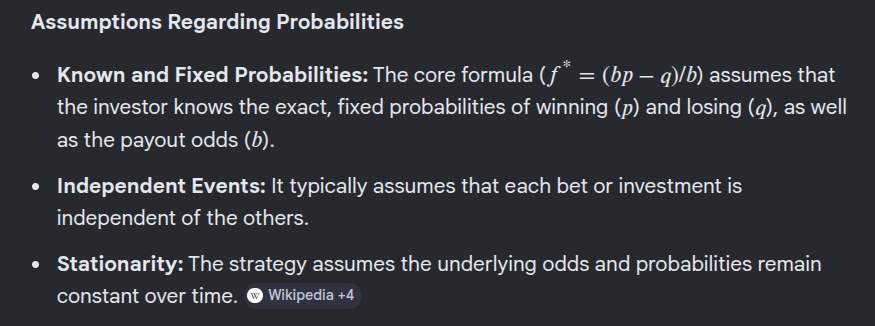
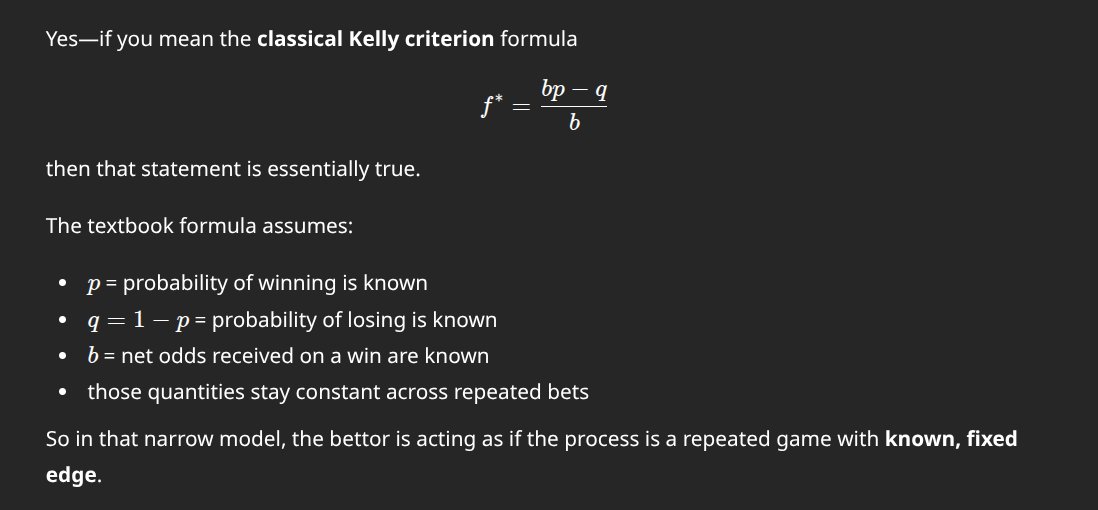
Kelly assumes fixed and known constants. In trading NONE of these is true:
- Environment is known and constant
- Ratio of wins/losses is constant and known
- Payout is constant and known
You can get much better results via backtesting with decent sample size + monte carlo uncertainties.
/rant
English
Yes, the general form can incorporate volatility/fat tails via better modeling. But if you add DD/vol constraints the optimization target changes: you're solving for position risk directly, not deriving from the unconstrained Kelly optimum. The Kelly f* becomes a ceiling/reference point at best.
That was kind of the point I was trying to make but it was quick rant so not totally clear.
English

@mikkom Kelly is argmax E[log(return)], not ((bp-q)/b). The solution to the argmax can take everything you said into account.
English
Olin ehkä epäselvä ekassa viestissä - tarkoitin alkuperäisellä postauksella nimenomaan position koon määrittelyä tuon perus kelly-kaavan kautta en alphan generointia joka on sitten ihan eri juttu.
Periaatteessa position voi määritellä siis myös kelly-fraktion kautta optimoimalla kertoimen ihan vastaavasti kuin itse teen suoraan mutta optimoin position riskiä suoraan mutta silloin mukaan tuo vaan turhan kerroksen kiinteitä epärealistisia arvoja ja koska markkina ei noudata normaalijakaumaa niin tulos ei ole niin realistinen kuin jos optimoi oikeita tuloksia vastaan esim monte carlolla stationary bootstrapilla jota kautta saa esim volatility clusteringin/regiimiklusteroinnin suht siististi mukaan simulaatioon.
Suomi

@mikkom @cookrl754 Okei ja tuo on täysin validia toimintaa. Kuitenkin on eri asia kuin kutsua markkinoita optimointiongelmaksi kuin se, että itse rajaa ongelman parametrit ja optimoi niiden viitekehysten sisällä. Et ratkaise markkinoita vaan itse määrittelemääsi pikku saarta niiden sisällä.
Suomi
Tavoite on mahdollisimman suuri tuotto määritellyissä riskirajoissa.
Mitkä ovat riskirajat on sitten jokaisen määriteltävä itse, omalla kohdalla esim määritelty maksimi dd ja erikseen volatileetti alaspäin.
Jos puhutaan portfolion optimoinnista niin sitten mukaan voi tulla esim korrelaatioita tai factor-riskejä ihan sen mukaan mikä oma riskihalukkuus on.
Suomi
@mikkom @cookrl754 Tai vähintääkin optiman löytäminen on käytännössä mahdotonta/turhaa. Esim markkinoilla, mikä on optimasi? Tuottojen absoluuttinen maksimointi? Mutta millä riskillä, millä volatiliteetillä. Millä kulkemallasi polulla. Kun ymmärtää asian noiden valossa, puhdas optima ei tee järkeä.
Suomi
@lastpopperian_ @cookrl754 Jos sinulla on suora optimointiongelma ei auta vaikka mukaan tuo lisäkerroksia, se vaan monimutkaistaa optimointia. Ei tämä ole mikään ego-asia.
Suomi
@mikkom @cookrl754 Se kvalitatiivinen ero ymmärryksessä sinun ja Ronaldin välillä on huikea. Hän keskittyi täysin substassiin kirjoituksessaan; super selkeä ja johdonmukainen. Kannattaa ottaa mallia Mikko, sen sijaan, että puolustelet älyllistä egoasi.
Suomi
English


BREAKING:
FINALLY SOMEONE SAID IT!!!
🇪🇺🇫🇮🇺🇸🇺🇦 STUBB: EUROPE TO PROVIDE TRUMP SUPPORT WITH THE STRAIGHT OF HORMUZ IF AMERICA AGREES TO PROVIDE THE NECESSARY SUPPORT TO UKRAINE
THIS IS THE WAY

English
Contrary what you think I do understand kelly and the mathematics behind it and I do understand what you write and have actually read the book. It was you who started the first reply with ad hominem "I hate to do a takedown...".
What I'm trying to say is: Kelly is from the time before you could run full sophisticated constrained optimizations whenever you want to as you can now with your laptop. With chaotic systems with unpredictable distributions you get much better results when using them instead of formula that assumes distributions that the system you are optimizing to doesn't follow.
Anyway good replies and if they are not AI (I don't see ai smell there) thanks for the time you took to write them.
English

I sorry.. your bio says "mostly AI / ML / Quant ramblings from a multiple startup founder CTO guy" so I thought would take the mathemtical approach. But you didn't attack that you attacked me with "Long text with all kinds of intentionally complex concepts and famous company name drops.. and fractional kelly is mentioned again." So as a quant guy and a CTO you can easily use Excel (or Claude in Excel) to do fractional Kelly
Full Kelly maximizes log-expected wealth, but it's derived assuming you know the true edge (μ) and variance (σ²) exactly. In practice you're estimating both, so you're implicitly betting on a noisy Kelly fraction — which systematically over-bets.
Conservative Estimation Approaches
1. Shrinkage / Half-Kelly as a Rule of Thumb
The simplest: use f × 0.5*. This is not arbitrary — it approximately corrects for the fact that estimated edges tend to be optimistic. This is a practical floor.
2. Confidence Interval Kelly
Compute the lower bound of your edge estimate's confidence interval, not the point estimate:
Estimate μ and σ from your sample
Compute the lower 1-sigma or 2-sigma bound on μ
Use f = μ_lower / σ²* instead of μ_hat / σ²
This is sometimes called "pessimistic Kelly" — you're betting as if your edge is at the low end of what the data supports.
3. Bayesian Kelly
Place a prior on (μ, σ²), compute the posterior, then integrate Kelly over the posterior:
f∗=∫μσ2 p(μ,σ2∣data) dμ dσ2f^* = \int \frac{\mu}{\sigma^2} \, p(\mu, \sigma^2 | \text{data}) \, d\mu \, d\sigma^2f∗=∫σ2μp(μ,σ2∣data)dμdσ2
4. The Estimation-Adjusted Formula (Practical)
For a strategy with N observed trades and Sharpe S:
fconservative∗=Sσ⋅(1−1N)f^*_{\text{conservative}} = \frac{S}{\sigma} \cdot \left(1 - \frac{1}{\sqrt{N}}\right)fconservative∗=σS⋅(1−N1)
The correction factor 1 − 1/√N penalizes small sample sizes directly. With 10 trades, you use ~68% of Kelly; with 100, you use ~90%.
The MC approach doesn't replace Kelly — it's a way of sampling from the uncertainty in your edge estimate to get a distribution over f*. The conservative Kelly estimate is essentially what you get when you take the left tail (say 10th–25th percentile) of that MC distribution of f* values.
Anyway, don't really care. Before lashing out with a quick satisfying retort. Go ahead and read Use MC or read Fortune's Formula: The Untold Story of the Scientific Betting System That Beat the Casinos and Wall Street by William Poundstone. and read (or watch as he has great youtube videos) Ole Peters and learn ergodic vs non-ergodic systems. Don't worry, I won't reply to your posts again. My job is done here
English
Long text with all kinds of intentionally complex concepts and famous company name drops.. and fractional kelly is mentioned again.
>Estimate your edge conservatively. Apply a fraction (0.25–0.5) to account for estimation error.
So describe me how exactly do you decide the multiplier that should be used for fractional kelly? And if you have a method for calculating that multiplier, what is the reason to use kelly in the first place?
English
I hate to do a takedown, but for the sake of your 897 followers, you are very wrong. You apparently don't understand that the Monte Carlo method is, by its nature is ergodic while the markets are non-ergodic
The ergodicity problem, precisely stated:
Monte Carlo generates an ensemble average — it samples across meaningful only if the system is ergodic, i.e., if the time average over a single path equals the ensemble average over many parallel paths simultaneously, and reports the distribution. This is only meaningful if the system is ergodic, i.e., if the time average a single path experiences equals the ensemble average across paths.
Markets are non-ergodic. Your portfolio follows a single path over time. Ruin on that path is absorbing, you cannot average across the parallel universes where you didn't go broke. The ensemble average is therefore a fiction you can never personally access.
The profound irony: The Kelly Formula was specifically derived to solve the non-ergodicity problem. Ole Peters makes this explicit — Kelly maximizes the geometric-mean growth rate, which is the time-average, not the ensemble average. Expected value maximization (arithmetic mean) is the ergodic/ensemble quantity. Kelly discards it deliberately in favor of the quantity that actually governs a single sequential path.
Your stated logic : "Kelly assumes fixed constants [partially true] → use MC instead". The correct logic is: MC assumes ergodicity → invalid for sequential wealth accumulation. Kelly corrects for non-ergodicity → structurally appropriate
Yes, Kelly's inputs are uncertain, but that misses that its structural assumption (geometric mean optimization) is more appropriate for non-ergodic sequential processes than anything MC produces. The diagnostic feature isn't input quality; it's the path dependency, and Kelly is the framework built around it.
Ole Peters' formulation makes it explicit:
The difference between the arithmetic and geometric mean return is approximately ½σ². That gap is the non-ergodicity correction. Kelly encodes it. MC ignores it entirely unless you're very careful to simulate sequential ruin, which almost nobody does correctly, and which would just reproduce Kelly's conclusions anyway.
Bottom line: You proposed replacing the non-ergodic tool with the ergodic tool, while criticizing the non-ergodic tool for not being ergodic enough. It's a complete inversion. Kelly isn't a gambling relic, it's the correct response to the very problem you were pointing at.
Even more critiques
You conflate full Kelly with the Kelly framework, that's a critical error. Fractional Kelly (half-Kelly, quarter-Kelly) exists precisely because the inputs are uncertain. The standard practitioner approach is: Estimate your edge conservatively. Apply a fraction (0.25–0.5) to account for estimation error. The result is a robust position sizer that degrades gracefully
Thorp, Renaissance, and serious quant shops use Kelly-based sizing. They're not naive about non-stationarity. The fatal flaw in the MC approach you promoted is that Backtest + Monte Carlo has exactly the same problem, just hidden more opaquely: Your estimated win rate, payout, and edge all come from historical data. This means that the history you sample from may not represent the now or the future. Monte Carlo on stale or overfit backtests gives you a false sense of precision
You haven't eliminated uncertain inputs; you've dressed them up in simulation clothing. The framing problem you presented is "because inputs are uncertain, abandon the framework." But uncertainty about inputs is the argument for conservative fractional Kelly, not abandonment. Every position sizing method needs expected return and risk estimates; Kelly at least makes the sensitivity to those estimates mathematically explicit.
English
Now this *really* was not what I expected at all
Zane Koch@zanehkoch
for a while i've had a slight fear that the bluetooth from my airpods could be frying my brain this weekend i pulled the raw data from a $30m government study of 1,679 mice blasted with cell phone radiation and reanalyzed it what i found was...not what I expected? 🧵
English