mintarion@mintarion
Caution to Short-Sellers: The "Saylor Flywheel" is in Motion
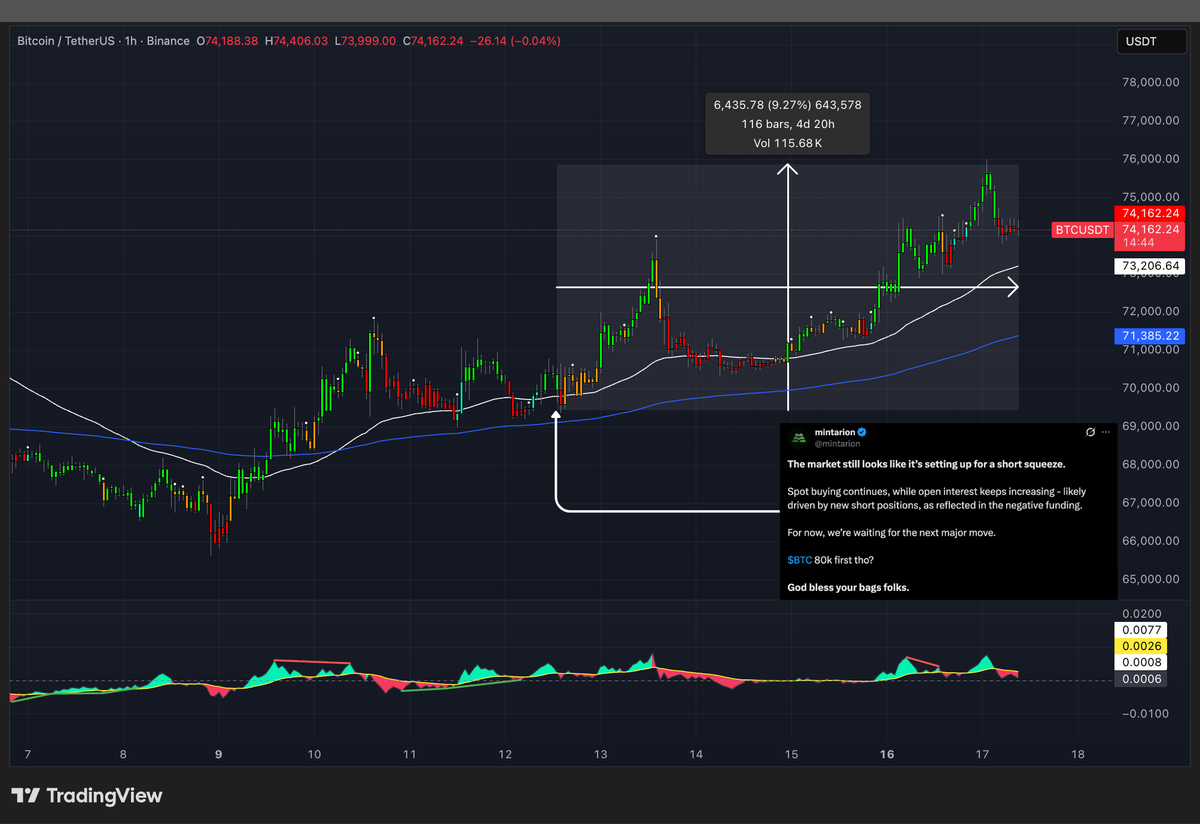
The current market setup suggests that shorting $BTC - especially with high leverage - is a dangerous game right now.
We are seeing a rare alignment of technical indicators and a specific corporate "infinite bid" mechanism that could squeeze bears throughout the week.
The Thesis: Why the Tide is Turning Bullish
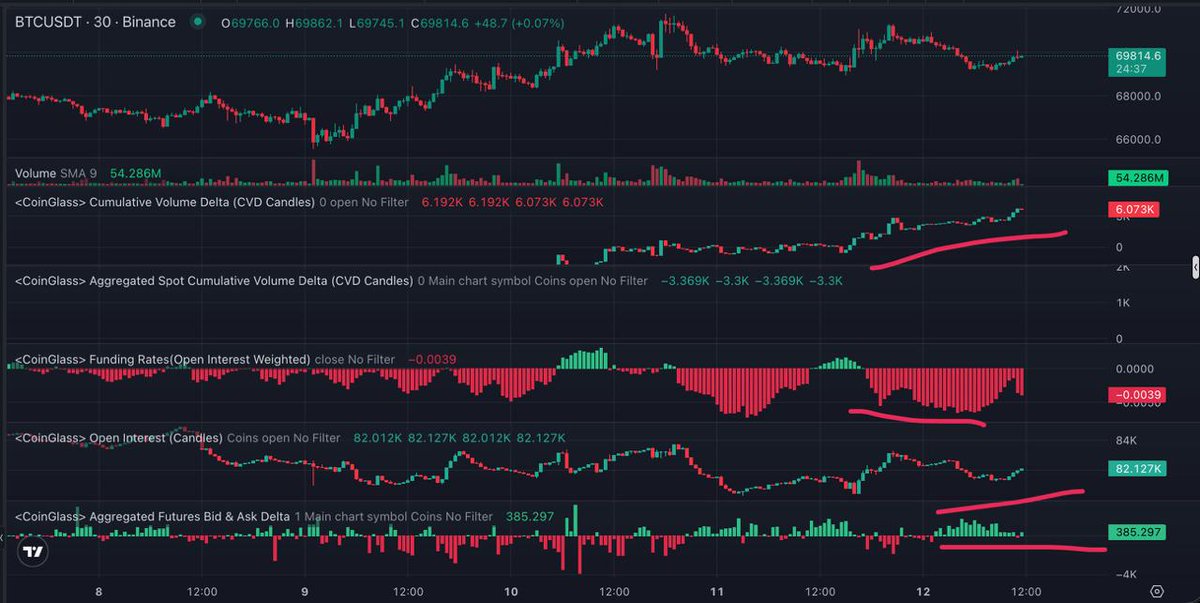
1) Coinbase Premium: Domestic demand in the US is surging, with prices on Coinbase trading higher than global exchanges.
2) Negative Funding: The BTC OI-Weighted Funding Rate is currently -0.0020%. This indicates a crowded short trade; bears are paying bulls to keep their positions open, creating prime conditions for a short squeeze.
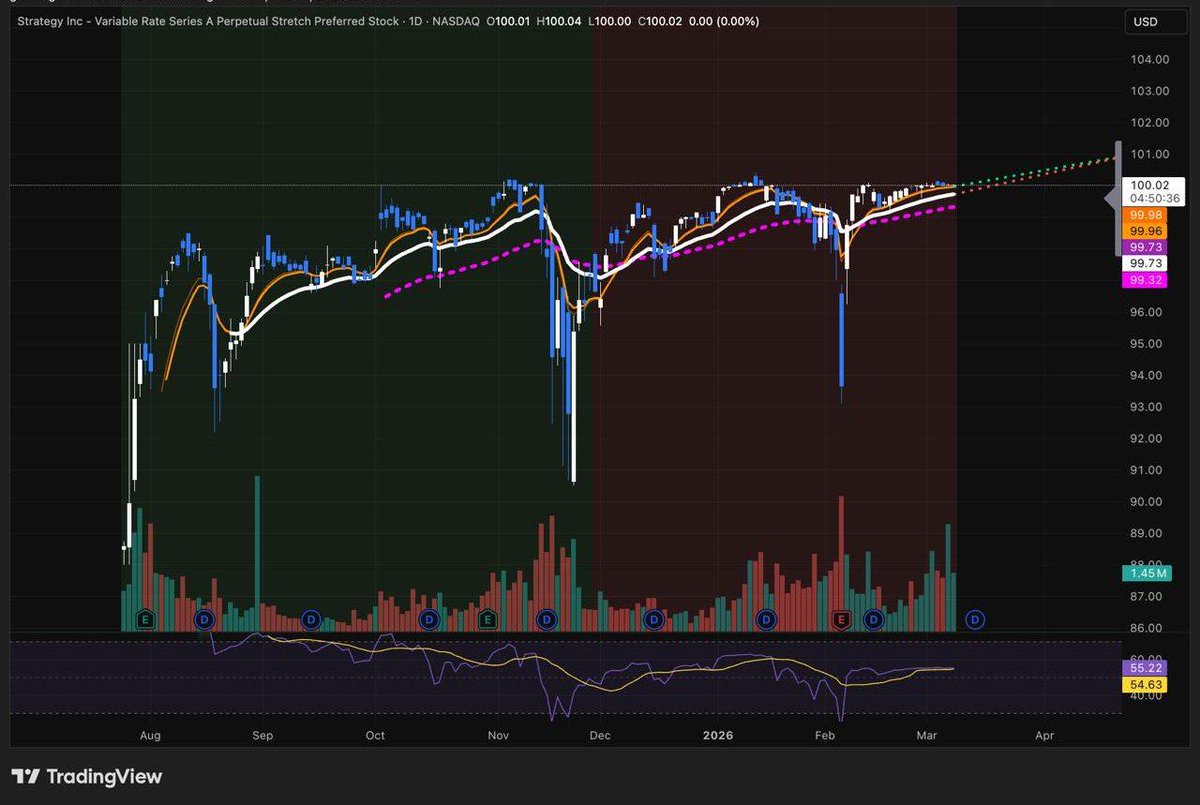
3) STRC Volume Explosion: $STRC saw >$100M in volume within the first hour of trading, signaling massive institutional interest in Michael Saylor’s latest financial vehicle.
4) CRCL Performance: Up 10% today (+120% from the bottom), showing a complete decoupling from traditional commodities and standard risk assets.
Mechanics of the $STRC / $MSTR Flywheel
The synergy between $STRC and MicroStrategy ($MSTR) creates a massive, automated buying force for Bitcoin. Here is how the math breaks down:
STRC Issuance: If $STRC trades above $100, Saylor is obligated to issue additional shares. The cash (USD) from these sales is immediately converted into BTC.
MSTR ATM Sales: To maintain a stable leverage ratio, Saylor sells $MSTR shares via an At-The-Market (ATM) facility. Historically, this volume is roughly double the $STRC placement.
The Multiplier: For every $100M in $STRC trading volume, approximately $40M (40% of volume) is captured for BTC purchases. When you add the $MSTR ATM sales (approx. $80M), every $100M in STRC volume translates to roughly $120M in BTC buy pressure.
The "March 15" Dividend Anchor
A critical factor for this week is the March 15 dividend payment date. Holders of $STRC have a strong financial incentive to hold their positions until this date to capture the yield. This effectively "locks" the price floor for the week, preventing a massive sell-off and allowing the BTC accumulation machine to run at full speed.
Weekly Outlook: A $1.5 Billion Bid?
If we maintain current momentum, the numbers are staggering:
Daily Volume Projection: $250M
Weekly Volume (5 days): $1.25B
Total BTC Buy Pressure: ~$1.5B
Between the negative funding rates and @saylor`s systematic buying, the path of least resistance for $BTC appears to be up.
Be extremely careful with leverage; the "dividend lock" until March 15 makes a sudden dump unlikely.
@saylor @Strategy