mpoola retweetledi
mpoola
8.1K posts

mpoola
@mpush0
Culture. Economy. DeFi. Sustainable development. The Arsenal. Music. Underground. Design. Art. Web3.
Pula, Croatia Katılım Ağustos 2011
897 Takip Edilen347 Takipçiler


English
@Alejandro_XBT IMO there's only 3 scenarios that could nuke BTC that low (taking out previous bear market low):
1. Binance doing an FTX
2. Financial crisis similiar to 08'
3. QC threats becoming a real thing
Do I think it's going to happen? No.
English

I know this sounds extreme, but I expect a -90% move in $BTC before this bear market is over.
This bear market will be one of the hardest ever, and it will likely last longer than previous cycles.
English

@benjamincowen This is not a bear market.
I will keep posting it till you understand ;p
English

Historically, the most ferocious rallies occur in bear markets.
Fun to trade, just don't get caught offsides!
A lot of rallies by BTC in midterm years find resistance in early March.
English
mpoola retweetledi

@PatrikBatCrypto @benjamincowen There's 100x more coins being minted in a single day now than there were in 2017 in total. Not sure why you think 2017 is relevant in this case?
English

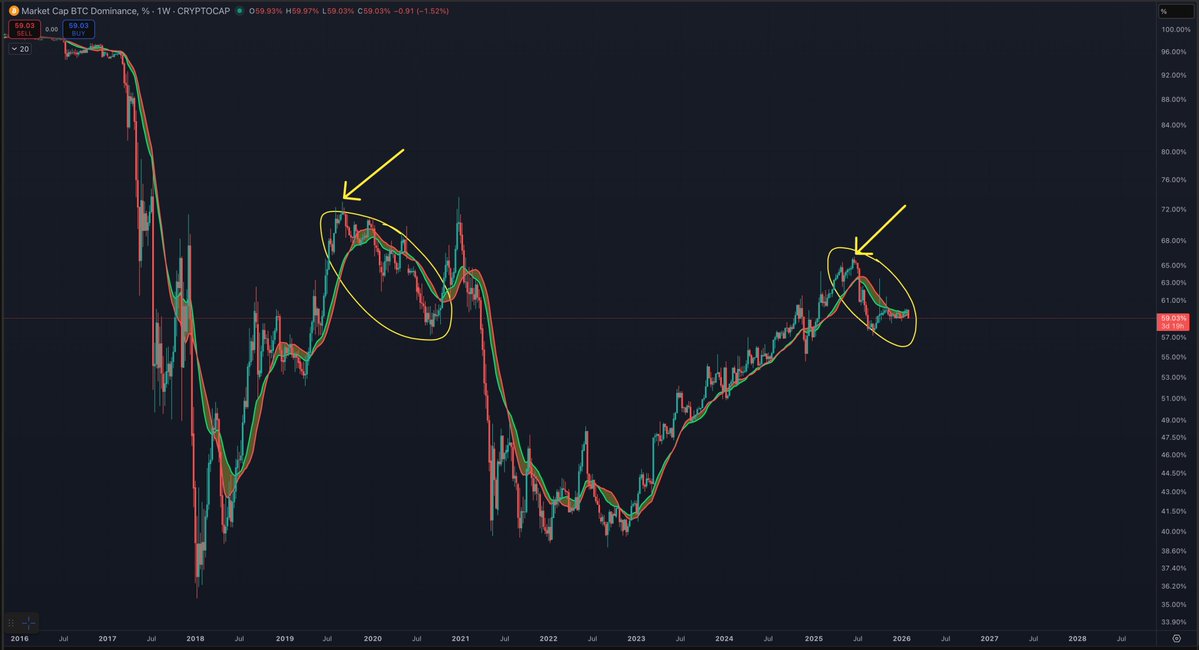
@benjamincowen You're being selective with your data. Let's look at BTC dominance in 2017.
English
In 2019 when BTC dominance dropped, it dropped because BTC was dropping faster than alts.
Why?
Because by the time the bear market started, altcoins had already been annihilated.
Once BTC broke out of the bear market, BTC dominance went back up to the highs.
So I think it feels similar now.
BTC is post-top and after QT ended.
BTC goes down and drags the rest of the market with it.
Good chance this process ends later this year, so stay tuned!
English
May I add that we should be buying with size if BTC drops all the way down to the oversold area on the RSI (weekly)?
Happened only 4 or 5 times historically and every time it marked the bottom of the bear market cycle.
It means you only had 4/5 opportunities since 2014 to buy into an asset that goes up and to the right when it was truly undervalued.
14/15 bear market lows, 18/19 bear market lows, 2020 Covid Crash, 2022 FTX.
English

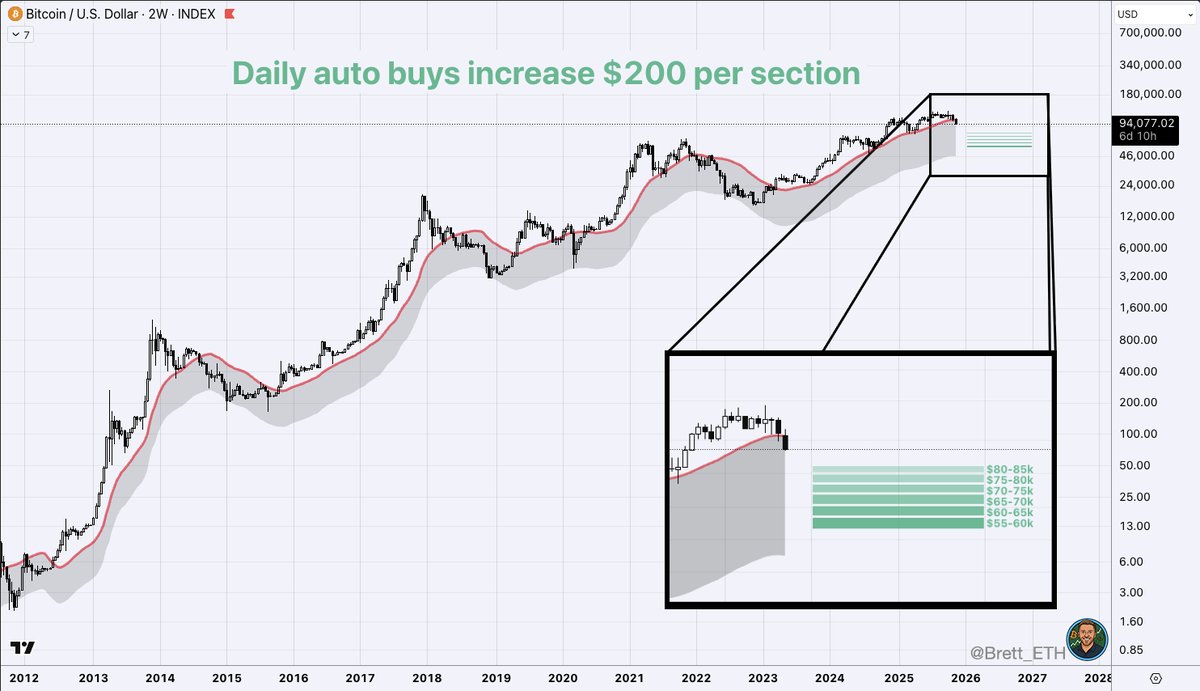
I have limit orders placed between $55-75k (shown in the post below).
However, being a long term bull on Bitcoin, I also have daily auto buys to continue my spot bags growth.
I plan to increase my daily Bitcoin purchase by $200, every $5,000 lower we go, starting at $85k.
For those wondering why I don't just wait for the bottom. Timing the market is insanely challenging. I'd rather just keep buying. I've been in Bitcoin since 2013...buying daily is WAY easier than predicting to unload all the cash at my assumed bottom prediction.
₿rett@brettmacro
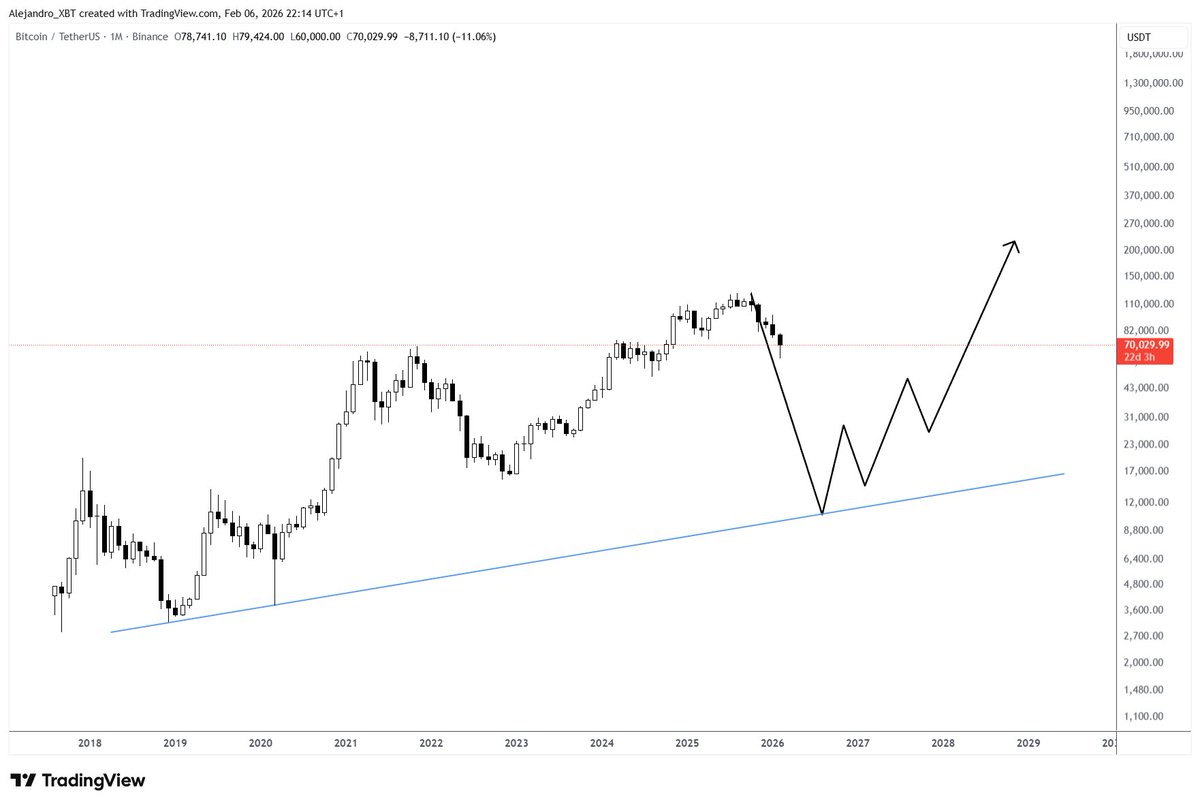
332 days ago, I posted the chart below, showing a Bitcoin peak the week of Oct 6, 2025. So far, it's been spot on. Whether that holds as the ATH, we’ll find out. If BTC starts closing weekly below the 50W MA, odds of the top being in go up. If the 4-year cycle continues to play out, the buy zone between $55K–$75K will be glorious, just a 40–55% drawdown from the highs. I don't think we see as deep of a bear market, thanks to diminishing returns. Could we go lower? Sure. But I’ll be plenty happy filling orders there. Long-term: Bullish. Short-term: Respecting the cycle.
English
Agree. Nobody even knows how much leverage there is in the system and that's a massive problem in itself. We still don't know the exact extent of the damage those 10/10 wicks actually created in terms of liquidity for exchanges. Been following your work for some time now. One of the very few proper technical analysts out there that are not afraid to publicly post and stand by their opinion. I'm curious to know, what's your base case for BTC.D until EOY? I know it doesn't make a lot of sense considering where we are at the moment, but surely we have to be at least flirting with the idea of it rolling over at some point, if we indeed have a confirmed cycle top on BTC?
English

I keep hearing people saying "this time is different" because "the institutions" or "the ETFs"
The market won't see another normal bear market, the 4-year cycle is over, it'll just be a slow grind up.
Yet there has been 0 proof of this. Y'all acting like these "institutions" arent also just run by normal ass people.
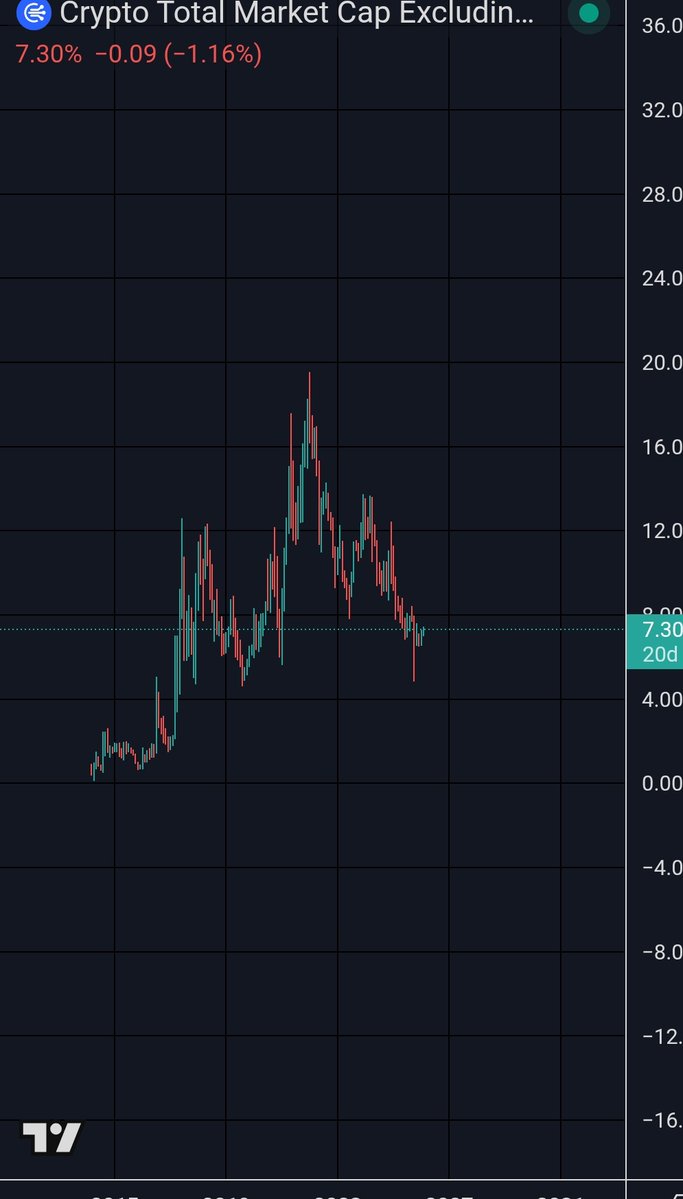
Meanwhile the market is still highly leveraged. Even after 10/10, there's still as much open interest on $BTC as during the initial massive run to 100K.
If we add alts to the mix there's a solid $56 BILLION in open interest, still 5x higher than the 2020-2021 bull run.
We expect this number to increase over time, but it goes to show that there's plenty of leverage in the system to take prices down low, and to do it quickly if it so desires.
Finally, we see this reflected in the liquidation maps as well. A consistent wall liquidation
We can go up, and if the chart offers good long opportunities, I'll be the first to take them.
But lets not fool ourselves into thinking bear markets are a thing of the past.


English
Been following you for years now. I've got a lot to thank you for introducing me to DeFi. One of the very few people I follow on this platform that have actually been useful to me on my crypto journey. Ben Cowen being the other one. Congratulations and many thanks from a fellow economist from Croatia!
English

Was looking for a way to combine my love of speaking with economics. Picked the fastest growing niche of economics (DeFi) to start making videos.
My DeFi tutorial videos took off in 2021.
Terra crashed. Rejected from every full-time job in the industry I applied to, so I started posting my analysis of onchain metrics everyday to build credibility.
Continued posting analysis and video tutorials consistently for a couple years. Created a large DeFi newsletter, grew YouTube to over 50K subscribers.
Eventually @DefiLlama wanted to bring on someone to do marketing and sales. Since I had been publicly using the platform for years and already created many of the most viewed guides for their platform, I was offered the role.
Afolabi Sokeye 🧱@SokeyeA
What’s the lore behind choosing your career path ?
English
@kingpickle I feel you buddy. Will never forget the Otherside mint day. Called my mom to tell her I just minted a Koda and we're gonna make it. Oh, well...
English
@kingpickle Love Otherside and everything Yuga has built over the past few years but if you were "trying to explain to people why they should buy NFTs 4 years ago" and you actually managed to convince them to spend thousands of dollars on it, they likely hate you right now.
English

The OtherSide Nexus is so dope.
I remember very clearly trying to explain to people why they should buy NFTs 4 years ago.
“Imagine Ready Player One, where your identity is digital. You own your avatar. You own your weapons. And all of your friends and family hang out in mystical, magical worlds all day, where you don’t even know you’re transacting on crypto rails. Where literally anything is possible”.
Sounded like complete whackadoo shit, we would say to try to convince ourselves JPGs had some value.
And yet, here we are. Just a short 4 years later. With the @OthersideMeta Nexus very much embodying everything all of us World of Warcraft nerds could have ever dreamed of 😍
This is the prophecy unfolding before our very eyes. Pay attention. Let’s celebrate a huge first step. Congrats to the entire team and community who spent years taking us all into the future 🎉
@yugalabs // @BoredApeYC // @OthersideMeta @apecoin // @ApeChainHUB
English
@guccheetah @OthersideMeta I've seen some deluded takes on this platform before but this has to go to a hall of fame.
English

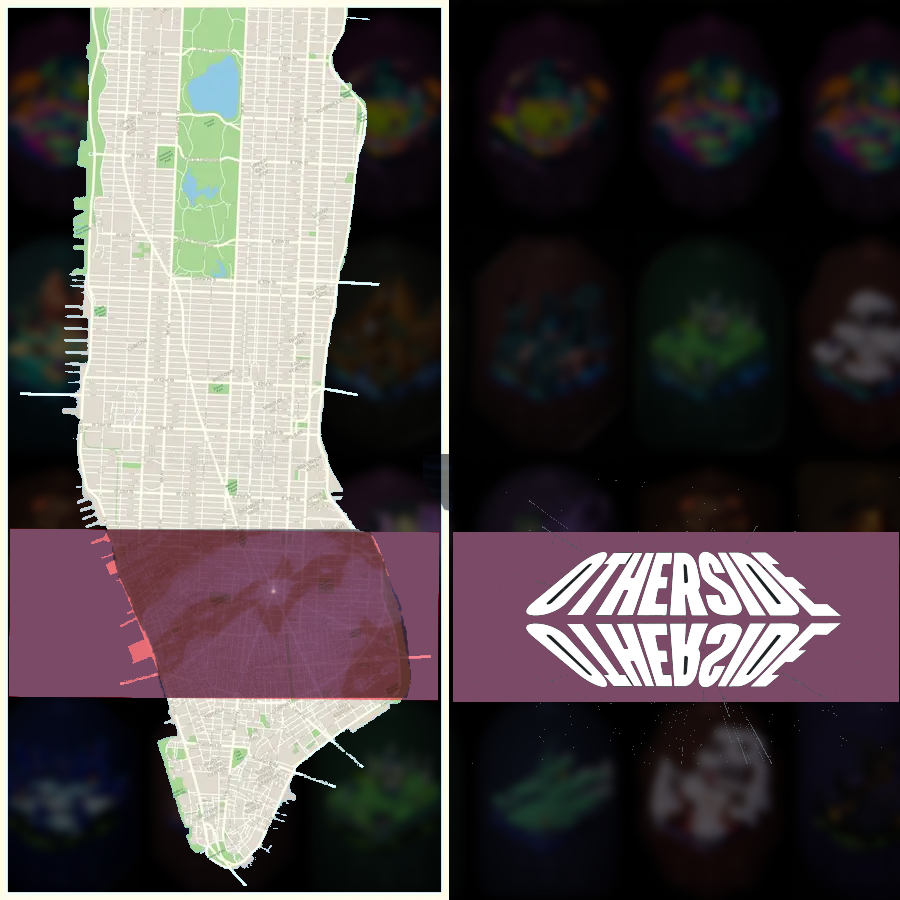
Think 100,000 Otherdeeds is a lot?
Consider this:
According to Manhattan property records, the borough has around 1,000,000 residential units.
That means the entire Otherdeed supply is less than 10% of Manhattan.
Owning 1 Deed is like owning 10 NYC condos.
@OthersideMeta is the NYC of the Metaverse.
Nexus shows you everything you need to see.
Plant your flag in the center of the digital world.
English
@Sykodelic_ Been watching this chart for years. Since you're at it, you probably know where Ben Cowen thinks this goes. Could this be the thing that he gets wrong?
English

Alts are holding super strong.
Against BTC, Alts have broken the HTF and LTF trend are are impulsing higher.
This isn't my opinion, this is the TOTAL3/BTC chart.
And this is NOT what happens when everything is all over.
You can see in the original tweet to this I shared the HTF view, and Alts have clearly bottomed against BTC.
This does not signify its over.
It signifies that:
1. BTC is being pushed further down that it should be
2. Alts have started their period of outperformance against BTC.
Again, this is not my opinion, this is simply what the chart says.

Sykodelic 🔪@Sykodelic_
Altcoins are insanely bullish here. But the timeline would have you believe the total opposite. Which sets up the perfect conditions for what comes next. Altcoin expansion. The disbelief and resignation to doom has never been greater. Almost all will disagree with this, but the upside potential here is as great as it will ever be. And this chart right here, TOTAL3/BTC, shows us absolutely everything we need to know. This is not my opinion guys... this is an objective chart that any of you can go and look at yourself. So what have we got here? As you can see I have noted that within the last cycle, TOTAL3/BTC was in a downtrend for 1,092 days... Then just as everyone capitulated, it giga fucking pumped for months on end. This cycle it has now been in a downtrend for 1,085 days... In addition, it has just about finished printing a reverse head and shoulders. Guys... It doesn't get more bullish. Yes, the vast majority of alts have been down only or sideways, but that is my very point. Altcoins are not bearish because they haven't moved... that makes them bullish(because they have so much room TO move). Altcoins would bearish if this chart had been breaking out and up only for months, like it did in 2021, and then broke structure just like I have circled in red on the chart. That is what would be classed as bearish. Because after that kind of expansion comes the contraction. That is when you should be worried. But how can they be bearish if they have not even expanded in general yet, or against BTC? The cold hard fact here that almost no one seems to understand is that nothing about the overall market setup screams top. As well as this chart we have: - Both BTC and ETH holding HTF structure - TOTAL, TOTAL2 and TOTAL3 coiling upwards - USDT.D holding bearish HTF - BTC.D at 60% completing bearish retest - ETH/BTC highly bullish All of this is coming together at the exact time that we are entering the highest probability for a market bottom. Go figure...
English


In your opinion what is the biggest threat to humanity

English
@ADLFC0 @AFC_Monty_ "Major European trophy" - Wonder if it would be called that way if Arsenal won it in 2019.
English

@AFC_Monty_ Arsenal have 1 FA cup in 6 years, spurs have won a major European trophy before you lot. No idea why your fanbase has this big ego, you barely win anything.
English
Gyokeres always scores against relegation teams. Careful what you wish for 17th.
☔️🫧☔️ #22 out@Sp1thfc
Start #14 please. I’d appreciate it
English
@X10Gill @ZssBecker Technically he was not wrong. Every time he said it, prices went down like 20% or 30% on the very next day so it was indeed the last time we've seen those prices. Credit where credit is due.
English

@ZssBecker 🤣🤣🤣 dude been saying last chance to buy at these prices for 3 years lmao
English

There should be a bull market.
Any day now.
Itsa coming
Just a big ol matter o time
*checks watch*…yeahh
English

Trump making bottom on memes?
$TRUMP $BERT
Commentary Donald J. Trump Posts From Truth Social@TrumpDailyPosts
English

@DeFiXpace @Ballsyone @ZssBecker If this is your 2nd cycle and you still feel the need to look for advice from influencers and clowns like him, I'm sorry to tell you mate, but you're doing something wrong.
English

@Ballsyone @ZssBecker This is my second cycle. Becker has been here for over 3 cycles, so He knows better.
English
2026 is going to be the biggest bull in crypto history and it’s kind of obvious.
English