
Tahr40
25 posts

Final US Open giveaway.
You get this duffle bag, my US open credentials, a pair of my Footjoy premier shoes that I’ll sign (worn during my titleist shoot)
Winner is first person to guess my locker number this week. 1-200
No cheating!
Some of you asked insiders to look my locker number up 😂

English

3 things separate good vs. bad financial modeling.
But the difference is enormous.
Like & comment if you want the excel.
7 points:
*1) Model setup*
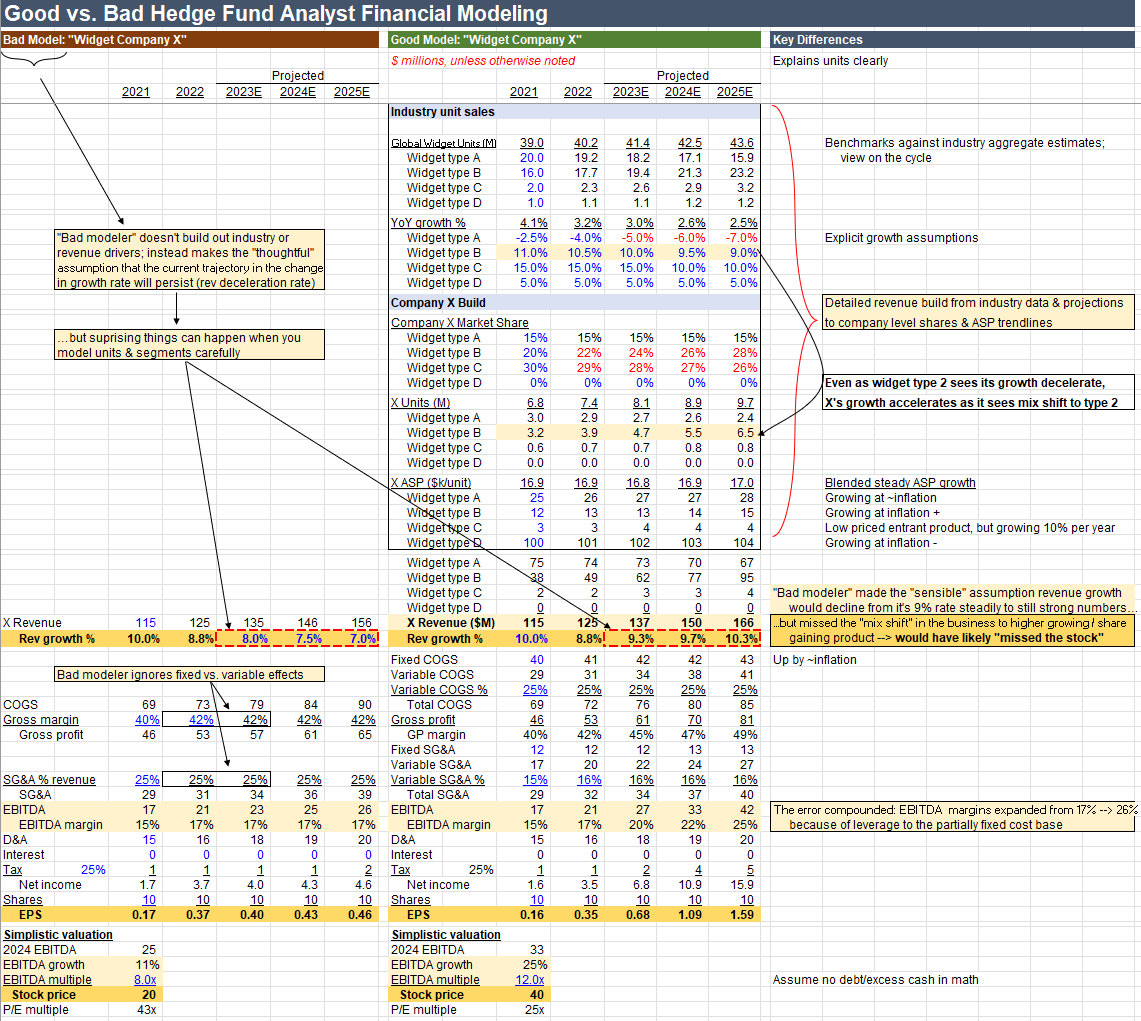
The attached shows "bad modeler" on the left vs. "good modeler" on the right.
Of "Widget Company X".
With 4 business lines, competing in the global widget market.
*2) Company X's position*
X's largest, fastest growing line is 'type B' widgets.
It also sells the other types.
But the market views X as a 'type B widget company'.
And models it accordingly.
*3) Bad Revenue Modeling*
Bad modeler sees X's exposure to type B.
And notices that type B growth is decelerating.
So makes a 'rational' but simplifying assumption:
That X's overall growth will decelerate.
At a similar pace as its main product.
*4) Good Revenue Modeling*
Good modeler builds revenue from its components:
Industry units, unit growth, ASPs, market shares.
And as a result.
Sees something bad modeler missed:
Despite slowing type B growth.
And because X has other large lines that are slower/declining.
That X is undergoing a very positive "mix shift" to higher growing lines.
Meaning:
Its underlying revenue base is increasingly exposed to higher growth.
Changing the overall profile of X's business.
*5) Impact*
The difference may seem subtle.
But the impact is large.
Because this underlying mix shift.
Causes total X growth to reaccelerate from 8.8% to 10.3% over time.
vs. bad modeler declining from 8.8% to 7.0%.
*6) Second order effects*
And maybe surprisingly.
The difference betwen those two outcomes on multiples.
And therefore stock prices.
Is massive.
The market will view accelerating topline growth as deserving a much higher multiple.
Than a decelerating topline.
This assumes 8x EBITDA in the decelerating case, and 12x in the accelerating.
But the reality will vary with context.
*7) Compounding errors*
Bad modeler assumed COGS / SG&A at a fixed % of revenue.
Producing a flat 17% margin.
Whereas good broke out fixed vs. variable.
And showed that in its scenario.
Margins pick up from 17% to 25%.
Even more impactful to EPS:
Which for bad modeler ended at $0.5.
vs. $1.6 for good modeler.
A huge 3.5x delta.
The takeaway is that good vs. bad modeling can look subtle.
And sometimes - frustratingly - good modeling yields no more insight than bad.
But if your hope is to catch structural shifts.
And big moves.
The reality is that the market has already built the basic model.
And made the 'thoughtful' high level assumptions.
So if you want to find differentiated theses.
And generate differentiated results.
You have to find the nuanced growth reacceleration.
Or the misunderstood cost structure.
Or sub-market share gain.
Because without that.
Even if you 'get' the industry.
And have some right answers.
Over time.
You'll end up tracking the market.
And never leading it.
That's all for now.
Like & comment if you want the excel.
English
If you don't understand credit & distressed debt, you don't understand markets.
Particularly today.
Like & comment if you want the excel.
6 topics, from simplest --> most complex:
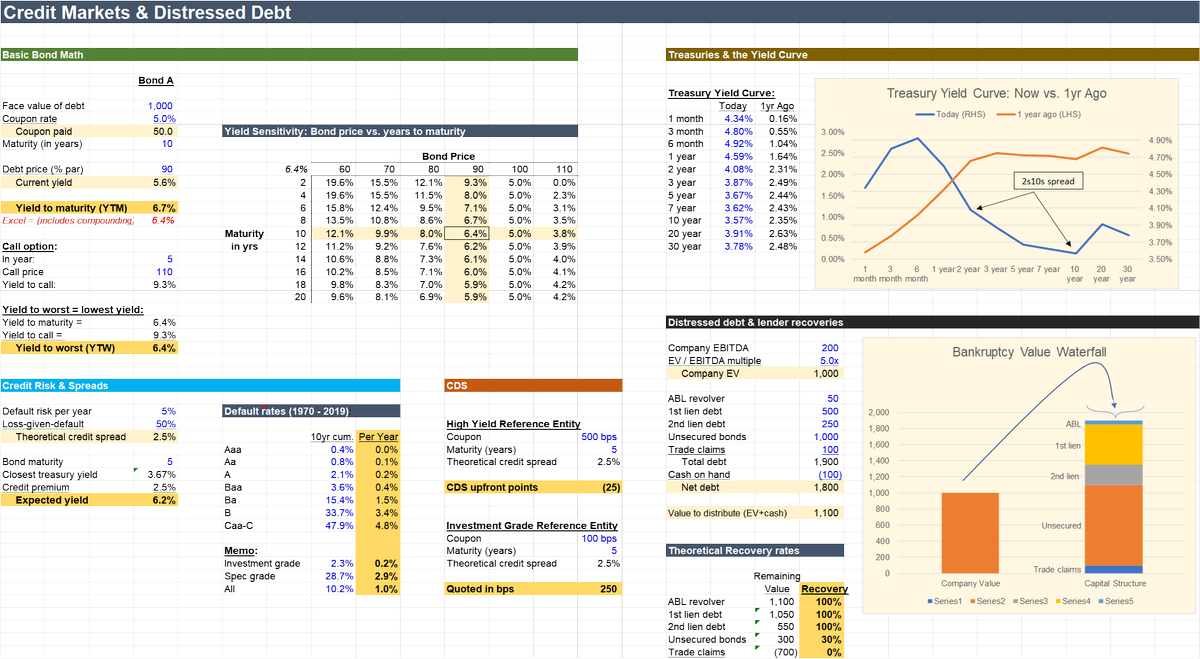
*1) Bond math 101: Yields & prices*
Basic bond math attached.
Yield is the IRR of buying a bond at market, assuming no default.
Sensitivity shows yields vs. price & maturity
If yield rises, the price falls.
All things equal, longer maturities mean lower yields (if price is below par).
*2) Bond math 201: Yield to worst*
Many bonds have a "call feature."
Meaning:
The borrower can pay the bond back before it's due.
To get out early, the borrower usually pays a premium.
E.g. they can repay at year 5 if they return 110% of par.
But this makes calculating yield complicated.
Will they exercise this call? Which date/price to use?
The bond market has a simple convention: "yield to worst."
Which means: pick the the 'worst case scenario' to the lender.
In math: run the yield to maturity, run the yield to the first call.
And pick the lowest.
For sophisticated investors, the most accurate yield to refer to is the "yield to worst."
*3) Treasuries & the yield curve*
US Treasury rates form the basis for all other debt.
Which is priced at this "risk free rate" plus a spread for its credit risk.
In most markets, the yield curve slopes upward:
Long term rates exceed short rates.
But today we are in the less-common "inverted yield curve," which the market interprets as a bearish indicator.
Simplifying: the Fed is tighting, but the market expects it to ease and inflation to slow.
*4) Credit risk*
Credit risk is priced on top of Treasuries to calc the "correct" yield of a bond.
The math is simple:
The probability the company doesn't pay back ("probability of default") per year.
Multiplied by:
How much money you'll lose in that case ("loss given default").
Average default rates by credit rating for the past 50 years in the attached.
*5) Distressed debt*
Recoveries in a bankruptcy are a function of the enterprise value of the company, and paying out that value creditors in order of their legal priority in a direct "waterfall."
This is the theory, but the real world of distressed becomes messy as competing opinions on value, uncertainties in the relative priorities, competing creditor interests, and shifting business dynamics make that "distribution of value" much more complex than a simple waterfall.
But that's also what makes it interesting.
*6) CDS markets*
CDS math attached.
Key is that CDS is the inverse of the bond math above, with no bond face value and therefore no risk free rate in the 'yield.'
CDOs/CLOs/CDX discussion for another time.
Many more nuances in each of these.
But it's a start.
As in every area, you need a strong grasp of the core principles.
Without that, you have no hope of matering the nuances.
That's all for now.
Like & comment if you want the excel.
English
Tahr40 retweetledi

This PDF will teach you more than an MBA.
It will even make you smarter than most fund managers.
10.000 (!) pages full of investing wisdom from Warren Buffett, Terry Smith, Howard Marks and many more.
To receive it:
1️⃣ Follow us
2️⃣ Retweet this tweet
3️⃣ Reply 👋 below
English
Tahr40 retweetledi

gm
to celebrate 30,000 followers and our pro-shop launch, we’re giving away FOUR @Callaway Rogue drivers.
follow, like, and RT to enter ⛳️ 🏌️♂️

English
Tahr40 retweetledi

Leclerc's eyes were darting all over his rear-view mirrors! 👀
Incredible footage from the Ferrari driver's battle with Verstappen 😵
#BahrainGP #F1
English
Tahr40 retweetledi

When a new current thing materializes, most adherents of the previous thing bridge cleanly without a second thought, but some don't -- they wander around the cultural landscape like spectral wraiths still gripping the previous thing, moaning softly.
English

Let me know in the comments below:
A.) will you comply with new Covid mandates if they reintroduce them?
B.) Will you get any other shots/boosters they shill at this point?
English

Tahr40 retweetledi

There is reportedly a Ukrainian fighter pilot who has taken out 6 Russian jets in air to air combat. He is being called the "Ghost of Kyiv"
English
Tahr40 retweetledi


Tahr40 retweetledi

Just noticed that this amazing collection @GirliesNFT is blowing UP.
Glad I got in early
Thxx again @BenjaminBitcoin for the tip 👑👑
#GirliesNFT


English
Tahr40 retweetledi

Happy to recommend #nft number 2 to the homie. Guys love @GirliesNFT #Girlies #MenSupportingWomen #MrGuyGirlieDude
Tahr40@mrguy40
English

Tahr40 retweetledi

🚨GIRLIES GIVEAWAY🚨
🐥Let's get to 10k followers! We're gifting girlie #9935 😍🍄
How to participate:
1️⃣ Follow @GirliesNFT
2️⃣ Like and Retweet
3️⃣ Tag a friend in the comments (one comment only)
Random drawing at 10,000 followers!
#WomeninNFT #WomenInCrypto

English
Tahr40 retweetledi

Continuing with how crazy big are South American countries:
🇧🇷Brazil’s coast measured in Californias 🤯

English
Tahr40 retweetledi
