Sabitlenmiş Tweet
nate4slv
2.7K posts


nate4slv
@nate4slv
Web3, CPA, Stern MBA. Gold, Silver & Market Insights. $GAU. $SGOV. My opinions NFA. No affiliation.
Katılım Ekim 2017
384 Takip Edilen256 Takipçiler
Yes, there has been recent softness in gold. The volatility is not anything significant to reconsider its role as a safe haven asset.
The speculative fervor of the last 5-6 years left gold and silver significantly undervalued.
We are below fair value now. Many miners more so.
English
nate4slv retweetledi

This is rapidly becoming one of the most pronounced stagflationary environments in decades.
Inflation is accelerating while growth is rolling over sharply.
That leaves the Fed in a real bind.
At these levels of debt, you either save growth or kill inflation.
Policymakers will choose the former — because they can’t afford the latter.
tavicosta.substack.com/p/stagflation-…

English
nate4slv retweetledi

In the early months of the 2008 GFC, gold crashed 32%, about 40% of its prior bull-market gain. After gold bottomed, it surged 178% over the next three years. Gold nearly hit $4,100 today, down 27%, about 40% of its gain since $2K. A 178% surge from that low puts gold at $11,400.
English
nate4slv retweetledi
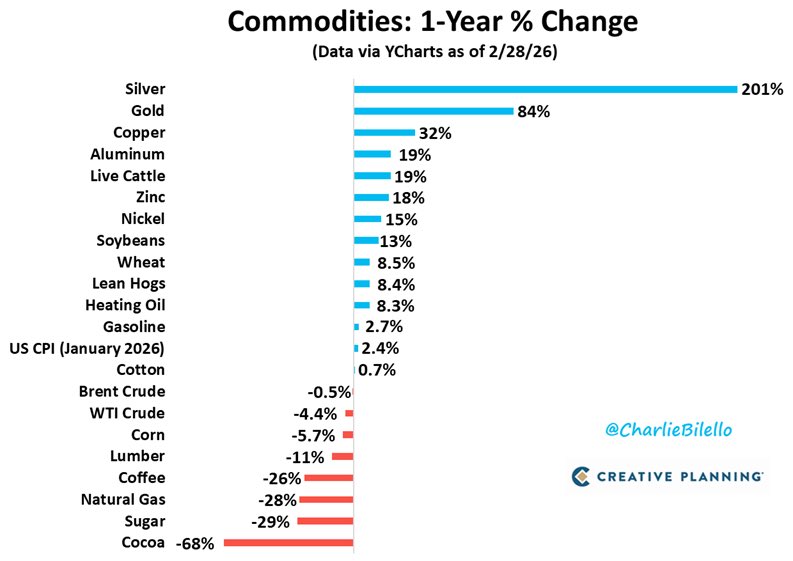
Important observation:
Don’t underestimate underperforming resources, they often are the next ones to move.
When energy prices inflect, agricultural commodities tend to follow.
Also, keep in mind that commodity cycles are inherently rotational.
Agricultural commodities are a broad space, but in this piece I focus specifically on one of those ideas:
open.substack.com/pub/tavicosta/…
English
nate4slv retweetledi
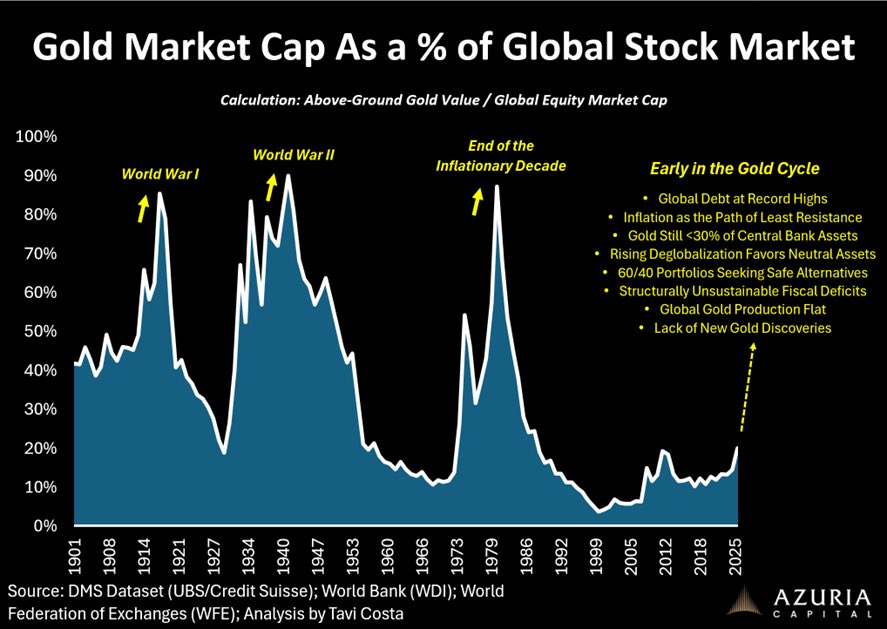
A reminder that periods of extreme debt consistently breed geopolitical tension and conflict.
This is a recurring historical pattern.
Through that lens, deglobalization is not a transitory phase driven by headlines, but a structural shift unfolding in real time.
In this kind of environment, politically neutral hard assets move from being tactical exposures to becoming core portfolio allocations.
I expand on this further in this piece:
open.substack.com/pub/tavicosta/…
English
nate4slv retweetledi

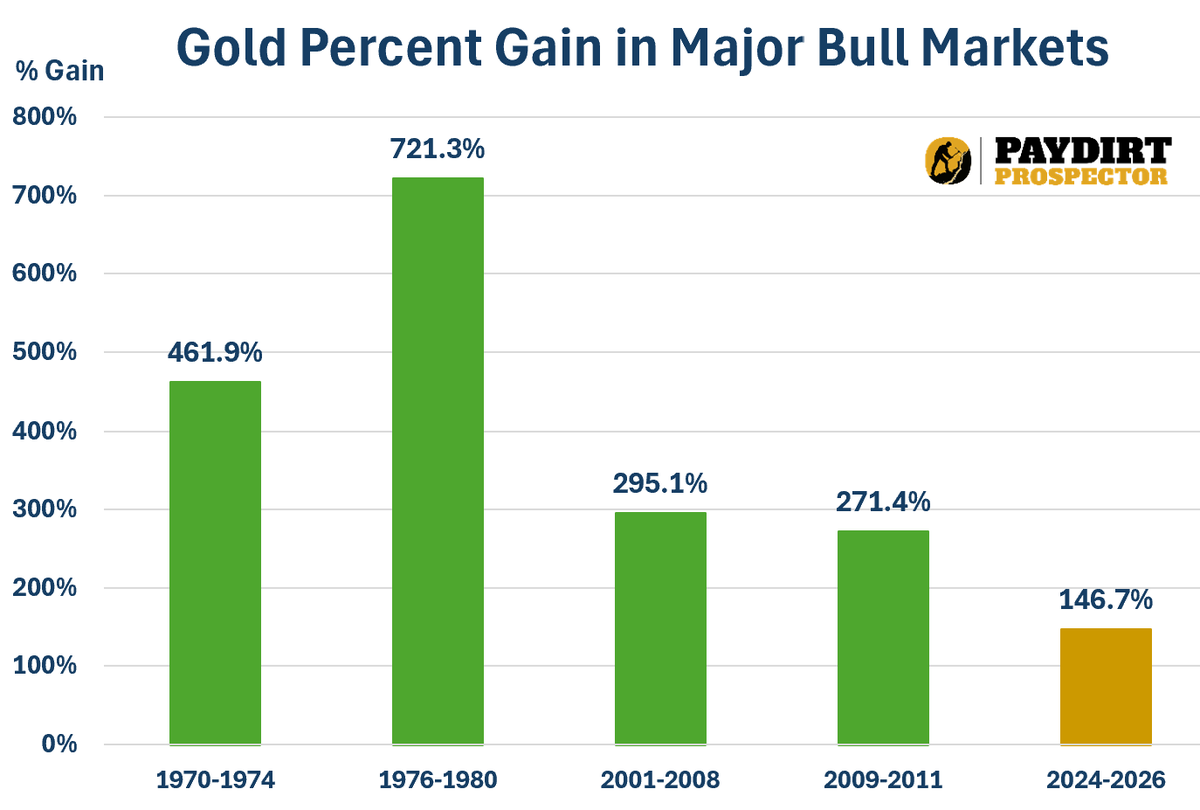
I showed yesterday the duration of major #gold bull markets and that the current one is the shortest on record—it would also be the lowest percent gain, more evidence we've go a long way to go...
English
nate4slv retweetledi
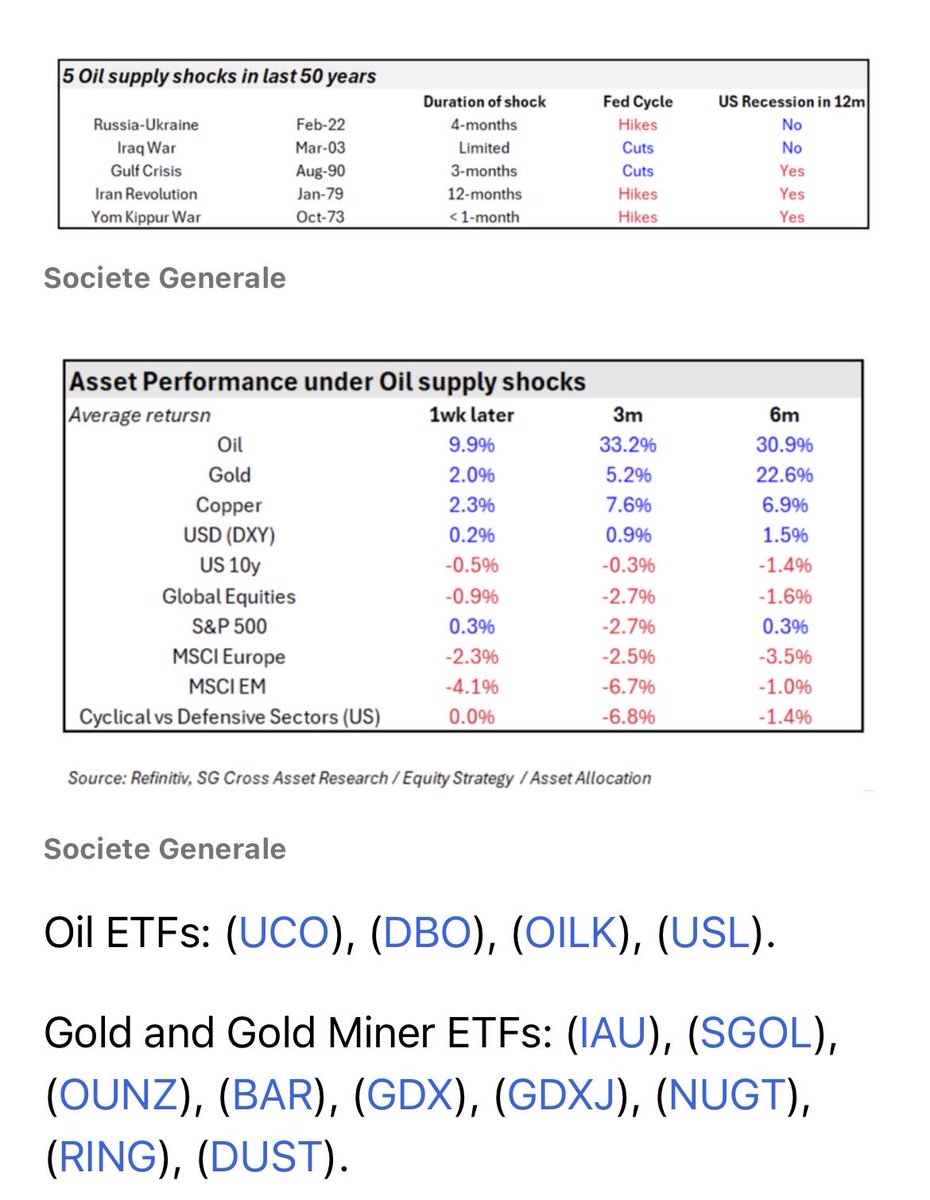
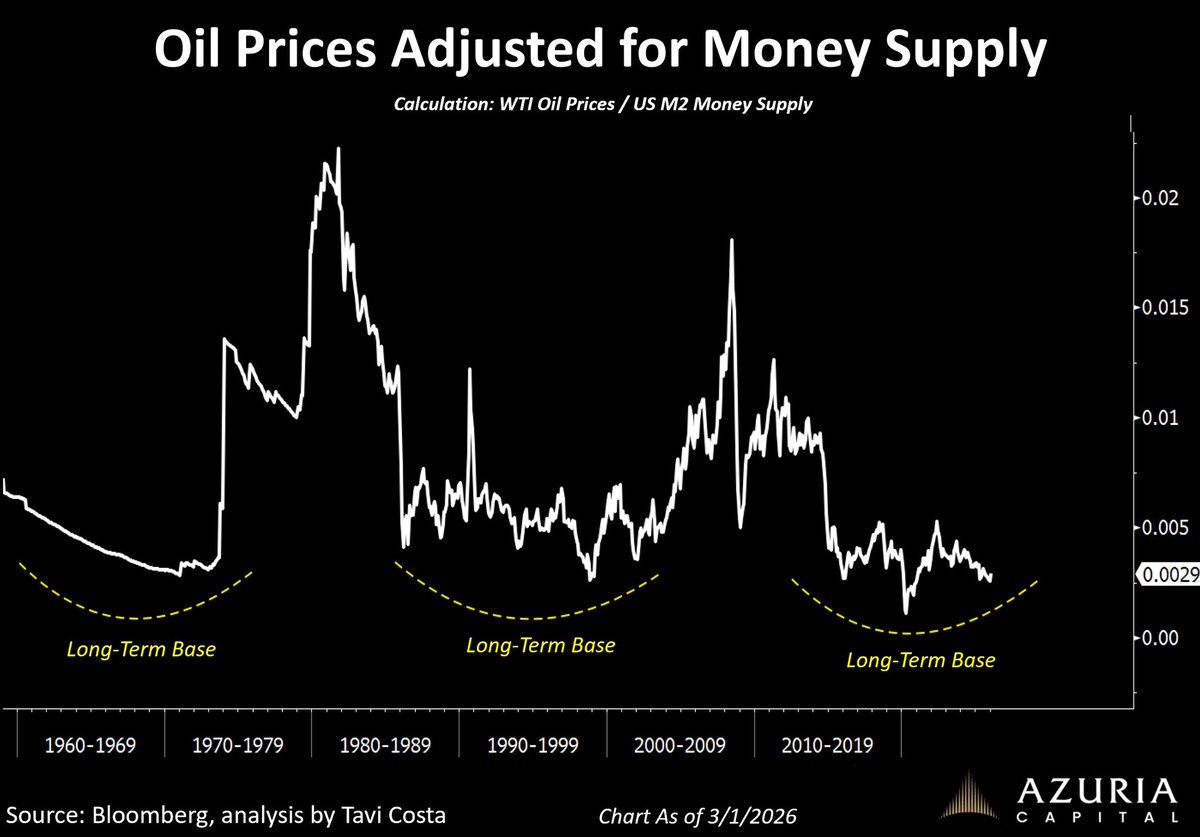
Oil prices, when adjusted for money supply, appear to be building a significant long-term base.
Despite that, many continue to frame energy as a short-term geopolitical trade driven by headlines.
Not my view.
open.substack.com/pub/tavicosta/…
English
nate4slv retweetledi


nate4slv retweetledi

Ray Dalio just released 500 years of data showing exactly how empires collapse.
His conclusion? America is in Stage 6 of 9.
The dangerous stage.
Here's what his math actually says about where we're headed:
Dalio studied every major empire collapse since 1500.
Dutch. British. American.
The pattern repeats with machine-like precision every 50-100 years.
Not because of politics or ideology.
Because of math.
The "Big Debt Cycle" has nine stages.
We're currently in Stage 6.
The dangerous one.
Here's how it works:
Stages 1-4: The Rise
Countries borrow to build infrastructure.
Debt is productive. GDP grows faster than debt service costs.
Everything feels sustainable.
This was the U.S. from 1945-2000.
Low debt-to-GDP. Strong productivity growth.
Borrowing made sense.
Stage 5: The Top
Debt service hits 15-20% of GDP.
Interest costs start crowding out productive spending.
But everyone's too comfortable to notice.
Markets boom. Wealth gaps explode.
The U.S. crossed this threshold around 2008.
Stage 6: The Crisis
This is where we are now.
Federal debt exceeds 120% of GDP.
Two choices: Let interest rates rise and crash the economy.
Or print money and create inflation.
Both destroy wealth.
Just differently.
In the 1930s, we chose deflation.
In 2008, we chose money printing.
In 2026, we're doing both at the same time.
Stages 7-9: The Reset
Either massive restructuring through negotiation.
Or war.
History shows wars resolve 90% of these cycles.
Not because humans are violent.
Because debts become mathematically impossible to service.
Dalio's data is clear:
When internal inequality peaks AND external rivals emerge, conflicts become inevitable.
The U.S. has both right now.
Wealth inequality hasn't been this high since 1929.
China's GDP grew 6-8% annually while we borrowed to maintain consumption.
Dalio's advice for Stage 6 is simple:
Sell debt. Buy gold.
Not because gold produces anything.
Because governments print money to escape debt traps.
Gold has risen 3x since 2020.
Exactly as the model predicted.
But here's what actually matters for regular investors:
You can't stop the Big Cycle.
But you can position for it.
Dalio's framework identifies five big forces that drive every transition:
1. Productivity growth
2. Debt cycles
3. Money supply
4. Wealth gaps
5. Geopolitical power shifts
When all five align in the same direction, the cycle turns.
Right now, all five are pointing toward Stage 7.
Productivity growth is slowing.
Debt service costs are rising faster than GDP.
Money supply expanded 40% since 2020.
Wealth concentration is at century highs.
China is building parallel financial infrastructure.
The math doesn't lie.
So what does positioning actually look like?
Dalio's research across 500 years shows three consistent patterns:
Pattern 1: Fiat currencies lose value during Stage 6-7 transitions
Every time. No exceptions.
Governments print to escape debt traps.
The dollar, pound, and euro all follow the same path.
This is why gold and hard assets outperform during these periods.
Pattern 2: Geographic diversification matters more than asset class diversification
When one empire declines, another rises.
Dutch to British. British to American.
The cycle doesn't end. It relocates.
Portfolios concentrated in declining empires get crushed.
Pattern 3: Volatility spikes 3-5x during Stage 6
The 1930s saw 50%+ market swings.
The 1970s stagflation created wild inflation volatility.
2008-2009 saw daily 5% moves.
Stage 6 isn't calm. It's chaos punctuated by brief stability.
Here's the data that should terrify you:
U.S. debt-to-GDP: 120% (highest since WWII)
Annual interest costs: approaching $1 trillion
China's GDP growth: 6-8% while U.S. averages 2-3%
Time between 1929 inequality peak and crash: 8 months
Time since current inequality peak: We're in it now
English
nate4slv retweetledi

Globalization has FAILED.
Secretary Lutnick at the World Economic Forum:
“The Trump Administration and I are here to make a very clear point—globalization has failed the West and the United States of America. It’s a failed policy… and it has left America behind.”
America is done exporting jobs and offshoring its future. We will no longer give in to globalization.
English
nate4slv retweetledi
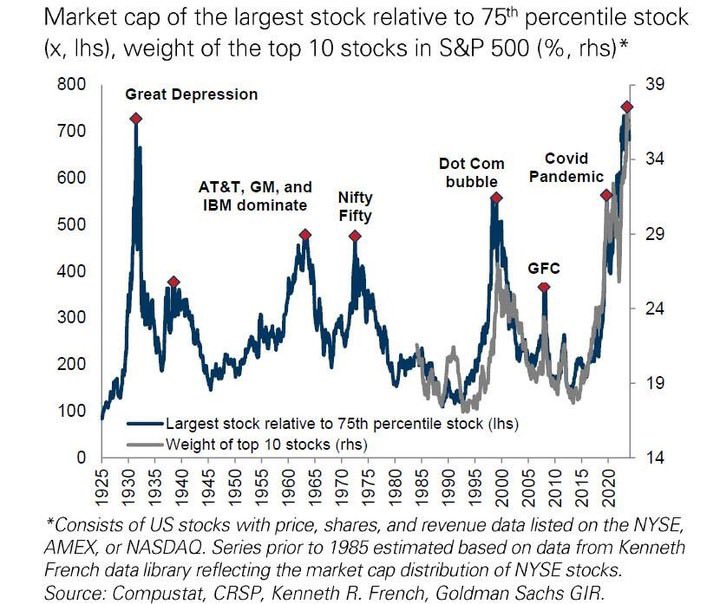
History is doing what it always does.
When a handful of mega-cap stocks account for an outsized share of index performance, fragility builds beneath the surface.
That kind of concentration is not a feature of durable bull markets.
And don’t forget:
US equities versus the rest of the world remain near extreme levels of dominance.
That imbalance hasn’t even begun to fully unwind.
At every peak, investors invent sophisticated explanations for why old rules no longer apply.
It never ends well.
When positioning is one-sided, it doesn’t take much to trigger rotation.
For me, the real question isn’t what just peaked — it’s where capital flows next.
I’m focused on the areas that remain under-owned, capital-starved, and structurally mispriced:
Emerging markets.
Metals and mining.
Energy.
Commodities.
Regime shifts are uncomfortable and volatile in real time — which is exactly why they create the biggest opportunities.
English
nate4slv retweetledi

Metals trading activity in China is skyrocketing:
Combined trading volume in aluminium, copper, nickel, and tin futures on the Shanghai Futures Exchange jumped +86% MoM in January, to 78 million lots, the most in at least a year.
This is 5 TIMES the average monthly volume seen in the first 11 months of 2025.
The surge was particularly driven by nickel contracts, which traded 30 million lots last month, +300% more than in December.
Furthermore, tin volumes recently exceeded 1 million metric tons on a single day, more than twice the entire world's annual physical usage of the metal.
A wave of Chinese retail speculation was behind this rise, with metals becoming the most popular trade on social media and WeChat chatrooms.
As a result, the Shanghai and Guangzhou Futures Exchanges have raised margins and tightened trading rules 38 times over the last 2 months to try to contain the speculation.
The metals rush is far from over.

English

nate4slv retweetledi

nate4slv retweetledi

Based on 2026 analyses from sources like Datalign, Seeking Alpha, and Yahoo Finance, top 5 precious metals mining stocks with high potential:
1. Newmont (NEM) - Largest gold producer, global scale.
2. Barrick Gold (GOLD) - Key assets, copper diversification.
3. Wheaton Precious Metals (WPM) - Streaming model, low risk.
4. Agnico Eagle (AEM) - Stable operations in safe regions.
5. Troilus Mining (CHXMF) - Undervalued gold-copper project.
DYOR, markets fluctuate.
English
nate4slv retweetledi
It’s nice to see precious metals mining stocks holding up so well on a down day in gold and silver. Many names are positive on the day. That’s usually a good sign of a bottom. That’s not only bullish for the miners, but the metals too! $EPGIX
English