Andrej Karpathy@karpathy
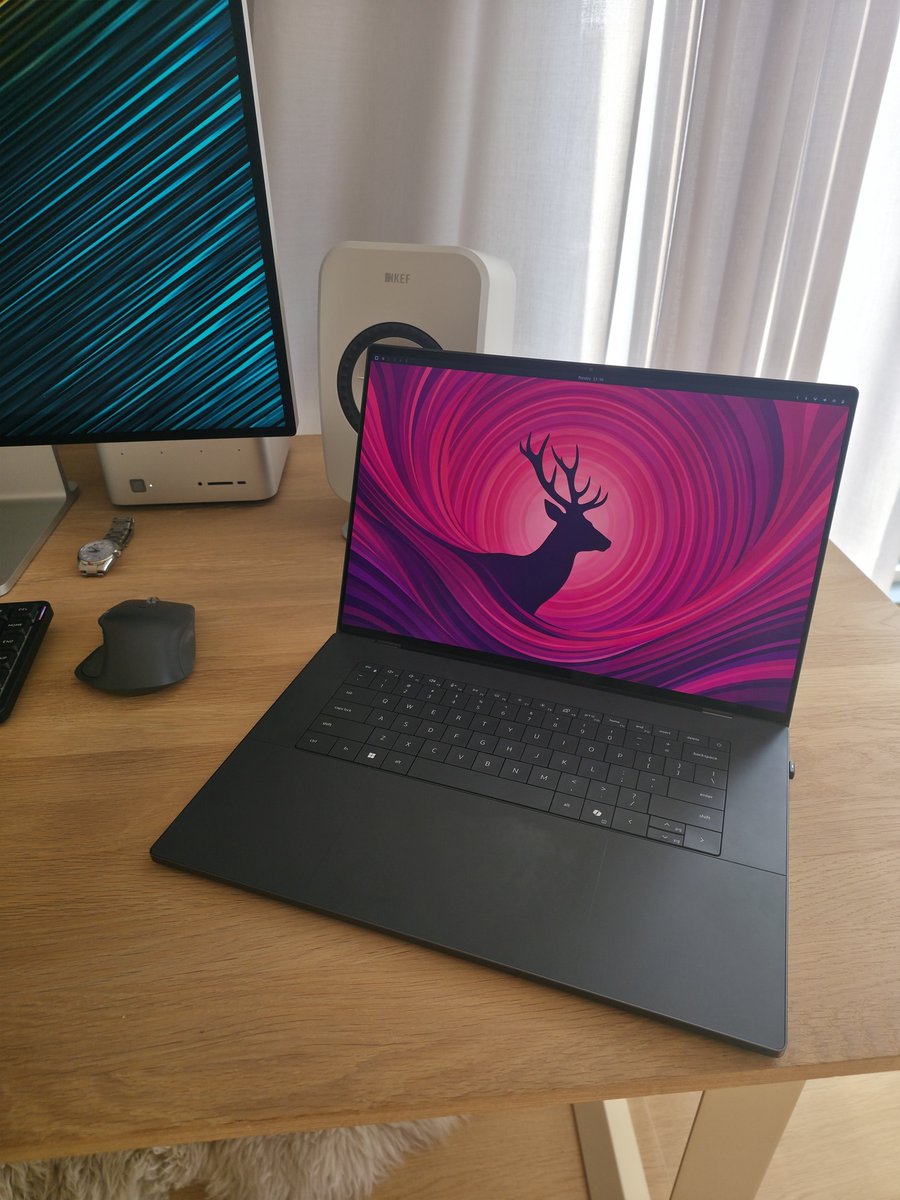
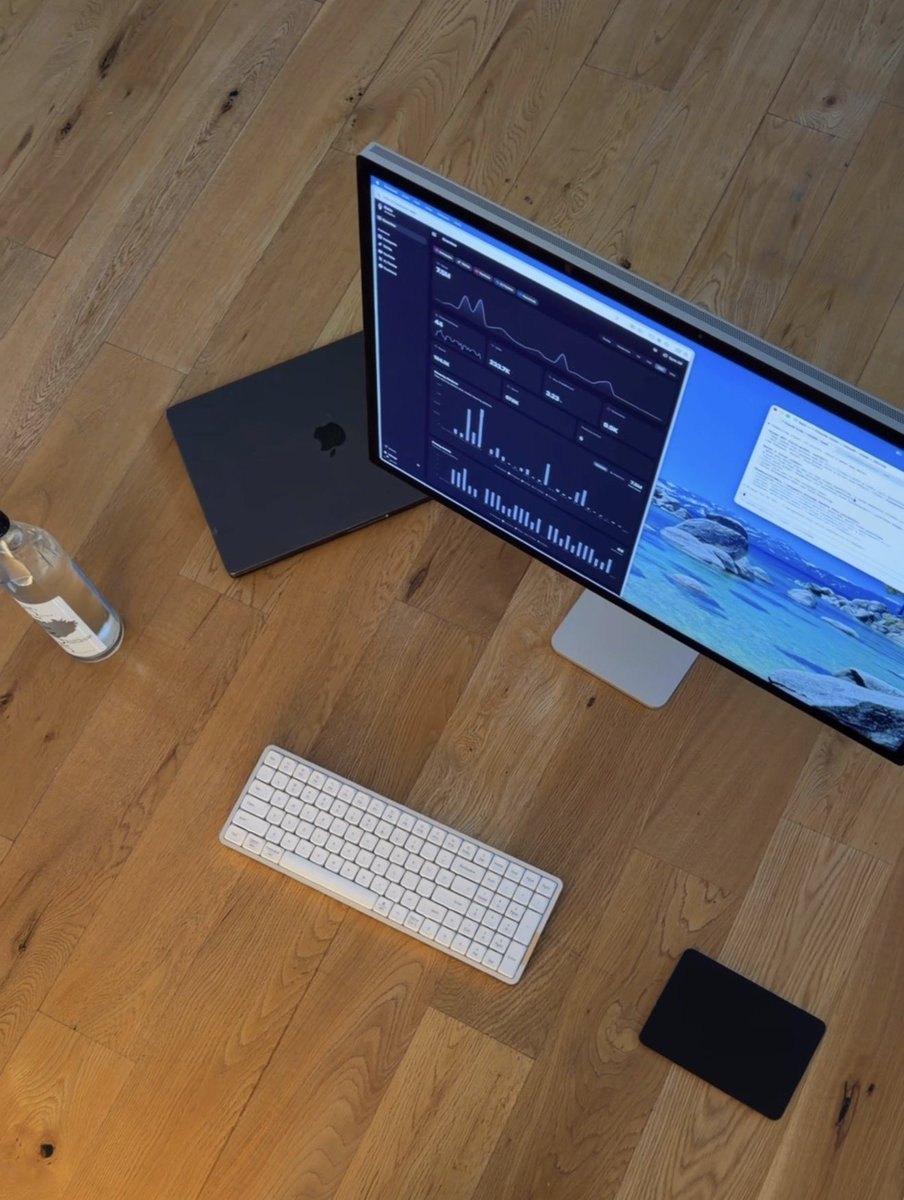
Bought a new Mac mini to properly tinker with claws over the weekend. The apple store person told me they are selling like hotcakes and everyone is confused :)
I'm definitely a bit sus'd to run OpenClaw specifically - giving my private data/keys to 400K lines of vibe coded monster that is being actively attacked at scale is not very appealing at all. Already seeing reports of exposed instances, RCE vulnerabilities, supply chain poisoning, malicious or compromised skills in the registry, it feels like a complete wild west and a security nightmare. But I do love the concept and I think that just like LLM agents were a new layer on top of LLMs, Claws are now a new layer on top of LLM agents, taking the orchestration, scheduling, context, tool calls and a kind of persistence to a next level.
Looking around, and given that the high level idea is clear, there are a lot of smaller Claws starting to pop out. For example, on a quick skim NanoClaw looks really interesting in that the core engine is ~4000 lines of code (fits into both my head and that of AI agents, so it feels manageable, auditable, flexible, etc.) and runs everything in containers by default. I also love their approach to configurability - it's not done via config files it's done via skills! For example, /add-telegram instructs your AI agent how to modify the actual code to integrate Telegram. I haven't come across this yet and it slightly blew my mind earlier today as a new, AI-enabled approach to preventing config mess and if-then-else monsters. Basically - the implied new meta is to write the most maximally forkable repo and then have skills that fork it into any desired more exotic configuration. Very cool.
Anyway there are many others - e.g. nanobot, zeroclaw, ironclaw, picoclaw (lol @ prefixes). There are also cloud-hosted alternatives but tbh I don't love these because it feels much harder to tinker with. In particular, local setup allows easy connection to home automation gadgets on the local network. And I don't know, there is something aesthetically pleasing about there being a physical device 'possessed' by a little ghost of a personal digital house elf.
Not 100% sure what my setup ends up looking like just yet but Claws are an awesome, exciting new layer of the AI stack.