
tfa
255 posts


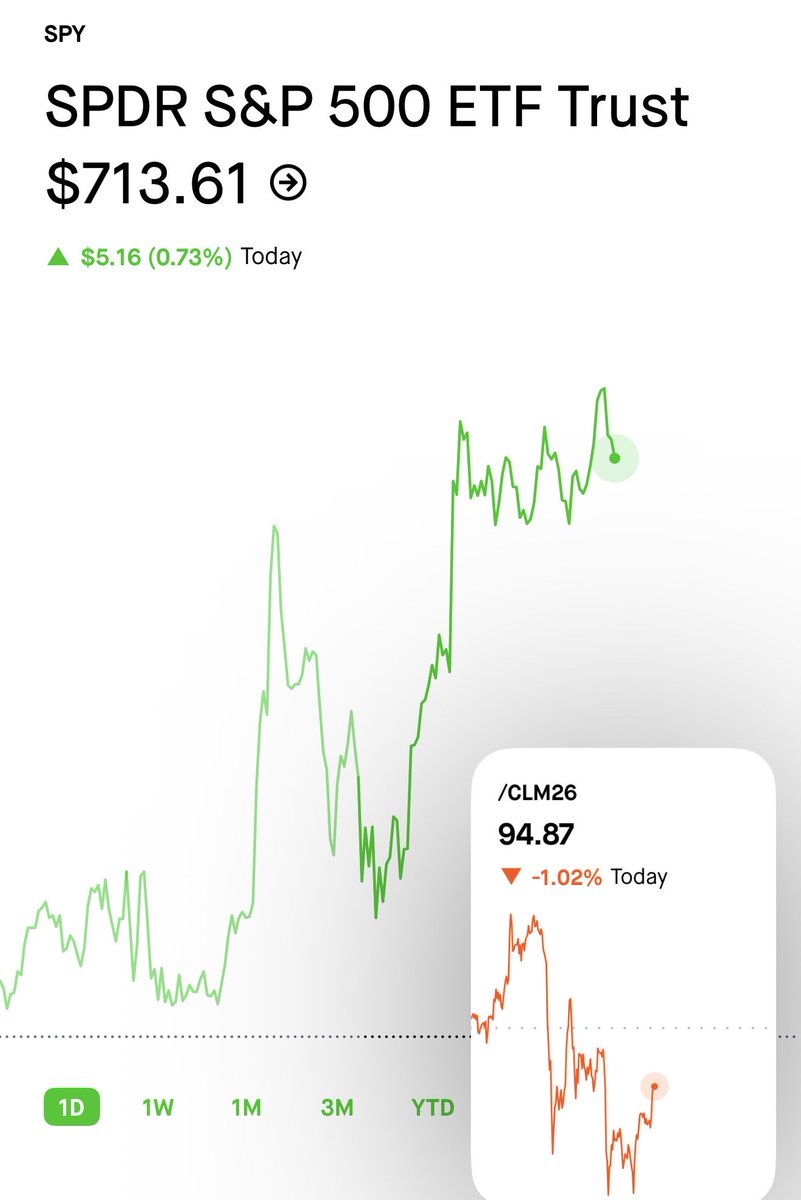
@Polymarket bigger than the 1973 embargo? if so, why is oil not reflecting that yet?
English

JUST IN: S&P Global Vice Chairman warns that the Strait of Hormuz crisis is “the biggest energy disruption we’ve ever seen”
English
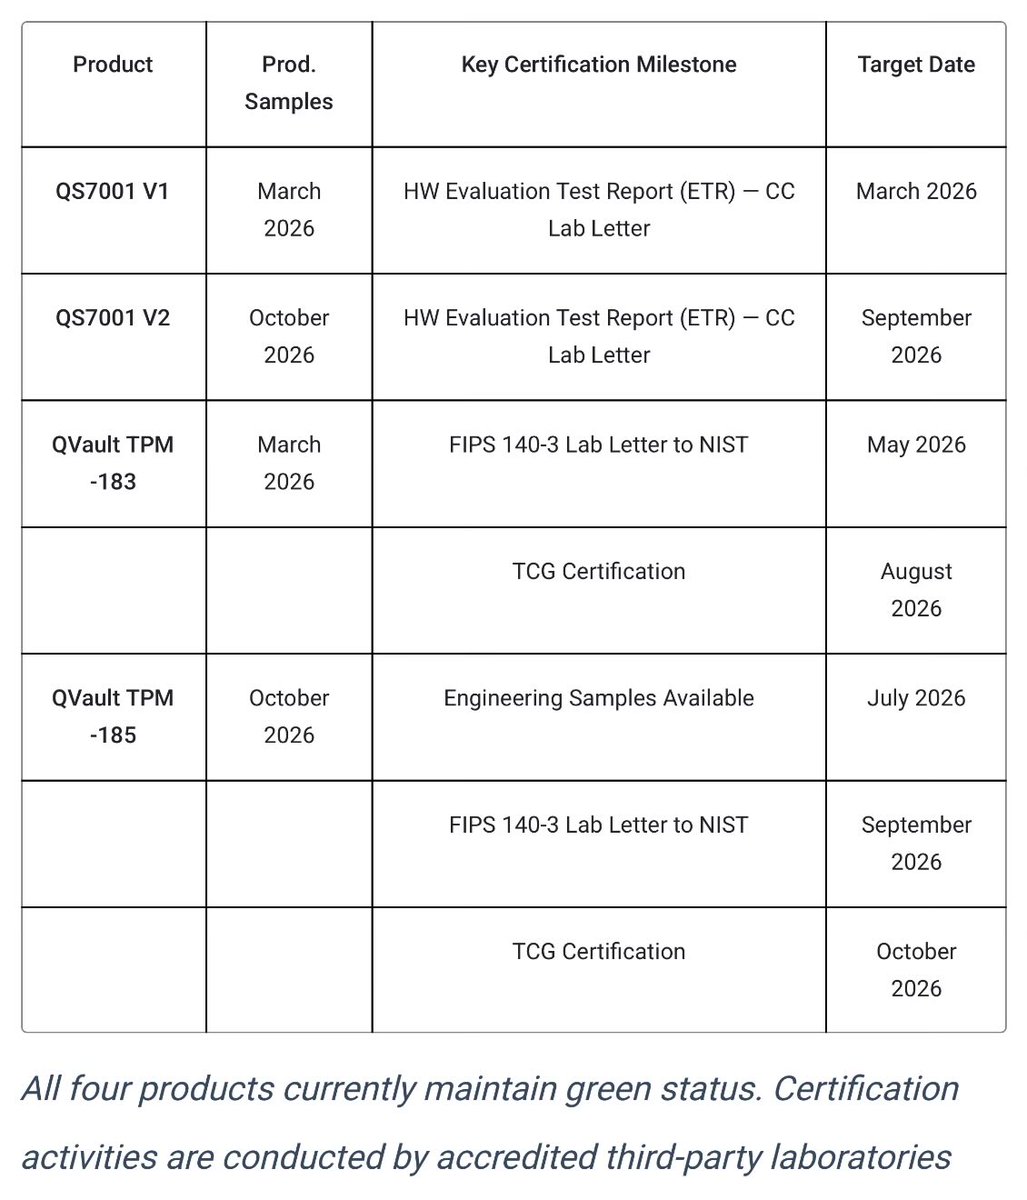
@NAKAMU_buppan Attached is a screenshot of their roadmap.
I’m sharing all of this with you because I lost a lot of time and money last year with $LAES. I believe in this company, too. I will be investing end of year.
Here’s a link to it to research for yourself:
sealsq.com/investors/news…


English
@NAKAMU_buppan Short sellers every time, including Jane Street and CVI.
Best to treat $LAES like an intra week swing trade. Buy low and sell high.
If you’re profitable on a Thursday mid-morning, I suggest selling.
Buy at end of day Friday, or look for a better entry Monday.
English

I’d suggest looking at a different ticker if you want something with a decent chance of profiting from this year.
$LAES will not win any sales contracts until their chip is certified, which is planned for the end of this year (per the roadmap they released with their quarterly earnings).
I attended their quarterly earnings call, too, and this was news to me up to that point. That was when I decided to finally move on.
English
@NAKAMU_buppan Same institution that manages warrant offerings for $LAES is the options dealer for their stock, too. They make money selling call options to us retail folk, then overwhelmingly short sell the stock before Friday expirations.
English
tfa retweetledi

This is the most obvious signal that the diplomats are out.
English

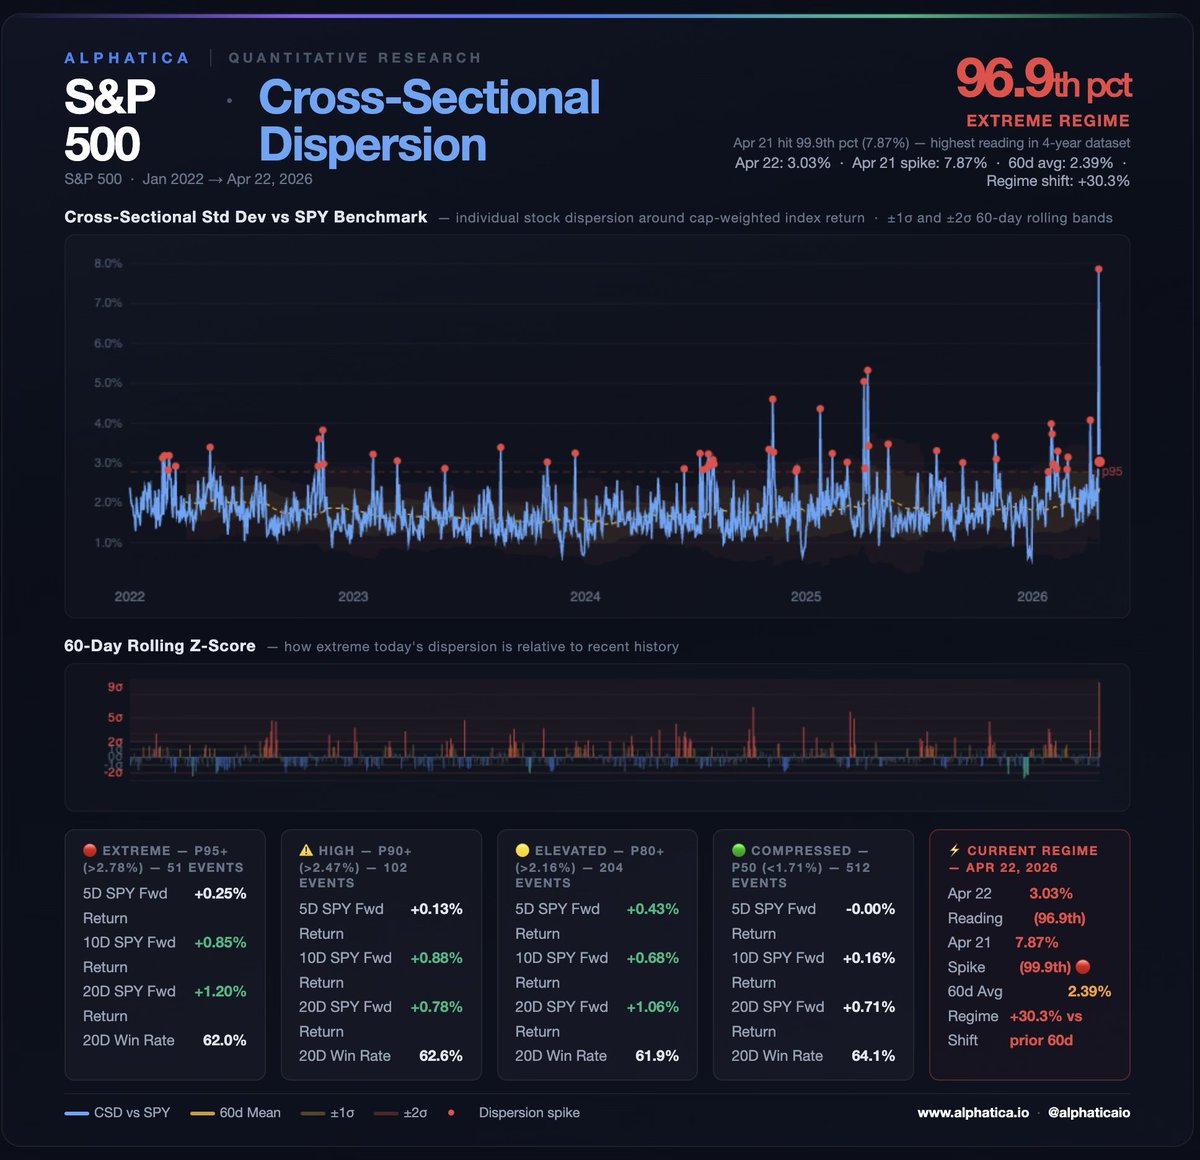
We flagged elevated dispersion on March 26.
Then it got historic.
April 21: 7.87% cross-sectional dispersion. The highest single reading in our 4-year dataset. Higher than the April 2025 tariff crash. Higher than the election. Higher than DeepSeek. SPY was up +6.96% on the same day.
That's the signal. Not the index move. When SPY rips 7% but individual stocks are scattering in every direction, the market isn't moving together; it's repricing. Winners and losers are being sorted in real time. That's what dispersion measures. And right now it's at historic levels.
The regime has been running hot for weeks. 88th pct Apr 8: 99.4th pct Apr 13: 94th pct Apr 17: 93rd pct Apr 21: 99.9th pct ← all-time high Apr 22: 96.9th pct
60-day average is now +30% above the prior 60 days.
What does history say after p95+ dispersion?
→ 20-day SPY return: +1.20% → 20-day win rate: 62%
The near-term is always choppy. The edge is at 20 days, not 5.
So what do you actually do with this?
Two things.
First, stop index watching. In a high-dispersion regime the index return is noise. Individual stock selection is everything. The stocks that held up during this volatility have strong underlying fundamentals. The ones that recovered only because everything bounced are traps.
Second, build your watchlist now. The 20-day forward edge doesn't come from chasing the spike. It comes from knowing which names you want before the next leg. We're running our signal suite across the S&P 500 this week to identify exactly that.
$SPY $QQQ $SPX
English
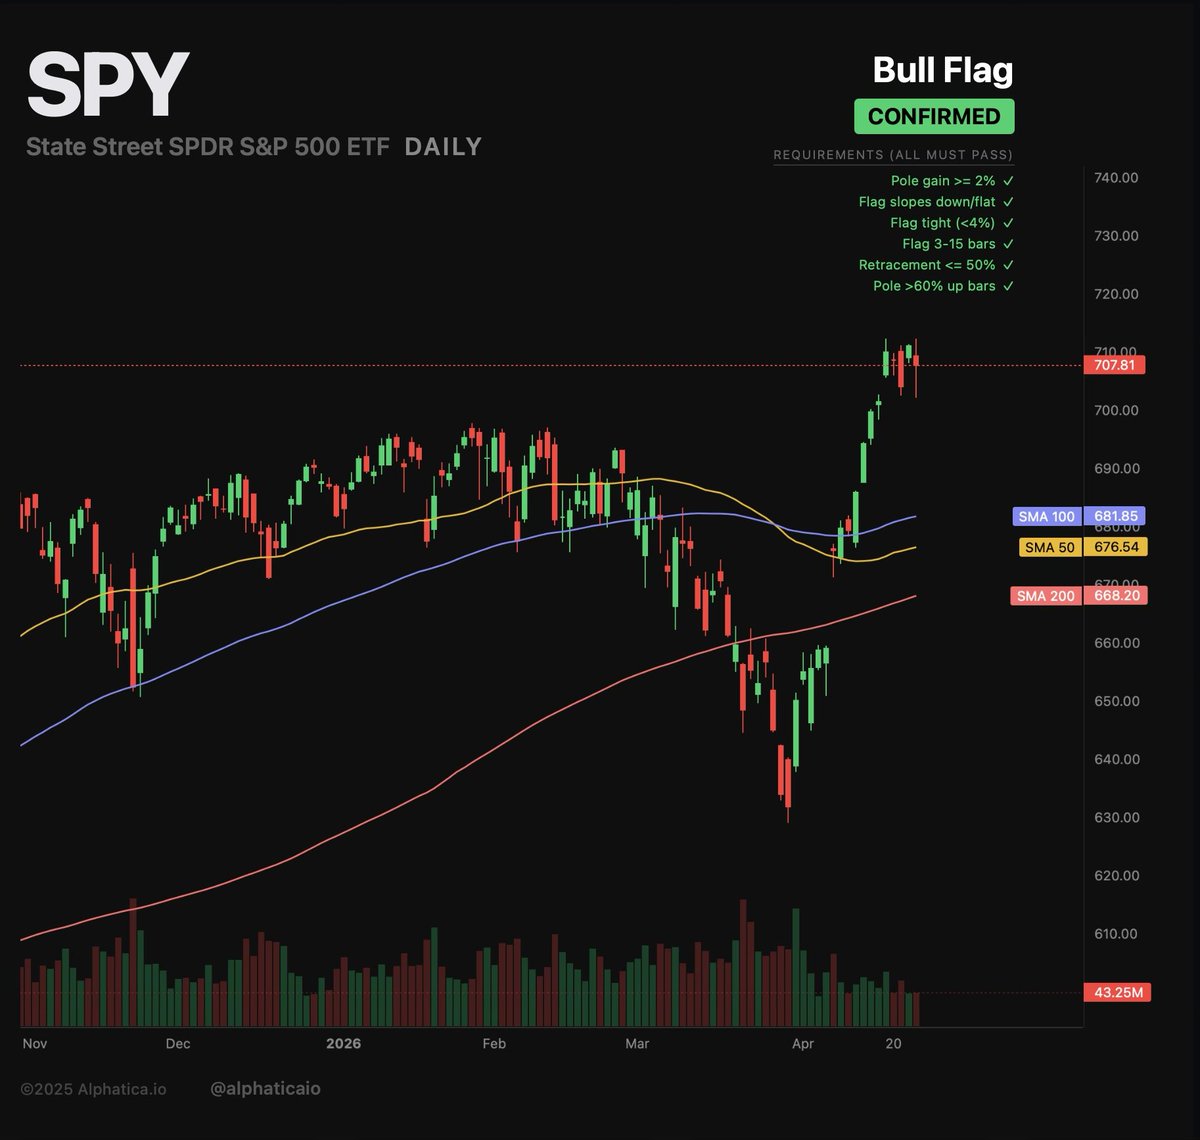
@alphaticaio Great work again; super helpful…
I felt the first faint feeling of confidence come back as I was monitoring these levels on the chart today.
Thank you.
English
SPY UPDATE | Thursday April 23, 3:00 PM | Final Hour
$707.11. Down 0.58%. One hour left. Here's what the structure says about the close.
Composite: -8.0 [Neutral, bearish side]
The good news: the structure improved from 2 PM. GEX went from -$1.23B to -$759M. Still deeply negative, but the worst of the intraday spike has faded. IV pulled back from 19.3% to 17.3%. The vanna tailwind we flagged at 2:30 kicked in. When vol stopped accelerating, dealers bought. That's why we bounced from $706.45.
Net premium nearly equalized: -$37M into puts. Two hours ago it was -$1.30B. The put buying exhausted itself. Call and put premium are essentially 50/50 now. The aggressive repositioning is done for the day.
Dealer short delta rebuilt from 62.9M to 87.1M. Dealers added 24M shares of short exposure back during the bounce. The engine partially restarted.
But the underlying structure hasn't healed:
$708 accelerator at -$108M is 0.1% above price. We're sitting directly on it.
$703: -$97M (0.6% below)
$701: -$98M (0.9% below)
$700: -$143M (1.0% below)
$699: -$108M (1.1% below)
Still five accelerators within 1.1% below price. The trapdoors didn't disappear. They're just not firing because the selling paused.
Call wall compressed to $710. That was the magnet two days ago. Now it's a ceiling at 178K OI. The market's upside expectation keeps shrinking.
PREDICTED CLOSING RANGE: $705 - $709
The magnets pulling up: $715 (+$118M) and $720 (+$109M) are too far to reach in 60 minutes without a headline.
The accelerators pulling down: $700 (-$143M) is 1.0% below. The final hour would need a fresh catalyst to break it.
The pin: $708 accelerator is directly at price. OpEx mechanics from today's 444K expiring contracts and tomorrow's 1.27M create gravitational pull toward the $700-$710 zone.
Max pain at $694 is pulling down. But with 60 minutes left and vol fading, the drift is limited.
Most likely close: $706-$708. Price pins near the $708 accelerator as vol fades into the close. Not enough energy to break $700. Not enough to reclaim $710.
Bullish close scenario ($708-$709): vol continues to compress, vanna buying carries the final 30 minutes, we close near the session's recovery high.
Bearish close scenario ($705-$706): a headline hits or a late MOC sell imbalance pushes through $706 support, testing $705 before OpEx mechanics catch it.
Tomorrow is the real event. 1.27M contracts expire. 901K puts. If we close today above $705, tomorrow's setup favors a grind back toward $710 as puts decay. If we close below $705, tomorrow opens with the accelerator chain active.
$700 held today. Tomorrow decides if it holds the week.
$SPY $QQQ $VIX
English
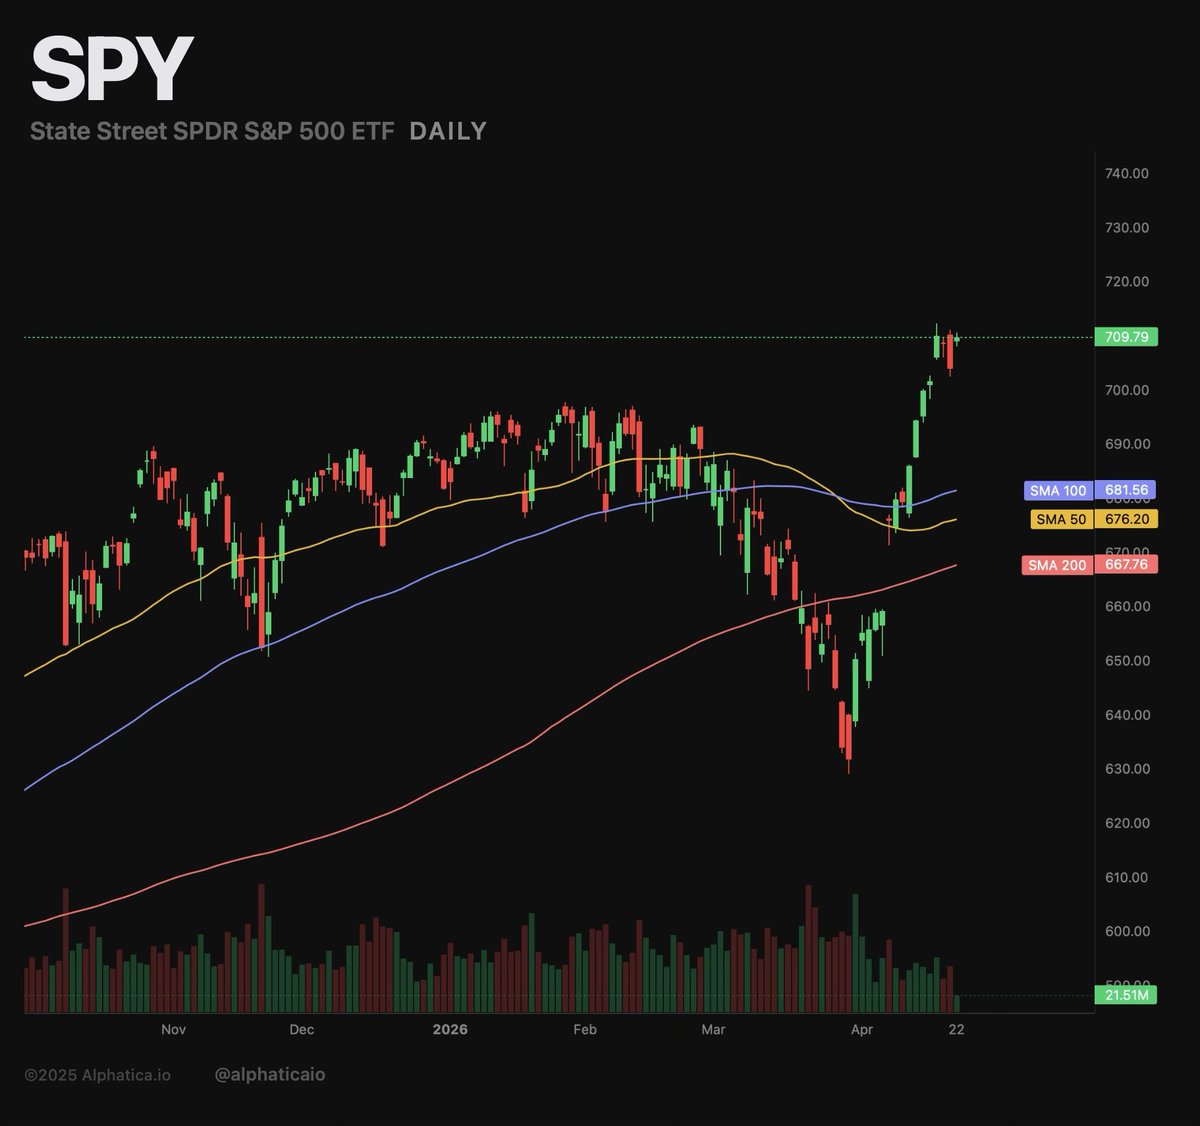
SPY UPDATE | Wednesday April 22, 2:00 PM
$709.86. Up 0.82%. Sitting on the 30-day high for the third time this week. The structure has stabilized.
Composite: +29.8 [Lean Bullish]. Highest reading since the April 17 OpEx peak.
24 hours ago the composite was -6.8 with -$628M of negative gamma and -326M shares of bearish flow. Today it's +29.8 with +$580M of positive gamma and +16.9M shares of bullish flow. That's the most violent two-day structural reversal of the entire cycle. The ceasefire extension did exactly what the mechanics predicted.
What the structure looks like now:
$710 magnet: +$334M. Dominant. Pinning price right here. This is the third session in a row $710 has been the gravitational center. It's becoming the new floor, not just a magnet.
GEX flip: $667. Cushion is 6.0%. The deepest of the entire cycle. Deeper than OpEx day. The floor has never been further away.
IV: 16.5%. Down from 18.8% yesterday. Down 2.3 points in one session. The vol crush is doing the heavy lifting. Vanna is supportive at +14.2K. Vol dropping equals dealer buying. The tailwind is back.
IV skew: +0.52%. Nearly flat. No panic. No FOMO. The market is pricing steady grind.
Dealers short 129.2M shares. Rebuilt from 83M yesterday. The forced-buying engine is back to pre-Tuesday levels. Not at the 215M OpEx peak, but more than enough to support the grind.
Flow today: +16.9M shares long. +$420M into calls. 63% call-heavy. 88% new positioning. The conviction is moderate, not explosive. This is grind territory, not rip territory.
Magnets above $710:
$711: +$89M 🧲
$715: +$102M 🧲
$720: +$99M 🧲
$725: +$92M 🧲
$730: +$64M 🧲
Accelerators below:
$703: -$75M (1.0% below)
$700: -$68M (1.4% below)
$680: -$69M (4.2% below)
The accelerators shrank. $703 was -$136M yesterday. It's -$75M today. $700 was -$119M. It's -$68M. The vol crush is draining the accelerators of their power. That's the structure healing.
What's different from the first rally:
The first 13-day run was powered by 3.2M puts expiring, dense near-term gamma, and IV compressing from 27% to 15%. That fuel is spent.
This leg is lighter. GEX at +$580M vs the +$2B at OpEx. Dealer short at 129M vs 215M. No massive weekly expiration to drive a put unwind. The mechanics are supportive but not explosive.
The grind target is $715-$720. Not $730+ in a week. The magnets are there. The flow supports it. But the velocity will be slower.
The risk hasn't disappeared. It changed shape. There's no deadline on the calendar anymore. The ceasefire is open-ended. That removes the binary event but introduces a different risk: headline sensitivity without a timeline. Any escalation at Hormuz, any breakdown in back-channel talks, any Trump post at 2 AM reprices vol instantly. And the negative gamma accelerators below $703 are still loaded.
The bottom line:
The structure healed. Positive gamma, bullish composite, vol crushing, dealers buying, magnets pulling to $720. The ceasefire extension removed the clock. The mechanics favor higher.
But the underlying conflict is unresolved. Hormuz is closed. Iran isn't talking. The blockade continues. An Iranian gunboat fired on a ship after the extension was announced.
The market is pricing the absence of bad news as good news. That works until it doesn't.
$710 is the pin. $715-$720 is the grind target. $703 is the nearest accelerator. $667 is the floor. The ceasefire clock stopped. The Hormuz clock didn't.
$SPY $QQQ $VIX
English
tfa retweetledi

The market is forward looking.
That's why it can price in $NVDA forward GPU sales at 10% of global GDP, but it can't price in the world's largest oil supply shock in history (on a % normalized basis).
Oil, simply just isn't important for the economy. Nothing is made from it.
English
@commonsenseplay Check out this guy’s channel. I’ve been subscribed for months. You might want to recommend it…
Alan Eyre@AlanEyre1
I now have granular clarity as to what happened yesterday in the SoH, thanks to @mercoglianos. Anyone interested in following this war should have his Youtube channel: @wgowshipping" target="_blank" rel="nofollow noopener">youtube.com/@wgowshipping
on speed-view. English
@commonsenseplay I totally agree with your bullet points but would bet that you’ll be adding the Iran-driven oil spike to your list by/before the end of this summer.
x.com/shanaka86/stat…
Shanaka Anslem Perera ⚡@shanaka86
On Tuesday, April 14, at the HSBC Global Investment Summit in Hong Kong, CEO Georges Elhedery said something on live Bloomberg television that should have detonated every energy desk on earth. It did not. Because nobody is reading what it actually means. “The highest I’ve seen, and I’m hoping we don’t see more of that, but the highest I’ve seen is $286 for a barrel of oil that reached Sri Lanka.” Two hundred and eighty-six dollars. For a single barrel. Delivered. While Brent futures closed at $95.61 on April 16 and CNBC’s chyron still shows “oil near $100.” Read the transcript carefully. Elhedery laid out the arithmetic: Middle East crude is now $140 to $150 at origin. Red Sea rerouting adds $30 to $40 per barrel in shipping. Insurance has gone from 25 basis points to 5 percent, a twentyfold increase. War insurance has been scrapped entirely, meaning the 5 percent buys you no war coverage at all. Stack those numbers on top of Dated Brent physical at $131.97 on April 9, Oman crude at a record $152.58 in March, and Dubai crude at $157.66 in early April, and you arrive at a poor importing nation paying $286 to keep the lights on. This is not an oil price spike. This is the death of benchmark pricing as the world has known it since 1988. For 38 years, Brent and WTI futures have functioned as the nervous system of global oil. Every central bank inflation model, every airline fuel hedge, every sovereign budget in every importing nation, every Fed rate decision, anchors itself to these two numbers flickering on a Bloomberg terminal. The entire post-1973 architecture assumed that paper price and physical price converge within a narrow band, that arbitrage closes the gap, that the benchmark tells the truth. On April 14, HSBC’s CEO told the world, in public, that the paper price is now off by nearly 200 percent from the physical price for the countries that can least afford the difference. A $95 Brent headline and a $286 delivered barrel are not the same commodity anymore. They are two different markets, and the poor are trading in the real one. This is why Sri Lanka, which has no domestic production and imports 100 percent of its fuel, turned simultaneously to Russia, India, and China in the first weeks of April. President Dissanayake publicly thanked all three on April 8. India delivered 38,000 metric tonnes on March 28. Sinopec is running sustained shipments. Russia has formalized supply arrangements despite US sanctions. Colombo, a capital of 1.7 million people in a country still recovering from the 2022 sovereign default, has accidentally become the first live demonstration of what post-dollar, post-Brent, multipolar energy sourcing looks like in practice. Not in a think tank paper. In actual cargoes arriving at actual ports. Every central bank pricing inflation off Brent is flying blind. Every airline hedged on WTI is mispriced. Every AI data center operator who modeled a 2030 power buildout on pre-war energy assumptions just watched the assumption disintegrate. Goldman’s 1,350 TWh data-center forecast assumed a world where a $95 Brent headline means $95 oil arriving at the meter. That world ended on February 28. The $286 barrel did not reach Sri Lanka. Sri Lanka reached the future first. Everyone else is still reading yesterday’s screen. Full Analysis - open.substack.com/pub/shanakaans…
English

I built my position in $TLT At the end of 2025 after a +95% run in stocks for the preceding 12 months.
Since then, it’s down ~1% - but the monthly yield keeps me in profit with my original position.
Nothing about my thesis has changed. The Iran-driven oil spike? Noise.
The real story:
- Jobs market weakening
- Consumer slowing
- Private Credit cracks forming
- Delinquencies rising
- Housing completely stalled
Rates are coming down. The incoming Fed leadership + massive refinancing needs over the next 12–18 months make that inevitable.
Say what you want - I’ll judge this position in December 2026.
This was always a 12-month thesis.
Long bonds are 50% of my portfolio.
I’m betting they outperform equity indexes in 2026.

English
tfa retweetledi

I now have granular clarity as to what happened yesterday in the SoH, thanks to @mercoglianos.
Anyone interested in following this war should have his Youtube channel: @wgowshipping" target="_blank" rel="nofollow noopener">youtube.com/@wgowshipping on speed-view.
Sal Mercogliano (WGOW Shipping) 🚢⚓🐪🚒🏴☠️@mercoglianos
@christankerfund That is because Sal posted his video! 🤣 Plus he is counting all the money he made on the oil market yesterday. Video: youtu.be/G8eP2Oqps24
English

Who keeps making these trades???
There needs to be an investigation.
The Kobeissi Letter@KobeissiLetter
Is this the best timed trade of 2026? Yesterday, at 8:24 AM ET, oil traders bought nearly $800 MILLION worth of oil shorts. Just 21 minutes later, Iran's Foreign Minister Araghchi said the "Strait of Hormuz is declared completely open." By 9:10 AM ET, oil prices had collapsed to $80 per barrel and hit their lowest level since March 10th. These same oil shorts made nearly $70 million in profit in less than one hour, according to our analysis. Truly unusual.
English
@commonsenseplay Let me know if you’re willing to take that bet.
:-)
The Kobeissi Letter@KobeissiLetter
It's official: We are now witnessing the largest energy supply disruption in modern history. Since the start of the Iran War on February 28th, more than 500 million barrels of crude and condensate have been removed form the global market. In other words, global supply has now lost ~$50 billion worth of crude oil production since the Iran war began nearly 50 days ago. This is the same amount of fuel it takes to run the world's international shipping industry for 4 months. The world has never seen anything like this before.
English