
Breakout Trading Academy

3.2K posts

Breakout Trading Academy banner
Breakout Trading Academy

Breakout Trading Academy

@onlybreakouts

Formerly Better Trader Academy. The home of "Mr Breakouts". Algo Breakout Trading Specialists. Follow for tips and strategies on algorithmic breakout trading.

Katılım Nisan 2018
11 Takip Edilen6.3K Takipçiler
Sabitlenmiş Tweet
Breakout Trading Academy
Breakout Trading Academy@onlybreakouts·
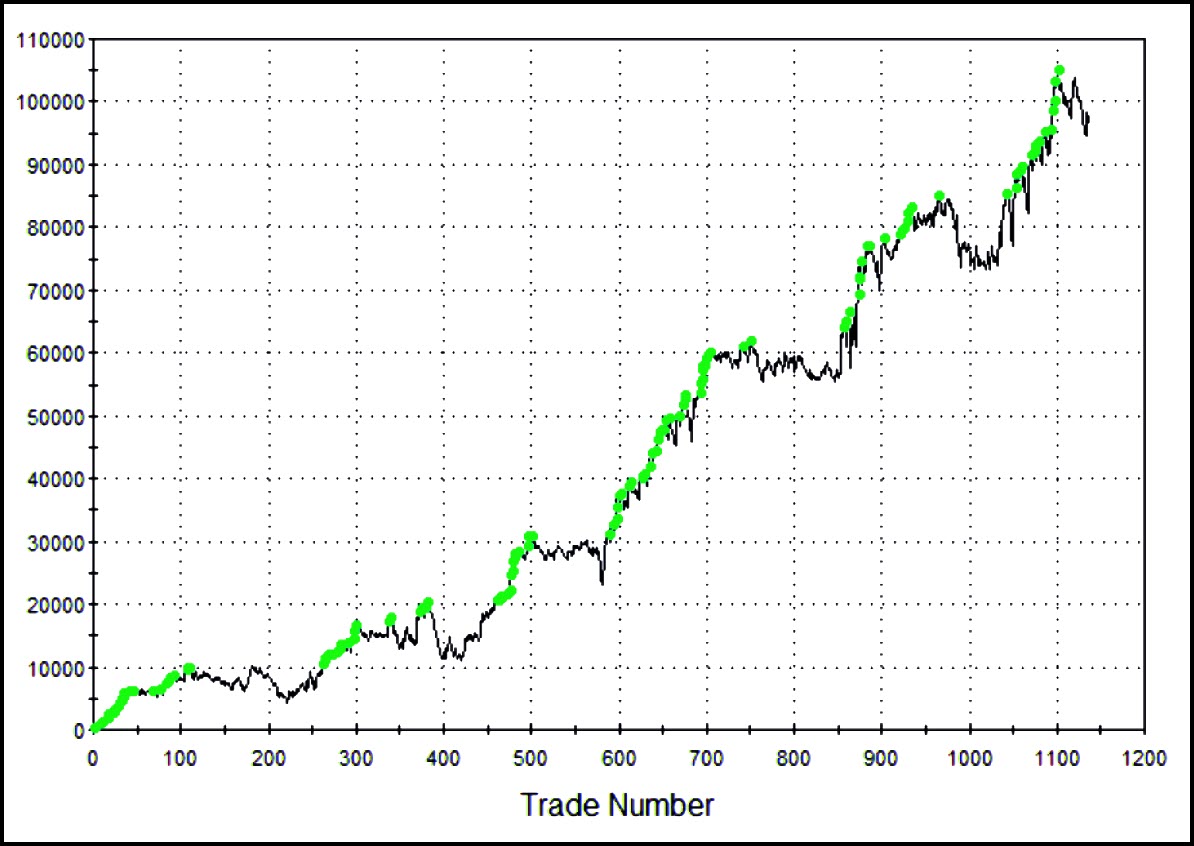
One condition. No indicator. No parameter to optimize. It filtered 80% of bad trades from a NASDAQ breakout strategy. The condition: is the high of the entry bar above today's open? That's it. One line of code. If yes, the market has been trading above today's open. There's an established uptrend for the day. Enter the long breakout. If no, the market is below today's open when your signal fires. You're not in an uptrend. You're trading noise. Skip. Before: - Net profit/drawdown ratio: 5.24 - Drawdown: ~$40,000 - Average trade: $120 After: - Net profit/drawdown ratio: 7.97 - Drawdown: ~$25,000 - Average trade: $162 Net profit went up while drawdown got cut. That's the signature of a genuine filter. It's removing the right trades, not random ones. Why does it work? Breakout trading is about momentum. If you're buying a breakout to the upside but the market has been trading below its open all day, there's a contradiction. The price level is breaking out, but the day's direction says otherwise. Those trades are the ones that chop you up. No parameters means no overfitting. This is pure trading logic. You could test it on any long breakout strategy, on any market, in minutes. The power isn't in complexity. It's in asking the right question. What's the simplest filter you've ever used?
Breakout Trading Academy tweet media
English
12
20
179
112.5K
Breakout Trading Academy retweetledi
Breakout Trading Academy
Breakout Trading Academy@onlybreakouts·
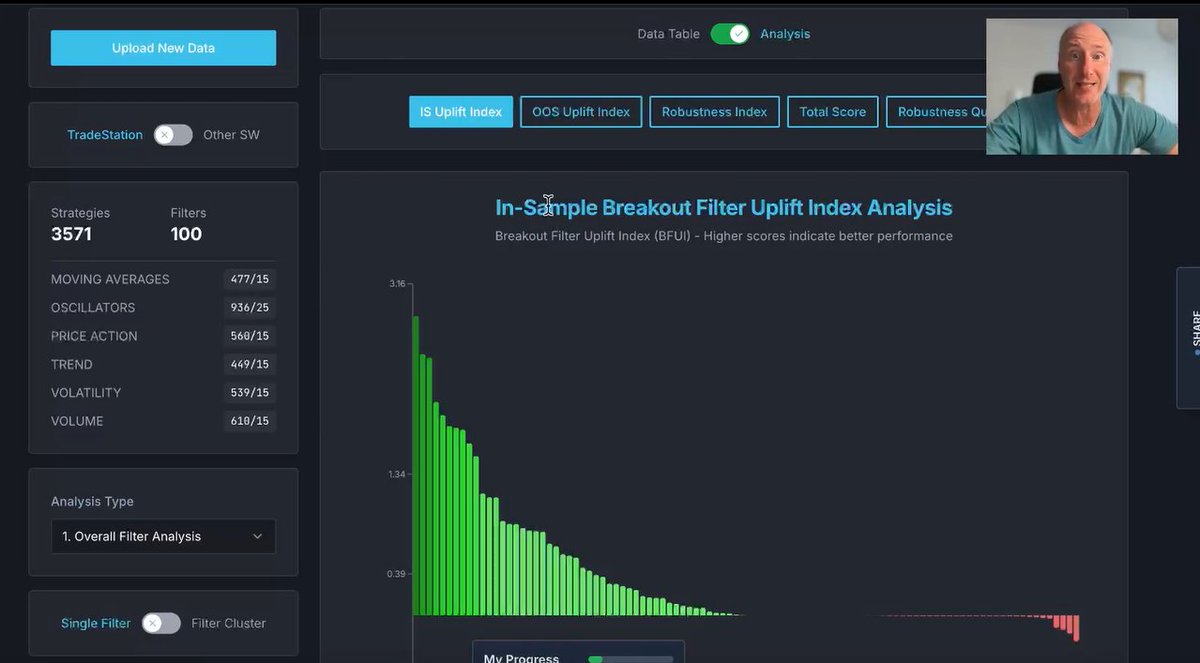
I often think more indicators = more edge. But when I tested 100 different indicators as filters, the truth was very different. I tested all of them on 3,500 breakout strategies on Nasdaq 60m. I clustered them into 6 categories - volume, volatility, moving averages, oscillators, trend, and price action. Each was ranked with hedge-fund level uplift and robustness indexes. The results? ➝ Many indicators did nothing. ➝ Some broke strategies completely. ➝ ATR and Bar Range consistently delivered stronger profits, lower drawdowns, and higher win %. These are simple volatility indicators, yet, work like magic! And they crushed 98 others in real, robust testing! Watch the video and get the free resource in the comments ↓
Breakout Trading Academy tweet media
English
6
4
37
4.4K
Breakout Trading Academy
Breakout Trading Academy@onlybreakouts·
Here is every decision made in building a NASDAQ breakout strategy from scratch, and the data behind each one. Every strategy in this framework starts from the same formula: Point of Initiation + (Space Multiplier x ATR) = Breakout Level The formula is simple. The decisions are what matter. Decision 1: Which session to trade. NASDAQ trades 23 hours a day. But not all 23 hours carry the same quality. The bulk of meaningful volume concentrates in the main US session between 9 AM and 3 PM ET. There is a volume spike at 9 AM, sustained participation through midday, and a clear drop-off after 3 PM. This matters for breakout trading specifically. A breakout that triggers during the overnight session may have no real participation behind it. Without volume, the move fizzles. Restricting entries to the 9 AM to 3 PM ET window filters out that category of false entries automatically. The volume profile in the Market Mapper tool makes this boundary visible directly from the data. Decision 2: How long to hold the trade. The first version of this strategy used a 24-hour hold, which is 23 bars on the 60-minute chart accounting for the one-hour gap between sessions. It showed a directional bias but nothing tradeable. The equity curve was rough and the drawdowns were too deep. Cutting the holding period to 10 bars, 10 hours on the 60-minute chart, changed the picture significantly. The equity curve smoothed out, drawdowns shrank, and the risk profile became viable. This is a pattern that shows up repeatedly across index markets: shorter holding periods often outperform longer ones because they avoid overnight risk and the mean-reversion forces that work against breakout entries held too long. Decision 3: Where to set the breakout level. The point of initiation is yesterday's close at 3 PM ET. The ATR period used is 14, a deliberately standard setting that provides a stable volatility measure without overreacting to single-day moves. The initial space multiplier was 2. It produced too many trades with a low average profit per trade. Moving to 3 reduced trade count and improved equity smoothness. But the key question was whether 3 was genuinely robust or just a number that happened to fit the backtest. The Breakout Space Calibrator tested the strategy across a range of multiplier values, evaluating each on net profit calibration, net profit/drawdown calibration, win rate, and the Breakout Singularity Confidence Index. Space multiplier 3 ranked highest on every metric except win rate, where it came in second at 58.4%, still well above average for breakout strategies. The Confidence Index for space 3 was 100%, the maximum possible score. To stress test this result: the calibration was re-run with only 75% of historical data in-sample. Space 3 remained at the top with 100% confidence intact. Isolating only the last 3 to 4 years of data showed the same outcome. The parameter is not fitted to a specific historical window. Decision 4: Which days of the week to trade. Day-of-week analysis showed strong, consistent performance on Monday through Thursday. Friday was examined as a candidate for removal. The result: removing Friday actually worsened overall results. So all five trading days stay in. What this strategy is and is not. After all four decisions: E-mini NASDAQ, 60-minute bars, long only, entries between 9 AM and 3 PM ET, yesterday's 3 PM close plus 3x ATR(14) as the breakout level, exit after 10 hours, all five days of the week. This is a base strategy. It is a validated foundation with every key decision backed by data rather than intuition. It is not a finished product. Adding one or two independently tested filters and completing full forward testing are the next required steps before deploying live capital. The entire build, from loading data to a calibrated base strategy, took under five minutes.
Breakout Trading Academy tweet media
English
2
4
17
1.2K
YoungBoy.
YoungBoy.@YoungBoy_112·
@onlybreakouts It’s possible. In fact, these days, if you’re not trading with AI, it’s seen as falling behind in performance. That’s why I’m trying to get accustomed to BingX tools, they’re integrating AI to help traders trade more efficiently
English
1
0
1
12
Breakout Trading Academy retweetledi
Breakout Trading Academy
Breakout Trading Academy@onlybreakouts·
"Can AI really build profitable trading strategies?" I get asked this constantly. Here's my honest answer after a year of using AI in my workflow. No. AI cannot build a profitable strategy from scratch. I've tried multiple times with every major AI tool available. The strategies it generates without human guidance are either overfit, impractical, or built on concepts that don't hold up in live trading. And yet, AI can dramatically improve strategies that already have a solid foundation. That's where the real value is. The difference: When I ask AI "build me a profitable NASDAQ strategy," I get garbage. The AI doesn't understand execution costs, slippage, or the difference between a backtest and real money on the line. When I ask AI "I have a breakout strategy using ATR for entries and ADX for filtering. The drawdown is too high. Suggest three alternative approaches to the ADX filter that might reduce drawdown while preserving the edge," I get brilliant ideas. One of those ideas cut drawdown by 50% and doubled net profit. Another led to a completely new indicator approach I wouldn't have considered in 25 years of doing this manually. AI is extraordinary at recombining known concepts in new ways. It's terrible at generating concepts from nothing. Your job: build the foundation. Know your market, your edge, your framework. Ask AI specific, targeted questions. Validate every suggestion out of sample. AI's job: suggest variations you wouldn't reach for on your own. Generate code quickly. Research new areas faster than you could manually. The traders who will get the most from AI already know how to trade. They're using it to accelerate the process, not replace it.
Breakout Trading Academy tweet media
English
9
3
42
2.7K
Simon | 🟢
Simon | 🟢@SimonWafya·
@onlybreakouts Exactly, it will do a stellar job of refining and improving many parameters to get you to where you want to go, but it's not a genie.
English
1
0
0
9
Breakout Trading Academy
Breakout Trading Academy@onlybreakouts·
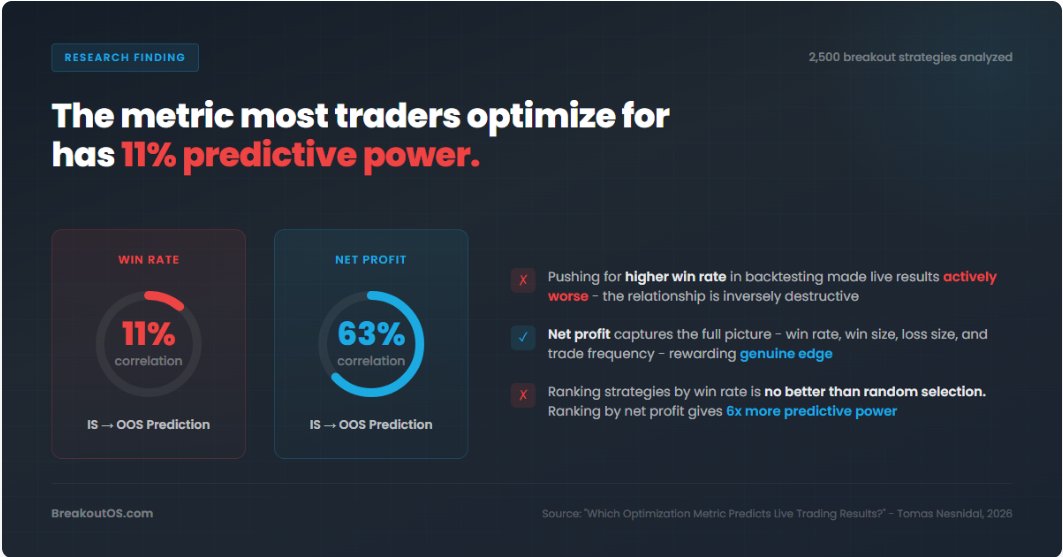
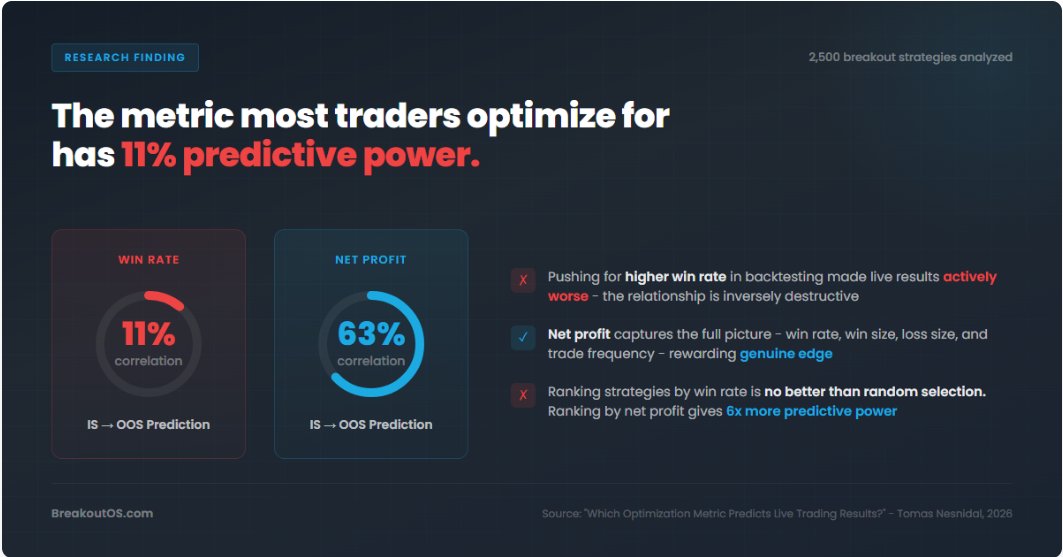
If you found this useful, I published FREE research on why optimizing for win percentage destroys live performance and what to use instead (data from 2,500 strategies). Read it here: go-bta.com/research-fitne…
Breakout Trading Academy tweet media
English
2
0
0
170
Breakout Trading Academy retweetledi
Breakout Trading Academy
Breakout Trading Academy@onlybreakouts·
Most traders wait for ADX to rise before entering a trade. That’s a mistake. Our hedge fund tested ADX in 2,500+ breakout strategies. And the truth is: 📌 SHORTS → ADX > 30 works 📌 LONGS → low ADX = higher edge The best long trades come before the trend becomes obvious, when ADX is still quiet. So we use a reverse ADX entry for longs and pair it with: • Breakout trigger = low + (3.3 × open–low) • Stop orders only • Entry time: 8am–3pm • Exit: ADX > 40 or time-based bar cap Simple setup. No hype. REAL RESULTS. Full walkthrough and free minicourse in the comments.
Breakout Trading Academy tweet media
English
4
13
112
12.1K
Breakout Trading Academy
Breakout Trading Academy@onlybreakouts·
Sure, I don't know what I am doing. Being a full-time trader for 25 years, running my own hedge fund and developing automated portfolios for institutional international clients for the last 5 years - yes, I still consider myself to be a newbie. So, yes, I admit: I still do not know what I am doing. Nor do all the geniuses constantly trying to prove how smart they are and trying to explain to me how much of an idiot I am. Good luck with everything! 😉
English
1
0
0
33
Truth Teller
Truth Teller@VeritasTeller·
@onlybreakouts so you develop the strategy first, using all data 2016-2023. THEN you do walkforward on the same data used to develop the strategy. LMAOOO. Textbook massive data leakage. You've got no clue what you're doing, do you ?
English
2
0
0
55
Breakout Trading Academy retweetledi
Breakout Trading Academy
Breakout Trading Academy@onlybreakouts·
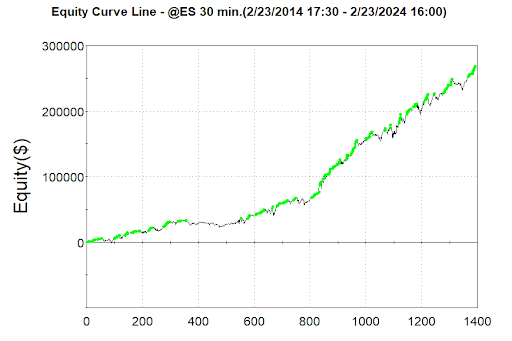
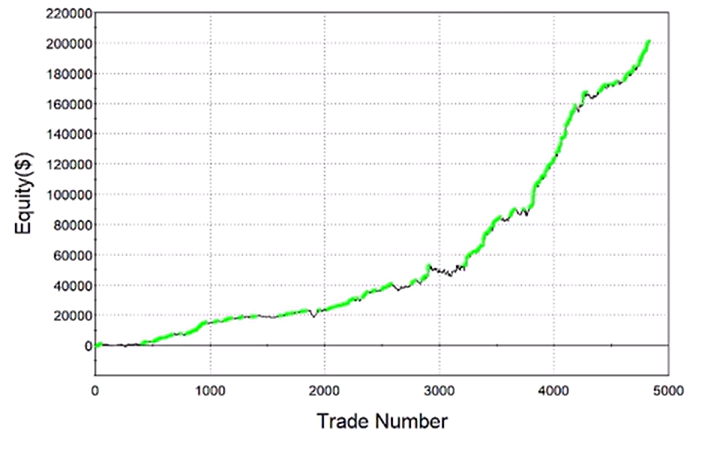
I built a validated NASDAQ breakout strategy in about 15 minutes. Here is the exact process. Market: E-mini NASDAQ Timeframe: 60-minute bars Data: 10 years of clean historical data The starting point was generating foundational models. These are pure breakout entries with nothing added yet. No trend filter. No time filter. Just a point of initiation and a space calculation that defines how far price needs to move before the entry fires. Points of initiation tested: > Close of the previous day > Simple moving averages at periods 10, 20, and 50 > Previous day's high and low > Current day's high and low > Pivot points Space calculations tested: > ATR period 5 > ATR period 20 > ATR period 40 Session: full day and pre-market through main session, with an end-of-day exit. Once the models were generated, the data was automatically split into two portions. Everything before the last three years became in-sample. The last three years were held back as out-of-sample. Development happened on the in-sample portion only. The top-ranked foundational model: > Point of initiation: pivot point > Space calculation: ATR 20, multiplier of 2 > Entry: stop order at the breakout level > Exit: end of day When the out-of-sample results were revealed, the equity curve held up. Three years of data the strategy had never seen, and the performance tracked what we saw during development. That is the first real evidence of a genuine edge. Next: walk-forward analysis. The same model was tested across multiple consecutive windows from 2016 through 2026. It ranked number one across all of them. Robustness index: 66%, shown in green. For a foundational model with zero filters applied yet, that is a solid starting point. From here, you add layers. Each one tested with the same IS/OOS process: > Trend filter > Time-of-day filter > Volatility condition > Stop loss and profit target > Cross-validation on a correlated market All of it builds on a foundation that was validated before a single dollar was risked. That is the part most traders skip when they deploy Pine Script strategies from TradingView. The backtest worked. The validation never happened. Fifteen minutes to a foundational model that has actually been tested. The rest is building on something that holds up.
Breakout Trading Academy tweet media
English
4
8
78
5.8K
Crypto_Cypher
Crypto_Cypher@Crypto_Cypher_·
@onlybreakouts do you have ideas to backtest for XAUUSD , BTC and S&P too ? You only seem to be expert in Nasdaq
English
1
0
0
16
Breakout Trading Academy
Breakout Trading Academy@onlybreakouts·
They told us to avoid low ADX. Turns out... that's exactly where the real edge hides. 📉 SHORTS → ADX > 30 = confirmation 📈 LONGS → low ADX = real edge Low ADX signals coiled volatility. It’s not chop. It's a buildup. So we built our model breakout strategy using: • Volatility = open–low difference • Breakout level = low + (3.3 × volatility) • Stop entries only • Entry filter: 8am–3pm • Exit: when ADX > 40 or after time limit This flip gave us a consistent edge in markets most traders avoid. Full breakdown + free resource in the comments
Breakout Trading Academy tweet media
English
7
21
162
15.3K
Breakout Trading Academy
Breakout Trading Academy@onlybreakouts·
If you found this useful, I published FREE research on why optimizing for win percentage destroys live performance and what to use instead (data from 2,500 strategies). Read it here: go-bta.com/research-fitne…
Breakout Trading Academy tweet media
English
0
0
1
277
Breakout Trading Academy
Breakout Trading Academy@onlybreakouts·
Opening a platform with hundreds of features and no clear process is how weekends disappear without a finished strategy. The order you do things matters as much as the tools themselves. More here: go-bta.com/breakout-tradi…
English
0
0
1
260
Gioele Buonadonna
Gioele Buonadonna@gioele_openq·
This is gold 🔥 Most traders slap together a Pine Script breakout, see a nice equity curve in the backtest and go live… then wonder why it blows up. You just showed the real process: proper IS/OOS split + walk-forward + robustness ranking in 15 mins. That pivot + 2x ATR(20) with EOD exit holding up out-of-sample is exactly why validation beats optimization every time. Saving this thread. Anyone serious about algo breakouts needs to see this. @onlybreakouts
English
3
0
0
145
Breakout Trading Academy
Breakout Trading Academy@onlybreakouts·
If your strategy only works on the market it was built on, that's a red flag. Structural edges tend to show up across related markets too. Cross-market validation is one of the strongest checks you can run before going live. More on this: go-bta.com/breakout-tradi…
English
0
0
1
388